K. OGATA
170
ranged from fondling, genital touching, and masturbation of or
by another person to attempted or completed vaginal inter-
course. Secondly, 12 CPA cases, who had been tested using the
WISC-III and had no experience of other forms of maltreatment
from their records, were matched for sex and age in months,
which was limited to the range from one year or older to one
year or younger than that of the CSA counterpart. Physical
abuse consisted of bruises, burns, cuts, scratches, or bone frac-
tures. Thirdly, 12 CN girls were selected using the same criteria
as the CPA group. Neglect was composed of two subtypes: the
first subtype, failure to provide, involves the failure of the care-
giver or responsible adult to meet the minimum physical needs
of the child; the second subtype, lack of supervision, occurs
when the caregiver or responsible adult does not take sufficient,
developmentally appropriate action to ensure the child’s safety
inside and outside the home setting. Finally, 12 girls who had
neither been abused nor neglected from their records and had
been tested using the WISC-III was matched for comparison
(Non-Maltreated: NM group). The NM group on CGC had such
alleged problems as 4 juvenile delinquency, 2 truancy, 2 low
school achievement, 3 school refusal, and 1 intellectual disabil-
ity. The child who was alleged by her parents to have intellec-
tual disability was tested and the results disproved this assertion.
The NM group did not experience any maltreatment, according
to information in the records obtained from their parents. All
CGC reports, whether substantiated or not, were considered
reliable indicators of maltreatment in Japan. The sample selec-
tion in this study included only the above criteria and other
clinical data were not involved. All 48 participants were girls
and their mean ages ranged from 7 to 16 years, as shown in
Table 1.
Procedures. A child’s cognitive development was measured
by the WISC-III Japanese version; the author confirmed from
the case file s that a trained chil d psychologist had administered
the WISC-III to the child in a CGC. The WISC-III Japanese
version has been standardized using a national sample of 1,125
children ranging in age from 5 through 16 years and 11 months.
In Japan, the WISC-III was revised from the WISC-R in 1998.
Psychometric traits of the WISC-III Japanese version were
adequate for reliability and validity (Wechsler, 1991/1998).
Reliability coefficients, based on split-half correlations, range
from .64 to .85 for the 10 core subtests, and .95 for the FIQ;
reliability coefficients, based on test-retest correlations, range
from .54 to .89 for the 10 core subtests, and .93 for the FIQ
(Wechsler, 1991/1998). Construct validity was also confirmed
using factor analysis; the four factor model was adopted, which
is the same as the original Wechsler model. The test comprises
10 core and 3 supplemental subtests. This study analyzed only
the 10 core subtests because a large number of values were
missing on the supplemental subtest scores.
Results
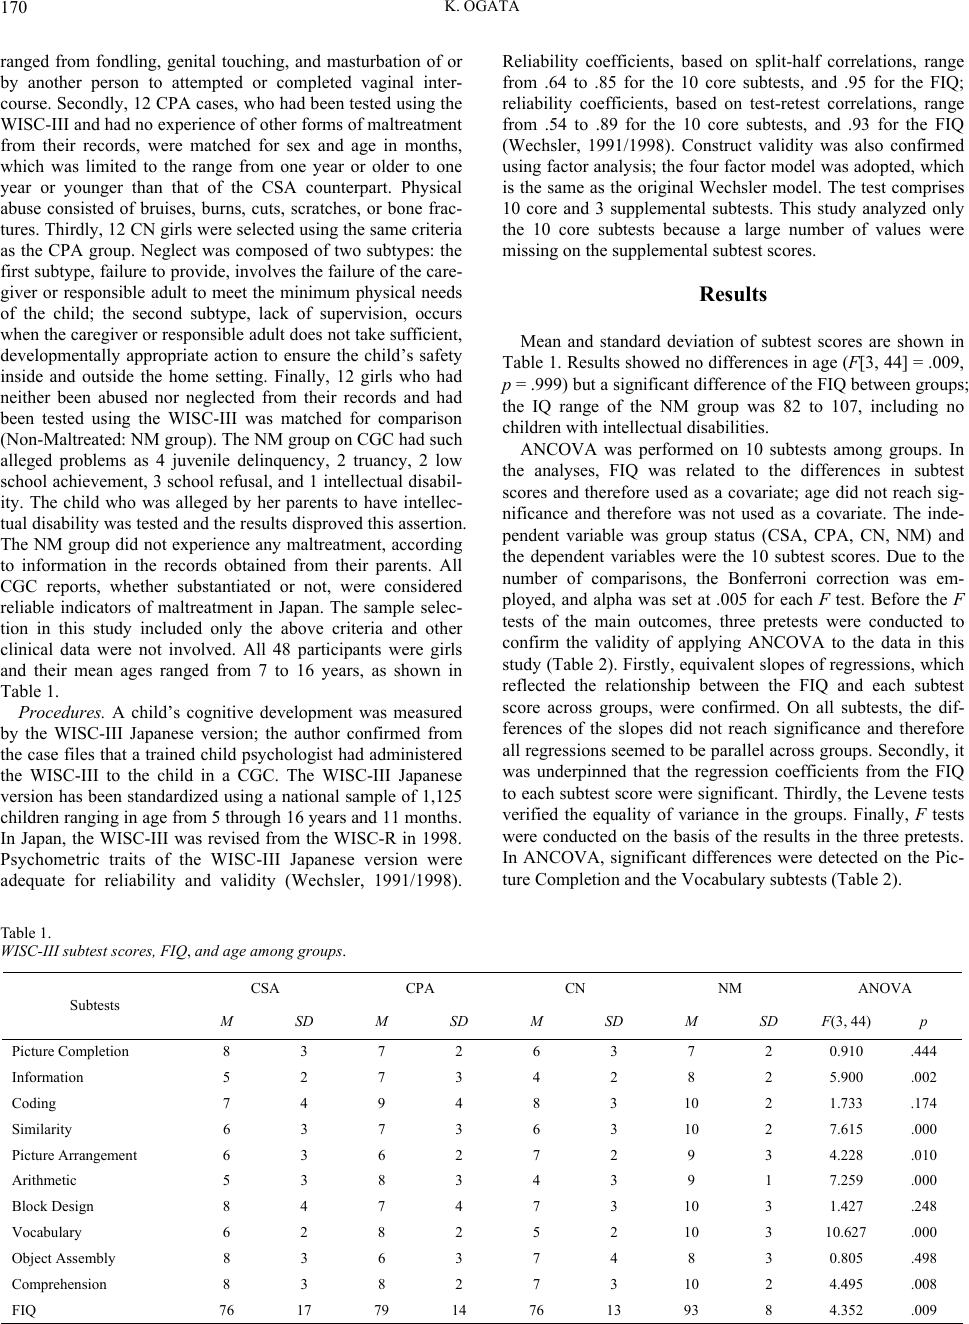
Mean and standard deviation of subtest scores are shown in
Table 1. Results showed no differences in age (F[3, 44] = .009,
p = .999) but a significant difference of the FIQ between groups;
the IQ range of the NM group was 82 to 107, including no
children with intellectual disabilities.
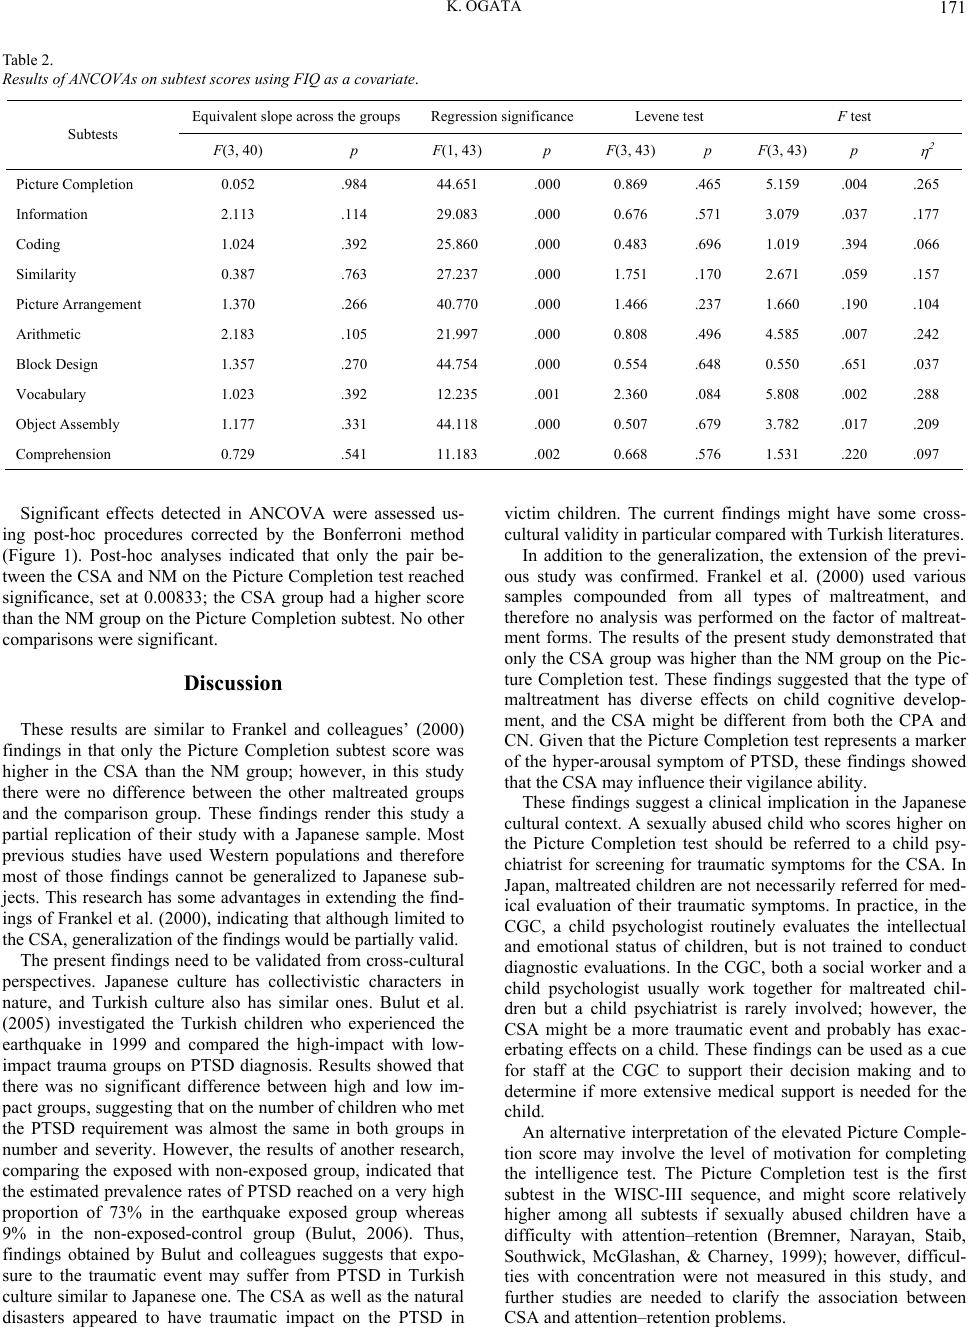
ANCOVA was performed on 10 subtests among groups. In
the analyses, FIQ was related to the differences in subtest
scores and therefore used as a covariate; age did not reach sig-
nificance and therefore was not used as a covariate. The inde-
pendent variable was group status (CSA, CPA, CN, NM) and
the dependent variables were the 10 subtest scores. Due to the
number of comparisons, the Bonferroni correction was em-
ployed, and alpha was set at .005 for each F test. Before the F
tests of the main outcomes, three pretests were conducted to
confirm the validity of applying ANCOVA to the data in this
study (Table 2). Firstly, equivalent slopes of regressions, which
reflected the relationship between the FIQ and each subtest
score across groups, were confirmed. On all subtests, the dif-
ferences of the slopes did not reach significance and therefore
all regressions seemed to be parallel across groups. Secondly, it
was underpinned that the regression coefficients from the FIQ
to each subtest score were significant. Thirdly, the Levene tests
verified the equality of variance in the groups. Finally, F tests
were conducted on the basis of the results in the three pretests.
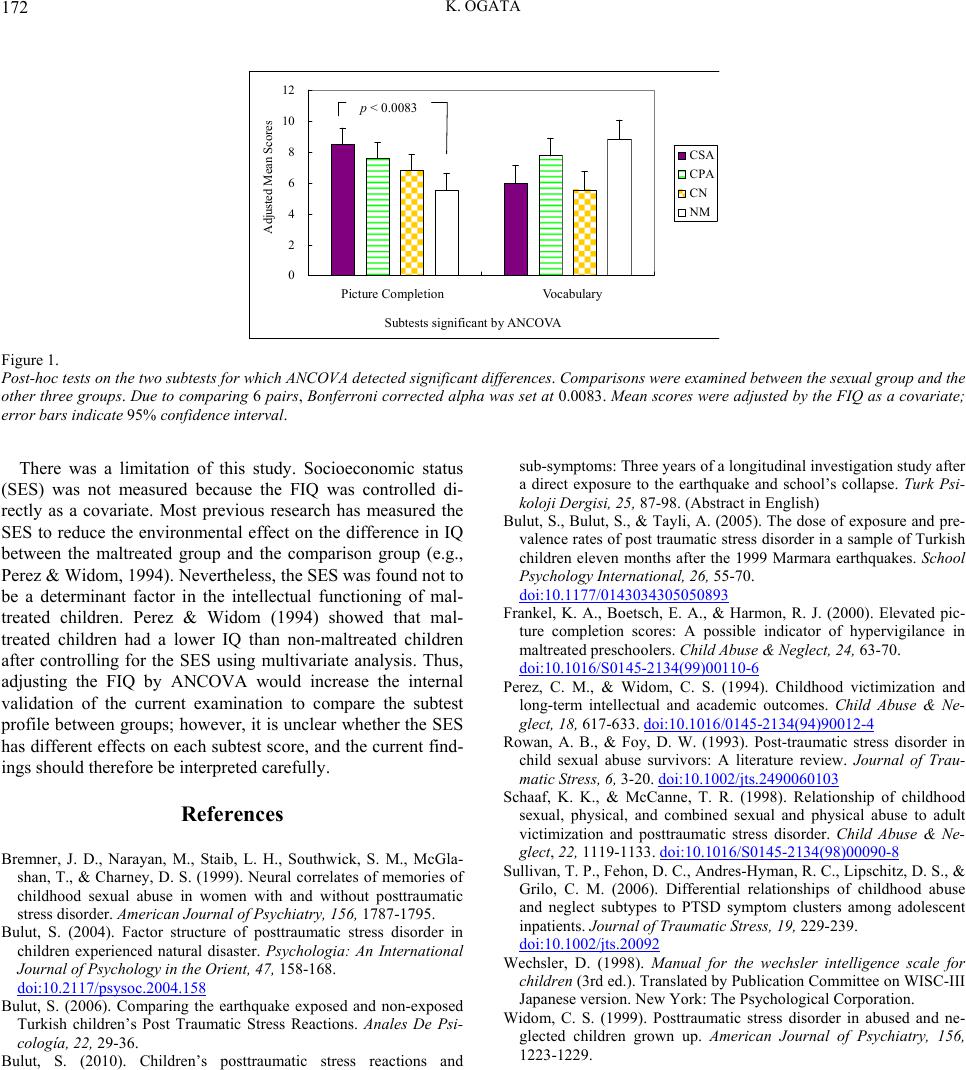
In ANCOVA, significant differences were detected on the Pic-
ture Completion and the Vocabulary subtests (Table 2).
Table 1.
WISC-III subtest scores, F IQ , and age among groups.
CSA CPA CN NM ANOVA
Subtests M SD M SD M SD M SD F(3, 44)p
Picture Completion 8 3 7 2 6 3 7 2 0.910 .444
Information 5 2 7 3 4 2 8 2 5.900 .002
Coding 7 4 9 4 8 3 10 2 1.733 .174
Similarity 6 3 7 3 6 3 10 2 7.615 .000
Picture Arrangement 6 3 6 2 7 2 9 3 4.228 .010
Arithmetic 5 3 8 3 4 3 9 1 7.259 .000
Block Design 8 4 7 4 7 3 10 3 1.427 .248
Vocabulary 6 2 8 2 5 2 10 3 10.627 .000
Object Assembly 8 3 6 3 7 4 8 3 0.805 .498
Comprehension 8 3 8 2 7 3 10 2 4.495 .008
FIQ 76 17 79 14 76 13 93 8 4.352 .009