 World Journal of Nano Science and Engineering, 2011, 1, 21-26 doi:10.4236/wjnse.2011.1 2004 Published Online June 2011 (http://www.SciRP.org/journal/wjnse) Copyright © 2011 SciRes. WJNSE Modelling of Internal Stresses in Sheet Glass during the Cooling Saci Benbahouche1, Fouad Roumili1, Jean-Christophe Sangleboeuf2 1Laboratory of Applied Precision Mechanics, Optics and Precision Mechanical Institute, Ferhat Abbas University, Setif, Algeria 2Laboratoire de Mécanique appliqué de l’Université de Rennes, Campus de Beaulieu, Rennes cedex, France E-mail: benbahouche_s@yahoo.fr Received February 23, 2011; revised March 14, 2011; accepted April 7, 2011 Abstract Internal stresses in glass are generated by interactions between thermal contraction, elasticity at low tem- peratures, viscoelastic flow at higher temperature, and temperature gradients caused by cooling. This work intends to work out calculation program for real temperature distribution and internals stress, and to study their behaviour during the quenching through a flat plate of soda-lime glass from different temperatures. Keywords: Modelling, Internal Stresses, Glass 1. Introduction The internal stresses in the glass are tensions which can be transient during the thermal treatment or the perma- nent tensions after the treatment and that are important of the practical view point. In thi s sense, t he t heo r y wa s n o t d e vel op e d a lo ng t i me, the first theoretical work in this sense has been done by Adams and Williamson [1], carrying on the analytic cal- culation of the distribution of the temperature during the cooling of the glass. After several years, models of visco-elastics pro perties o f the glass b egan to appear, but the functional method of calculation takes in considera- tion the thermoplastic stress formation and at the same time their relaxation by the viscous out-flow that could be made since the apparition of the computer. The first work t hat c arr ies o n t he nu me ric t ransi ent and per mane nt internal stress calculation in the glass been published by Lee, Roger and Woo [2]; at the following of several works of research done, and on the basis of these works we present this ar tic le . 2. Fundamental Equations 2.1. General Considerations In all the following theory, which is developed for a flat plate in glass, it is supposed that the lateral dimensions are superior to the thickness of where the normal con- straints in full surface tend everywhere toward zero; by these conditions, the thermal stresses become stresses hover and u niforms in t he plan y-z, but only with x [2-6]. yz xt σσσ = = (2.1.1) 0 x σ = (2.1.2) where, x, y, z are the principal axes; t is the parameter time . 2.2. Equation of the Deformation The Equation (2.2.1) generally describes all deformation of an infinite plate of which the initial temperature T0 at the instant t = 0 change to the temperature T(x, t) and at the fictive temperature Tf (x, t); this defor mation is called free deformation and which given by the following rela- tion [2-4,7]: ( )( ) ( ) ( ) 00 ,, , thgl g f xtTxt TTxt T ε ααα = −+−− (2.2.1) where, α g, α l: are respectively coefficients of thermal expansion in the glass state and coefficients of thermal expansion in the liquid state in thermodynamic equilib- rium; T(x, t): Temperature in the x point and at the in- stant really determined t; Tf (x, t): fictive temperature in the x point and at the instant t; T(x, 0) = T0: the initial  S. BENBAHOUCHE ET AL. Copyright © 2011 SciRes. WJNSE temperature at the instant t = 0. We suppos es at the inst ant t = 0 a stabilised state, then: Tf (x, 0) = T0. From the conditions cited before, the plate doesn’t change in the plan y-z, but independently of x, the ge- ometry of the glass plate and the continuity of material the lengthy of the plate determines the real deformation which only depends of the time [2,3,6,7]: (2.2.2) 2.3. Stress Equations In the interval of transition, two simultaneous effects produce, the first is the generation of stresses which is caused by the interaction between the thermal contrac- tion (elasticity) for the low temperatures and the visco- elasticity that increase for the elevated temperatures, then the second effect that is the relaxation of these stresses. The stress is generated by the difference between the free deformation and the real deformation [2-4,7]: ( )( )() ,, 1 g th E xtt xt σ εε µ = − − (2.3.1) where, σ g(x, t): Stress generated in the x point and at the instant t; E: YOUNG modulus: μ POISSON Coeffi- cient. But for the glass in the state material visco-elastic, the equation of stress is expressed such as being the sum of stress generated variations with regard to the time t while considering the relaxation of these stresses that also de- pends of cooling time, and this equation is called visco- elastic equation whic h is gi ven by [2-5,7] : ( )()( ) 0 , ,d tg xt xtRttt t σ σ ′ ∂ ′′ = −′ ∂ ∫ (2.3.2) where, R: Stress relaxatio n modulus. With the relation of equilibrium which is defined as being the sum of the internal stresses the lengthy of the half of the plate thickness (at the rate of symmetry) must be equal to z e ro; this relation is calle d basis equatio n: (2.3.3) 2.4. Fictive Temperature Tool [8] defines the fictive temperature Tf as being a present temperature of an equilibrium state which corre- sponds to give the state no eq uilibriu m, else sa id , it is the proper temperature to the structure, it takes its residual value just as the relaxation eliminates itself. It is a func- tion of the position x and the time t, which is given by the followin g eq uation [7,9,10]: ( )( )( )( ) 0 ,,, ,d t f T TxtT xtMxtxtt t ξξ ∂ ′′ =−− ′ ∂ ∫ (2.4.1) where M: structure relaxation Modulus; ξ: Reduced time. The reduced time ξ is defines by Lee and Roger [11] as being the measured time at the low temperatures. With the superposition of the time and the temperature of which call simplicity thermo-rheological while using the shift function Φ, from which comes the notion of the reduced time. The reduced time is in relation with the real time and the s hift functio n Φ under the following form [3,9,12]: ( )()() 0 ,,,, d t f xtTxtTxtt ξ ′′ =Φ ∫ (2.4.2) However, ξ is obtained from the real time t, which carries the shift functio n Φ to depend of Tf and as well o f T, which is formulated by the following relation [7,12]: ( ) 112 ,2 fg fd H T TExpRTT T ξ = −+− (2.4.3) where H: Activation energy; Rg: Gas Constant; Td: Minimum annealing temperature. From Rekhson and Mazurins [1 3] results, the s truc tur e relaxation Modulus can be presented by the following expression: ( ) 0,68 v MExp t ξ ξ = − (2.4.4) where tv: Time of volume relaxation. 2.5. Stress Relaxation Modulus Stress relaxation modulus R is calculated on the basis of E and G respectively elasticity modulus and sliding modulus which also depend of a time, and which given by the following equation of int egral [2,7,11,14-16]: ()( )( ) 0 42 3 R GdR G k ξ ξξξ ξξ ξ ′ ∂ ′ ′′ − += ′ ∂ ∫ (2.5.1) where k: volume module which is in relation with a YOUNG modulus E, the sliding modulus G and a POISSON coefficient µ : (2.5.2)  S. BENBAHOUCHE ET AL. Copyright © 2011 SciRes. WJNSE 2.6. The Temperature Distribution The purpose to determine the temperature distribution is to know the variation of the temperature gradient which has for consequence a variation of internal stress in a plate of glass during the cooling; this distribution is de- termined by the equation of heat transfer of which the general form [17]: (2.6.1) where C: Specific heat; ρ : Density; λ : Thermal conduc- tivity. But for the calculation of temperature at the surface of the plate, we have a heat transfer between the surround- ing and t he surface o f the gl as s p l ate , whic h exp re ssed b y the followin g equation [7,18]: (2.6.2) where Ts: Superficial temperature of a sheet glass; TE: Surrounding temperature; α : Coefficient of heat transfer. 3. Results and Discussions To calculate the temperature distribution and the internal stresses in a flat plate in soda -lime gla ss wit h a thic kness of 1 cm from a temperature of 650˚C, we used the fol- lowing co nstant: • The s urrounding temperature TE = 20˚C. • The step of the time for the calculation of fictive temperature Δt = 1 s. • The step of the time for the calculation of real tem- perature Pt = 0.25 s. • The s tep o f t he thic kness h = 1 mm. • The coefficient of heat transfer α = 198 W·m–2·K–1. • The dilation coefficient of the liquid state αl = 27 × 10–6 K–1 • The dilation coefficient of the glass state αg = 9 × 10⁻⁶ K–1 • The elasticity modulus E = 72000 MPa. • The POISSON coefficient μ = 0.22. • The mi nimum annealing temperature Td = 477˚C. • The precision of calculation of the fictive temperature εf = 0.01˚C. Figure 1 shows us, in the beginning of the cooling, real temperature T and fictive temperature Tf nearly had the s ame val ues d uri ng the f irst t hre e sec ond s o f co olin g, next the difference appears and begin to increase until the total cooling. Since the first second, the real temperature gradient between the one of the surface and the one of the center appears, after it increases until it marks its maximum between the insta nt t = 20 s (0.3 min) and t = 60 s (1 min) of the cooling; from this moment, it begins to decrease until it beco mes nil, thus the two temperat ures of surface and center takes the same value (total cooling). But for the fic tive temp erature, it begin s to decrea se un- til the instant t = 40 s (0.7 min) and then it stabilises; at this instant the relaxation of the structure terminates itself. Results obtained for the internal stress are regrouped in a Figure 2 under profiles form. To draw internal stress profiles, one has need of the specific difference of light march polarised X which is the consequence of the photo-elastic measures of stresses. The stress σ and the march difference X are linked by the photo-elastic constant (called BREWSTER constant) B by the following rela tion: (3.1) In the beginning of cooling for the first five seconds, internal stress profiles are given by the Figure 2(a), but those of 6 seconds until 20 seconds are not presented because they keep the same pace as the one of 5 seconds but sizes differ. One remarks that for the first 3 seconds, the surface is under the influence of the traction stress, whereas nor- mally the superficial layer must compress itself if it was free; this contraction is caused by the continuity of mat- ter because the superficial layer will have tendency to compress but the other inner layers don’t let it and which are under the influence of the compres sio n str ess. Since the fourth second, the surface will become under the influence of the compression and the traction stress transfers to the second layer of the surface (to Figure 2(a)), it is caused by the continuity of matter, this trans- fer continuous from a layer to an another one until the central layer (to See Figure 2). After 20 seconds of cooling, the surface will be under Figure 1. Temperature (T) and fictive temperature (Tf) variations during 8 minutes of cooling through a flat plate in soda-lime glass.  S. BENBAHOUCHE ET AL. Copyright © 2011 SciRes. WJNSE the influence of the compression stress, but the center under the traction stress of which sizes increase progres- sively until the moment where they take their residual values (total cooling) (to see Figures 2(b), (c)). From the 30 seconds, profiles of stresses have the same form but sizes which differ. For the internal stress variation (to see Figure 3); in the beginning of cooling the stress begins to increase until the i nstant t = 20 s wher e it stabilises lightly during 10 seconds whose value is –18.08 Mpa for the surface, and of 4.99 Mpa for the center whose marches differ- ences are respectively –452 nm/cm and 125 nm/ cm . Next, compression at the surface increases until the value –80 Mpa (X = –2000 nm/cm); but traction at the center increases until 32.9 Mpa (X = 882.5 nm/cm), where the two stresses stabilise. After the total cooling, the profile of the stress has a parabolic form having a bigger slope than 2 what corre- sponds to the generally known experimental fact (exam- ple [19]); the ratio of the absolute values of the stress in the center and at the surface is more or less equal to 2. The quantitative numeric value comparison can be done better with the permanent internal stress for which we have eno u g h ap p li ed val ues . I n the Figure 4; we ha ve the comparison of calculated values of march difference and those measured by photo-elasticimetry by transmis- sion, for a flat plate in soda-lime glass of 0.61 cm thick- ness from a initial temperature T0 = 738˚C. One sees that the calculated values are smaller than the experimental values (at the surface 37.36% and in the center of the sample 41.21%), the principal causes of this difference is the calculation of the real temperature be- cause the equation of heat transfer doesn’t take in con- sideration the radiation component; then If we compare the evolution of the calculated temperature with values found by Narayanaswamy [4] who used another equation of which the radiation component taken in consideration (to See Table 1). We notice that the calculated ∆T are smaller than those of Narayanaswamy [4]; because values of the permanent (a) (b) (c) Figure 2. Stres s distri butio ns th rough a f lat plat e in sod a-lime glass during cooling ; (a) Duri ng 5 sec onds of cooli ng; (b) Dur- ing 1.4 minute of cooli ng; (c) Duri ng 8 minutes of cooling. 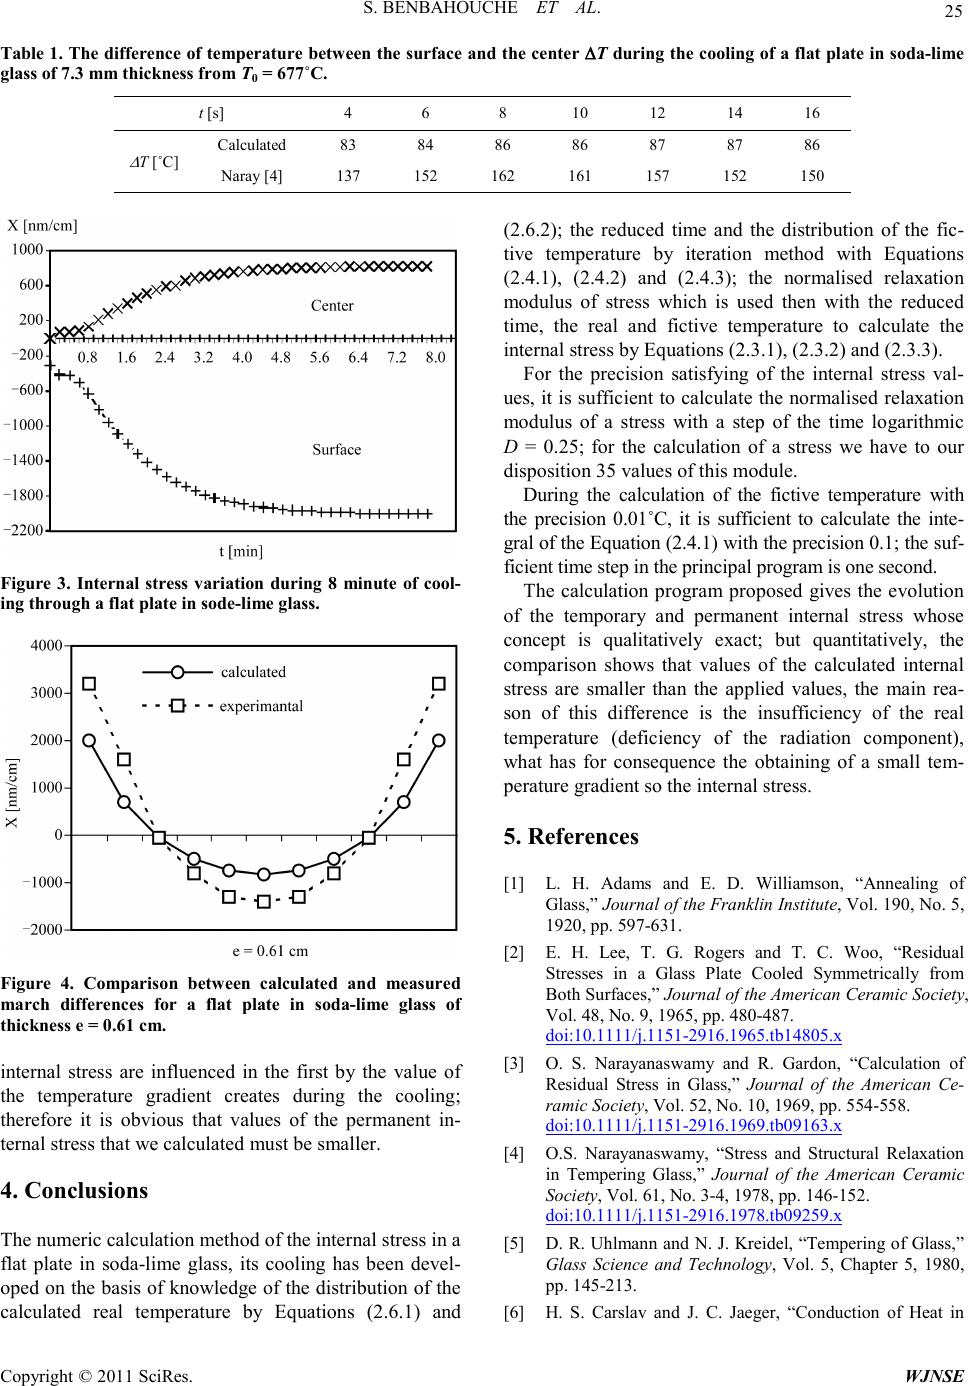 S. BENBAHOUCHE ET AL. Copyright © 2011 SciRes. WJNSE Table 1. The difference of temperature between the surface a nd the center ∆T during the c ooling of a flat plate in s oda-lime glas s of 7.3 mm thickness from T0 = 67 7˚C. t [s] 4 6 8 10 12 14 16 ∆ T [˚C] Cal culat ed 83 84 86 86 87 87 86 Naray [4] 137 152 162 161 157 152 150 Figure 3. Internal stress variation during 8 minute of cool- ing through a fl a t plate in sode-lime glass. Figure 4. Comparison between calculated and measured march differences for a flat plate in soda-lime glass of thickness e = 0.61 cm. internal stress are influenced in the first by the value of the temperature gradient creates during the cooling; therefore it is obvious that values of the permanent in- ternal stress tha t we calculated must be smaller. 4. Conclusions The numeric calculation method of the internal stress in a flat plate in soda-lime glass, its cooling has been devel- oped on the basis of knowledge of the distribution of the calculated real temperature by Equations (2.6.1) and (2.6.2); the reduced time and the distribution of the fic- tive temperature by iteration method with Equations (2.4.1), (2.4.2) and (2.4.3); the normalised relaxation modulus of stress which is used then with the reduced time, the real and fictive temperature to calculate the internal stress by Equations (2.3.1), (2.3.2) and (2.3.3). For the precision satisfying of the internal stress val- ues, it is sufficient to calculate the normalised relaxation modulus of a stress with a step of the time logarithmic D = 0.25; for the calculation of a stress we have to our disposition 35 values of this module. During the calculation of the fictive temperature with the precision 0.01˚C, it is sufficient to calculate the inte- gral of the Equation (2.4.1) with the precision 0.1; the suf- ficient time ste p in the prin cipal prog ram is one s e cond . The calculation program proposed gives the evolution of the temporary and permanent internal stress whose concept is qualitatively exact; but quantitatively, the comparison shows that values of the calculated internal stress are smaller than the applied values, the main rea- son of this difference is the insufficiency of the real temperature (deficiency of the radiation component), what has for consequence the obtaining of a small tem- perature gradient so the internal stress. 5. Referen ces [1] L. H. Adams and E. D. Williamson, “Annealing of Glass,” Journal of the Franklin Institute, Vol. 190, No. 5, 1920, pp. 597-631. [2] E. H. Lee, T. G. Rogers and T. C. Woo, “Residual Stresses in a Glass Plate Cooled Symmetrically from Both Surfaces,” Journal of the American Ceramic Society, Vol. 48, No. 9, 1965, pp. 480-487. doi:10.1111/j.1151-2916.1965.tb14805.x [3] O. S. Narayanaswamy and R. Gardon, “Calculation of Residual Stress in Glass,” Journal of the American Ce- ramic Society, Vol. 52, No. 10, 1969, pp. 554-558. doi:10.1111/j.1151-2916.1969.tb09163.x [4] O.S. Narayanaswamy, “Stress and Structural Relaxation in Tempering Glass,” Journal of the American Ceramic Soci ety, Vol. 61, No. 3-4, 1978, pp. 146-152. doi:10.1111/j.1151-2916.1978.tb09259.x [5] D. R. Uhlmann and N. J. Kreidel, “Te mpering o f Glass,” Glass Science and Technology, Vol. 5, Chapter 5, 1980, pp. 145-213. [6] H. S. Carslav and J. C. Jaeger, “Conduction of Heat in  S. BENBAHOUCHE ET AL. Copyright © 2011 SciRes. WJNSE Solids,” Ox ford University Press, Oxford, 1947, pp. 154- 165. [7] J. Kavka, “Calcul de la Déformation et de Contrainte Interne Durant la Première Phase de Refroidissement,” Thèse de Doctorat, Institut d’Etat de Recherche verrière, Hradec Kralove, République Tchèque, 1980. [8] A. Q. Tool, “Relation between Inelastic Deformability and Thermal Expansion of Glass in Ets Annealing Range,” Journal of the American Ceramic Society, Vol. 29, No. 9, 1946 , p p. 24 0-253. doi:10.1111/j.1151-2916.1946.tb11592.x [9] R. Gardon and O. S. Narayanaswamy, “Stress and Vol- ume Relaxation in the Annealing of Flat Glass,” Journal of the American Ceramic Society, Vol. 53, No. 7, 1970, pp. 380-385. doi:10.1111/j.1151-2916.1970.tb12137.x [10] S. M. Ohlberg and T. C. Woo, “Thermal Stress Analysis of Glass with Dependent Coefficient of Expansion,” P.P.G. Industries Inc., University Pittsburg, P e nn syl van y, 1972. [11] E. H. Lee and T. G. Rogers, “Non-Linear Effects of Temperature Variation in Stress Analysis o Isothermally Liear Visco-Elastic Materials,” Proceedings of IUTAM Symposium on Second-Order, Pergamon Press, Haifa, 1964. [12] O. S. Narayanaswamy, “A Model of Structural Relaxa- tion in Glass,” Journal of the American Ceramic Society, Vol. 54, No. 10, 1971, pp. 491-498. doi:10.1111/j.1151-2916.1971.tb12186.x [13] S. M. R ekhson an d O. V. Mazu rin, “Stress an d Structural Relaxation in Na2O-CaO-SiO2 Glass,” Journal of the American Ceramic Society, Vol. 57, No. 7, 1974, pp. 327-328. doi:10.1111/j.1151-2916.1974.tb10912.x [14] E. H. Lee and T. G. Rogers, “Solution of Visco-Elastic Stress Analysis Problems Using Measured Creep or Re- laxation Function,” Journal of Applied Mechanics, Vol. 30, No. 3, 1963, p p. 127-133. [15] R. Muki and E. Sternberg, “Transient Thermal Stress in Visco-Elastic Materrials with Temperature Dependent Properties,” Journal of Applied Mechanics, Vol. 28, No. 2, 1961, pp. 193- 207. [16] G. W. Sch erer and S. M. Rekhson, “Voisco elastic – Elas- tic Composites: I, General Theory,” Journal of the Ameri- can Ceramic Society, Vol. 65, No. 7, 1982 , pp. 35 2-360. doi:10.1111/j.1151-2916.1982.tb10470.x [17] N. Piskounov, “Calcul Différentiel et Intégral,“ Tome II, Editions MIR (traduit du Russe en Francçais), Moscou, Russie, 1976. [18] F. Beran ek, “Temperature distribution in Glass products,” Informativni Prehed, Vol. 19, No. 4, H. Kralove, Cesky Republic, 1976, pp. 17-29. [19] M. Goldstein and M. Nakonecznyj, “Volume Relaxation in Zinc Chloride Glass,” Physics and Chemistry of Glasses, Vol. 6, No. 4, 1965, pp . 126-133.
|