 iBusiness, 2011, 3, 159-168 doi:10.4236/ib.2011.32022 Published Online June 2011 (http://www.scirp.org/journal/ib) Copyright © 2011 SciRes. iB Organizational Performance and Retail Challenges: A Structural Equation Approach Rajwinder Singh1, Harminder Singh Sandhu2, Bhimaraya A. Metri3, Rajinder Kaur4 1School of Management Studies, Punjabi University Patiala,Patiala, India; 2Commerce and Business Management, Guru Nanak Dev University, Amritsar, India; 3Management Development Institute, Gurgaon, India; 4Rajinder Kaur, Malout Institute of Management and Information Technology, Malout, India. Email: {rajwindergheer, riya07rajinder}@gmail.com, sandhu_hs12@yahoo.com; metri@mdi.ac.in Receive February 5th, 2011; revised April 16th, 2011; accepted April 26th, 2011. ABSTRACT Organized retailing is a sunrise industry in India. Many big industrial houses and international players are in the arena. The perfect competition in the market posed man y challenges to retailers for better organ izational performa nce. In this study we attempt to iden tify items for retail challenges (RC) and organizational performance (OP) based on strong lit- erature support in con sultation of practitioners and consultants in th e field of organized non-livestock retailing (NLR). The retail challenges so selected were classified with factor analysis using principal component analysis with varimax rotation. Here, the retail challenges are classified into four categories as: strategic challenges, environmental chal- lenges, customer challenges, and supply chain (SC) challenges. The six identified items for organizational performance are: market performance, SC competencies, stakeholder satisfaction, innovation and learning, customer satisfaction, and financial performance. A confirmatory model was tested using structural equation modeling to prove hypotheses: strategic challenges, environmental challenges, and customer challenges influence SC challenges and all the challenges affect organizational performance. The data were collected from organized non-livestock retail players operating in north Indi a. All the results are validated using rigorous statistical analysis. Keywords: Organized Retailing, Organizational Perfor ma nce, Retail Challenges, Structural Eq uat ion Modeling, Factor Analysis 1. Introduction Retailing is the set of activities that markets products or services to the final consumers for their personal or household use. In India this industry is identified as ‘karyana’ stores. These karyana stores have been in use since ages. The organized non-livestock retailing (NLR) is the sale of agriculture and horticulture products to consumers. The concept of organized retailing gained momentum in 1980 when Mother’s Dairy introduced vegetables and milk at the retail outlets in New Delhi. Later on Verka, Amul, Markfed have followed the con- cept and created co-operative societies for seeds, pulses, milk and milk products [1]. The boom in organized retailing came after liberaliza- tion in 1991. According to CMIE report the retail growth doubled from 1990 to 1999. In India there are 15 million retailers, operating in the form of “mom pop” outlets spread over 31 million square meters area, generating sales of USD 11 billion in 2007-2008 [2]. The organized retailing which constitutes 6% of the retailing has come up with new formats of retailing like supermarkets, hypermarkets, malls, department stores, discount stores, specialty stores, convenience stores, kiosks and food court counters [3]. The organized retail accommodated many major play- ers after 1990. There were just three shopping malls in 1990 i.e. Spencer Plaza in Chennai, Ansal Plaza in New Delhi and Cross Roads in Mumbai [4]. The number of retail formats has risen to many thousands by the end of 2007. Now organized retailing has emerged as a sunrise industry in India. Many big industrial houses have diver- sified into this area. The major retail players in this in- dustry are: Reliance Retail, RPG Retail, The Tata Group, K Raheja Corporation, Piramyd Retail, Nilgiris’, Sub- hiksha Trading Limited, Trinethra, Vishal Group, and BPCL etc. These players have collaborated with the na- tional and international players like Wal-Mart, Tesco, and Metro etc. to harvest the profits. The intense competition in the market and changing customer preferences has made the retailers’ job difficult 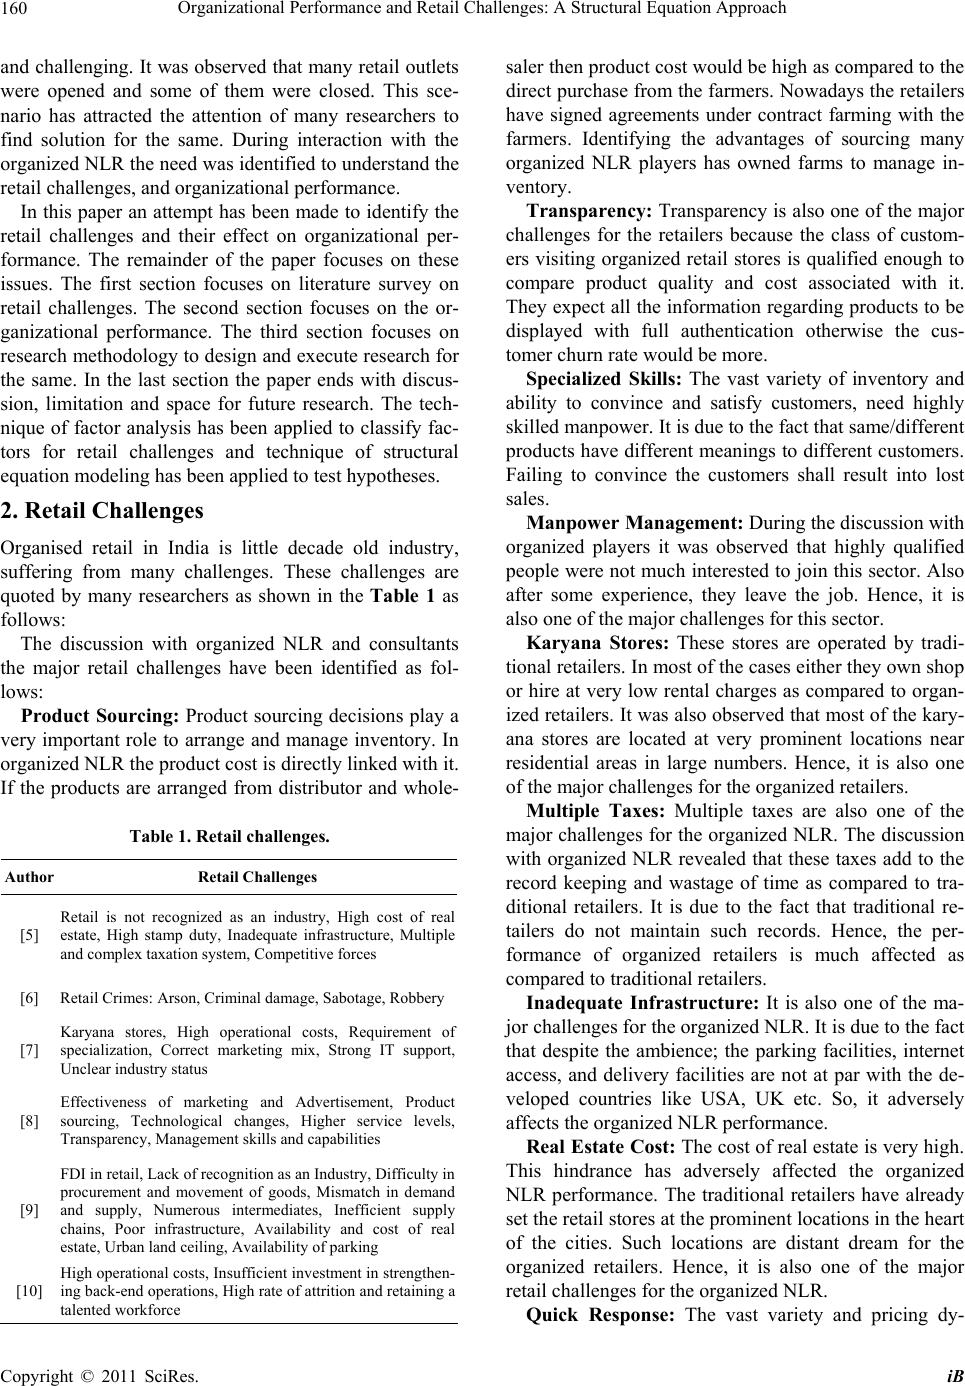 Organizational Performance and Retail Challenges: A Structural Equation Approach 160 and challenging. It was observed that many retail outlets were opened and some of them were closed. This sce- nario has attracted the attention of many researchers to find solution for the same. During interaction with the organized NLR the need was identified to understand the retail challenges, and organizational performance. In this paper an attempt has been made to identify the retail challenges and their effect on organizational per- formance. The remainder of the paper focuses on these issues. The first section focuses on literature survey on retail challenges. The second section focuses on the or- ganizational performance. The third section focuses on research methodology to design and execute research for the same. In the last section the paper ends with discus- sion, limitation and space for future research. The tech- nique of factor analysis has been applied to classify fac- tors for retail challenges and technique of structural equation modeling has been applied to test hypotheses. 2. Retail Challenges Organised retail in India is little decade old industry, suffering from many challenges. These challenges are quoted by many researchers as shown in the Table 1 as follows: The discussion with organized NLR and consultants the major retail challenges have been identified as fol- lows: Product Sourcing: Product sourcing decisions play a very important role to arrange and manage inventory. In organized NLR the product cost is directly linked with it. If the products are arranged from distributor and whole- Table 1. Retail challenges. Author Retail Challenges [5] Retail is not recognized as an industry, High cost of real estate, High stamp duty, Inadequate infrastructure, Multiple and complex taxation system, Competitive forces [6] Retail Crimes: Arson, Criminal damage, Sabotage, Robbery [7] Karyana stores, High operational costs, Requirement of specialization, Correct marketing mix, Strong IT support, Unclear industry status [8] Effectiveness of marketing and Advertisement, Product sourcing, Technological changes, Higher service levels, Transparency, Management skills and capabilities [9] FDI in retail, Lack of recognition as an Industry, Difficulty in procurement and movement of goods, Mismatch in demand and supply, Numerous intermediates, Inefficient supply chains, Poor infrastructure, Availability and cost of real estate, Urban land ceiling, Availability of parking [10] High operational costs, Insufficient investment in strengthen- ing back-end operations, High rate of attrition and retaining a talented workforce saler then product cost would be high as compared to the direct purchase from the farmers. Nowadays the retailers have signed agreements under contract farming with the farmers. Identifying the advantages of sourcing many organized NLR players has owned farms to manage in- ventory. Transparency: Transparency is also one of the major challenges for the retailers because the class of custom- ers visiting organized retail stores is qualified enough to compare product quality and cost associated with it. They expect all the information regarding products to be displayed with full authentication otherwise the cus- tomer churn rate would be more. Specialized Skills: The vast variety of inventory and ability to convince and satisfy customers, need highly skilled manpower. It is due to the fact that same/different products have different meanings to different customers. Failing to convince the customers shall result into lost sales. Manpower Management: During the discussion with organized players it was observed that highly qualified people were not much interested to join this sector. Also after some experience, they leave the job. Hence, it is also one of the major challenges for this sector. Karyana Stores: These stores are operated by tradi- tional retailers. In most of the cases either they own shop or hire at very low rental charges as compared to organ- ized retailers. It was also observed that most of the kary- ana stores are located at very prominent locations near residential areas in large numbers. Hence, it is also one of the major challenges for the organized retailers. Multiple Taxes: Multiple taxes are also one of the major challenges for the organized NLR. The discussion with organized NLR revealed that these taxes add to the record keeping and wastage of time as compared to tra- ditional retailers. It is due to the fact that traditional re- tailers do not maintain such records. Hence, the per- formance of organized retailers is much affected as compared to traditional retailers. Inadequate Infrastructure: It is also one of the ma- jor challenges for the organized NLR. It is due to the fact that despite the ambience; the parking facilities, internet access, and delivery facilities are not at par with the de- veloped countries like USA, UK etc. So, it adversely affects the organized NLR performance. Real Estate Cost: The cost of real estate is very high. This hindrance has adversely affected the organized NLR performance. The traditional retailers have already set the retail stores at the prominent locations in the heart of the cities. Such locations are distant dream for the organized retailers. Hence, it is also one of the major retail challenges for the organized NLR. Quick Response: The vast variety and pricing dy- C opyright © 2011 SciRes. iB  Organizational Performance and Retail Challenges: A Structural Equation Approach 161 namics of the market has made the organized retailing a challenging job. The traditional retailers nowadays also offer more variety at competitive prices. Also, the farm- ers directly sell their produce in the market at the com- petitive prices in large volume. This helps customers to select the best product from large quantities. They also reduce the cost to very low levels in the evenings, which is not possible in case of organized retailers because, they either purchase from the farmers or wholesalers. Hence, it is difficult for organized retailers to quick re- spond to the market dynamics. Hence, it is also one of the major challenges for the organized NLR to cope with market dynamics. Customer Loyalty: The customer segments visiting the organized stores are qualified from middle and high income groups. They have different meaning to same or different products. Hence, customer loyalty is a chal- lenging job. The organization shall easily duplicate the marketing policies but, customer loyalty shall not be duplicated. Hence, it is also one of the major challenges for the organized NLR. High Connectivity: It is required to understand the customers’ expectations and means to meet them. The dynamic nature of NLR business needs high connectivity between customers, markets, and organizations. The fai- lure of which shall lost sale and goodwill. Hence, it is also one of the major challenges affecting organized NLR performance. Operational Cost: The operational cost of organized stores is very high as compared to the traditional retailers. It is due to the fact that most of the traditional retailers own their shops and manage the operations by their own. Here, the rental charges, manpower cost, and tax burden are very less as compared to organized stores. So, it is also one of the major challenges for the organized retail- ers. SC Performance: The competition in the market has shifted to SC vs. SC. The organizations collaborate with national and international players to maximized SC per- formance. This intense competition has made the job of marginal organized retailers challenging. The big indus- trial houses also own farm houses and distribution chan- nels making the job of other competitors difficult. Hence, it is also one of the major challenges for this sector. Forecasting: Demand forecasting is also one of the major challenges for this industry. The price fluctuations, seasonal fluctuations, and changing customer preference has made this job challenging. Hence, it is also one of the major challenges for the organized NLR. 3. Organizational Performance Organizational performance refers to how well an or- ganization achieves its market oriented goals as well as its financial goals [11]. Organizations adopt suitable str- ategies and policies for better organizational perform- ance (OP). The ultimate objective of all the innovative techniques is to enhance OP. In this study the identified constructs for OP in consultation of practitioners and consultants in the field of NLR are: market performance, supply chain competencies, stakeholder satisfaction, in- novation and learning, customer satisfaction, and finan- cial performance. These are explained as follows: Market Performance: Market performance is one of the most important factors for OP. The organizations with good market share shall adopt competitive strate- gies to compete the competitors. Also, the market per- formance as measured by customer satisfaction is good for OP [12]. Hence, it is one of the major components for OP. Supply Chain Competencies: Today’s intense mar- ket competition has shifted to SC vs. SC. An efficient SC shall save more resources and ultimately OP would be better. An attempt to optimize OP, without consider- ing SC may negatively impact OP [13]. Also, the logis- tics performance reflects the OP as it delivers the prod- ucts in quantity at the time as per customers’ require- ments [14]. Hence, it is also one of the major OP com- ponents. Customer Satisfaction: It is one of the most impor- tant construct as satisfied customers may be loyal to the organization and revisit for purchase shall be assured. So, it is also identified it as an important construct for better OP [15]. Stakeholders’ Satisfaction: Stakeholders are the main elements to develop the financial base of the organiza- tion. If they are satisfied then they shall remain members otherwise they shall depart. It is the focal point of the OP measurement process [1]. Hence, it is also one of the major components for OP. Innovation and Learning: It is also an important construct for better OP. It was seen that many organiza- tions are out of the business due to their failure to learn and innovate. So, it as an important construct for OP [15]. Financial Performance: The ultimate objective of all the organizations is better financial performance. It helps to adopt competitive strategies to leave behind the com- petitors. Hence, it is also one of the important compo- nents for better OP [16,17]. 4. Database and Methodology This research is based on primary data. The primary data was collected from the organized NLR organisations with the help of a questionnaire. The questionnaire was developed based on strong literature support in consul- tation of practitioners and consultants in the field of or- C opyright © 2011 SciRes. iB  Organizational Performance and Retail Challenges: A Structural Equation Approach Copyright © 2011 SciRes. iB 162 ganized NLR. The respondents were selected based on: India Retail Report 2007 & 2009, Retail Telephone Di- rectory, PROWESS, and Organization websites etc. The unit of analysis was the organized NLR organizations operating in the principal cities of Punjab, Chandigarh, and Gurgaon. The reason for selecting this north India belt was due to, good in agriculture production and es- tablishment of organized retailers in large numbers. The pre-pilot and pilot survey was done to improve the ques- tionnaire. Later on, large scale survey was done at the top, middle and lower level of organized NLR organiza- tions by randomly selecting respondents based on tele- phone addresses. The questionnaires were mailed after telephonic discussion and later on, were followed for response. A total of 560 questionnaires were sent with receipt of 402 responses (Top = 100, middle = 134, lower = 168) yielding a response rate of 72%. The tech- nique of factor analysis using principal component analysis with varimax rotation was applied to classify the factors for retail challenges. The technique of con- firmatory factor analysis was applied to test the relation- ship between retail challenges and organizational per- formance. This research intends to prove the research framework (Figure 1) by developing and testing hy- potheses as follows: H1: Strategic challenges, environmental challenges, and customer challenges influence supply chain chal- lenges: It was evident from the literature survey and dis- cussion with organized players that the market competi- tion has shifted SC vs. SC. Hence, it was assumed that strategic challenges, environmental challenges and cus- tomer challenges shall influence SC performance. H2: All the challenge factors affect organizational performance: The organized NLR organizations design their strategies to cope with these challenges. Hence, it was assumed that all the challenge factors shall be af- fecting OP. 4.1. Scale Development The six items for OP and seventeen-items for RC were selected based on strong literature support in consulta- tion of practitioners and consultants in the field of orga- nized NLR. Pre-pilot and pilot survey was done to im- prove the questionnaire. Based on survey comments one item i.e. arson was not found valid for retail challenges in India. Hence, it was deleted yielding the effective RC items to 16. These items were rated on five-point Likert scale on two time horizons to measure the variability in the recorded responses. Later on improved questionnaire was subjected to large scale survey. 4.2. Scale Refinement The questionnaire so developed was tested through pre- pilot and pilot survey. Later on large survey was done. The improved questionnaire responses were subjected to rigorous statistical analysis as follows: Item and scale reliability analysis was performed to re- tain and delete the scale items for the purpose of deve- loping a reliability scale. Here, scale reliability (Cron- bach’s Alpha), communality, item-to-total and inter-item correlation was applied. The items with low correlation were subject to deletion. The corrected-to-total corre- lation range from 0.5 to 0.7432, communality range from 0.659 to 0.987, and Cronbach’s Alpha = 0.9002. Here, it is pertinent to mention that communality ≥ 0.5, Cron- bach’s alpha ≥ 0.7, item-to-total correlation ≥ 0.5 and inter-item correlation ≥ 0.3 is good enough for conducting research in social sciences [18]. In this phase all the re- quirements were met for conducting factor analysis as shown in Tables 2 and 3. Figure 1. Proposed research framework.  Organizational Performance and Retail Challenges: A Structural Equation Approach 163 Table 2. Mean, standard, deviation, corrected item-to-total correlation, scale reliability and communality for retail challenges. Communality Code Items Mean SD Corrected Item—Total Correlation Alpha if Item Deleted Initial Extracted C1 Real Estate Cost 3.3607 1.1676 0.7432 0.8873 1.0 0.987 C2 Multiple Taxes 3.4403 1.0976 0.6077 0.8934 1.0 0.977 C3 Inadequate Infrastructure 3.3632 1.1550 0.7117 0.8888 1.0 0.970 C4 Karyana Stores 3.4502 1.0935 0.5657 0.8953 1.0 0.981 C5 Specialized Skills 3.8209 0.9876 0.6126 0.8927 1.0 0.970 C6 Transparency 3.8209 0.9774 0.6130 0.8927 1.0 0.967 C7 Manpower Management 3.8159 0.9739 0.5946 0.8934 1.0 0.948 C8 Product Sourcing 3.8383 0.9638 0.5857 0.8938 1.0 0.970 C10 High Connectivity 4.4303 0.5793 0.5559 0.8957 1.0 0.858 C11 Quick Response 4.4353 0.5624 0.5355 0.8963 1.0 0.854 C12 Service levels 4.4403 0.5540 0.5040 0.8971 1.0 0.833 C14 Operational Cost 4.8159 0.6245 0.5950 0.8944 1.0 0.859 C15 Forecasting 4.8930 0.4069 0.5301 0.8978 1.0 0.659 C16 SC Performance 4.8881 0.4236 0.5000 0.8987 1.0 0.697 C9 Customer Loyalty 4.4254 0.6039 0.5566 0.8955 1.0 0.847 C13 Operations Management 4.7289 0.8841 0.5931 0.8934 1.0 0.867 N of Cases = 402.0, N of Items = 16, Alpha = 0.9002; Statistics for Scale: Mean = 65.9677; Variance = 75.2832; Std Dev = 8.6766. Table 3. Correlation for retail challenges. C1 C2 C3 C4 C5 C6 C7 C8 C9 C10C11C12C13 C14 C15C16 C1 1.0 C2 0.956 1.0 C3 0.970 0.942 1.0 C4 0.941 0.971 0.942 1.0 C5 0.203 0.082 0.180 0.038 1.0 C6 0.205 0.088 0.190 0.052 0.964 1.0 C7 0.208 0.071 0.175 0.036 0.946 0.9351.0 C8 0.183 0.082 0.185 0.050 0.960 0.9590.9411.0 C9 0.450 0.413 0.454 0.363 0.199 0.1930.1630.1311.0 C10 0.482 0.450 0.440 0.426 0.157 0.158 0.128 0.1120.8161.0 C11 0.455 0.428 0.428 0.406 0.190 0.165 0.133 0.1350.790 0.8011.0 C12 0.413 0.390 0.400 0.384 0.144 0.206 0.132 0.1520.751 0.7760.7921.0 C13 0.356 0.134 0.314 0.096 0.533 0.515 0.562 0.4900.310 0.2870.2580.224 1.0 C14 0.358 0.140 0.314 0.100 0.521 0.5010.502 0.481 0.3010.2750.243 0.206 0.885 1.0 C15 0.291 0.128 0.247 0.086 0.461 0.4410.441 0.407 0.4290.2800.248 0.209 0.675 0.668 1.0 C16 0.253 0.085 0.211 0.044 0.417 0.3970.397 0.365 0.2260.3590.163 0.126 0.684 0.676 0.5231.0 4.3. Factor Analysis for Retail Challenges The maximum scale score would be 80 if all the 16 items were rated as 5. However, the mean score (Table 2) of 65.9677 indicates that 82.46% of the items indicated in the questionnaire support their applicability in organized NLR. The factor analysis was done with principal com- ponent analysis using varimax rotation. The value for Kaiser-Meyer-Olkin (KMO) Measure of Sampling Ade- quacy was 0.774, Cronbach’s Alpha for factors range from 0.8706 to 0.9877, the factor loadings range from 0.745 to 0.958, the vales for Bartlett’s Test of Sphericity were: Chi-square = 10528.597, degree of freedom = 120, and level of significance (p) = 0.000. Here, it is pertinent to mention that KMO ≥ 0.7, Cronbach’s Alpha ≥ 0.7, p ≥ 0.05, and factor loading ≥ 0.5 is good for the validity of factor analysis results [18-20]. The results for factor analysis are shown in Table 4. C opyright © 2011 SciRes. iB  Organizational Performance and Retail Challenges: A Structural Equation Approach 164 Table 4. Factor analysis results for retail challenges. Components Items 1 2 3 4 Product Sourcing 0.958 Transparency 0.945 Specialized Skills 0.940 Manpower Management 0.930 Karyana Stores 0.966 Multiple Taxes 0.959 Inadequate Infrastructure 0.939 Real Estate Cost 0.934 Quick Response 0.888 Service levels 0.885 High Connectivity 0.869 Customer Loyalty 0.868 Operational Cost 0.867 Operations Management 0.862 SC Performance 0.809 Forecasting 0.745 Eigen Value 6.824 4.012 1.923 1.484 % Variance 42.650 25.072 10.017 9.276 Scale Reliability Cronbach’s Alpha 0.9872 0.9877 0.9365 0.8706 KMO = 0.774, Bartlett’s Test of Sphericity: Chi-square = 10528.597; df = 120; p = 0.000. 4.4. Explanation of Factor Analysis Results for Retail Challenges RC1 (Strategic Challenges): This was the most impor- tant category covering four items-product sourcing, transparency, specialized skills, and manpower man- agement. This category explains the percentage variance of 42.65% with Eigen value of 6.842. The factor load- ings range from 0.930 to 0.958 with Cronbach’s Alpha of 0.9872. The items covered are in consonance with the studies quoted in Table 1. RC2 (Environmenta l Chal lenges): This was the second important category covering four items-karyana stores, multiple taxes, inadequate infrastructure, and real estate cost. It explains 25.072% of variance with Eigen value of 4.012 and Cronbach’s Alpha of 0.9877. The factor loadings range from 0.934 to 0.966. The items covered here are also in consonance with the studies quoted in Table 1. RC3 (Customer Cha llenges): This was the third impor- tant category with 10.017% of variance, 1.923 Eigen value and Cronbach’s Alpha of 0.9365. The factor load- ings range from 0.868 to 0.888. The items covered-quick response, service levels, high connectivity, and customer loyalty are in consonance with studies quoted in Table 1. RC4 (Supply Chain Challenges): This was the last important category covering-operational cost, operations management, SC performance, and demand forecasting. These items with Eigen value of 1.484 explain 9.276% of variance with loading range from 0.745 to 0.867 and Cronbach’s Alpha of 0.8706. The items covered here are also in consonance with studies quoted in Table 1. 4.5. Confirmatory Factor Model for Retail Challenges and Organizational Performance The research framework is shown in Figure 1. Six items were selected for OP (market performance, SC compe- tencies, stakeholder satisfaction, innovation and learning, and financial performance) and sixteen items were se- lected for RC. These items were rated on five point Likert scale. The results in Table 5 indicate mean value of 4.3477 means, 86.954% of items covered show its applicability to organized NLR. The correlation matrix shown in the Table 6 shows Inter-item Correlations: Mean = 0.214; Minimum = –0.0496; Maximum = 0.971; Range = 1.0206; Max/Min = –19.5699; Variance = 0.0718. The proposed confirmatory structural model was tested using AMOS 4.0 version. The results for proposed confirmatory model are shown in Figure 2. 4.5.1 Confir matory Model Resul ts The confirmatory model loadings are shown in Figure 2. The loadings for the strategic challenge (RC1) range from 0.96 to 0.98. The loading for specialized skills was C opyright © 2011 SciRes. iB  Organizational Performance and Retail Challenges: A Structural Equation Approach 165 Table 5. Mean and standard deviation for retail challenges and organizational performance. Code Items Mean SD C1 Real Estate Cost 3.3607 1.1676 C2 Multiple Taxes 3.4403 1.0976 C3 Inadequate Infrastructure 3.3632 1.1550 C4 Karyana Stores 3.4502 1.0935 C5 Specialized Skills 3.8209 0.9876 C6 Transparency 3.8209 0.9774 C7 Manpower Management 3.8159 0.9739 C8 Product Sourcing 3.8383 0.9638 C9 Customer Loyalty 4.4254 0.6039 C10 High Connectivity 4.4303 0.5793 C11 Quick Response 4.4353 0.5624 C12 Service levels 4.4403 0.5540 C13 Operations Management 4.7289 0.8841 C14 Operational Cost 4.8159 0.6245 C15 Forecasting 4.8930 0.4069 C16 SC Performance 4.8881 0.4236 OP1 Market Performance 4.9453 0.4544 OP2 SC Competencies 4.9378 0.4775 OP3 Stakeholder Satisfaction 4.9428 0.4458 OP4 Innovation & Learning 4.9478 0.4234 OP5 Customer Satisfaction 4.9527 0.4121 OP6 Financial Performance 4.9552 0.4093 Grand Mean = 4.3477, N of Cases = 402.0, N of Items = 22, Alpha = 0.8747. Table 6. Correlation for retail challenges and organizational performance. C1 C2 C3 C4 C5C6 C7 C8 C9C10C11C12C13C14C15C16 OP1 OP2 OP3 OP4OP5OP6 C1 1.0 C2 0.956 1.0 C3 0.970 0.942 1.0 C4 0.941 0.971 0.942 1.0 C5 0.203 0.082 0.180 0.038 1.0 C6 0.205 0.088 0.190 0.052 0.9641.0 C7 0.208 0.071 0.175 0.036 0.9460.935 1.0 C8 0.183 0.082 0.185 0.050 0.9600.959 0.941 1.0 C9 0.450 0.413 0.454 0.363 0.199 0.193 0.163 0.131 1.0 C10 0.482 0.450 0.440 0.426 0.157 0.158 0.128 0.112 0.8161.0 C11 0.455 0.428 0.428 0.406 0.190 0.165 0.133 0.135 0.790 0.8011.0 C12 0.413 0.390 0.400 0.384 0.144 0.206 0.132 0.152 0.751 0.776 0.7921.0 C13 0.356 0.134 0.314 0.096 0.533 0.515 0.562 0.490 0.310 0.287 0.258 0.224 1.000 C14 0.358 0.140 0.314 0.100 0.521 0.501 0.502 0.481 0.301 0.275 0.243 0.206 0.8851.0 C15 0.291 0.128 0.247 0.086 0.461 0.441 0.441 0.407 0.429 0.280 0.248 0.209 0.675 0.6681.0 C16 0.253 0.085 0.211 0.044 0.417 0.397 0.397 0.365 0.226 0.359 0.163 0.126 0.684 0.676 0.5231.0 OP1 0.084 0.058 0.047 0.060 –0.033–0.033 0.056 –0.032–0.0240.128–0.024–0.023–0.037–0.036–0.0320.175 1.0 OP2 –0.027 0.038 –0.027 –0.018 0.0030.003 0.002 0.049 0.0230.0250.1380.028 –0.040–0.038–0.034–0.034 0.168 1.0 OP3 –0.037 –0.030 0.040 –0.029 –0.023 –0.024 –0.024 –0.0220.100–0.049 –0.0500.112–0.039 –0.038 –0.034 –0.034 0.132 0.241 1.0 OP4 0.114 0.109 0.115 0.132 –0.028–0.029 –0.029 –0.0270.029 0.153 0.0330.035 0.1490.039 0.0250.023 0.089 0.169 0.143 1.0 OP5 0.046 0.057 0.047 0.058 0.065 0.016 0.016 0.018 –0.009–0.0090.164–0.007–0.0350.121–0.030–0.030 0.039 0.086 0.080 0.0721.0 OP6 –0.039 –0.034 –0.039 –0.033 –0.0080.067 –0.008 –0.006 –0.003 –0.003 –0.0020.131–0.034 –0.0320.211–0.029 0.040 0.037 0.041 0.0440.047 1.0 Inter-item Correlations: Mean = 0.214; Minimum = –0.0496; Maximum = 0.971; Range = 1.0206; Max/Min = –19.5699; Variance = 0.0718. C opyright © 2011 SciRes. iB  Organizational Performance and Retail Challenges: A Structural Equation Approach 166 Table 7. Effect estimates for confirmatory factor model. Total Effects op rc4 rc1 rc3 rc2 rc4 –0.097 - 0.000 0.000 0.000 rc1 –0.111 0.653 0.000 0.000 0.000 rc3 0.707 0.219 0.000 0.000 0.000 rc2 1.330 0.366 0.000 0.000 0.000 Direct Effects rc4 –0.097 0.000 0.000 0.000 0.000 rc1 –0.048 0.653 0.000 0.000 0.000 rc3 0.729 0.219 0.000 0.000 0.000 rc2 1.365 0.366 0.000 0.000 0.000 Indirect Effects rc4 0.000 0.000 0.000 0.000 0.000 rc1 –0.063 0.000 0.000 0.000 0.000 rc3 –0.021 0.000 0.000 0.000 0.000 rc2 –0.035 0.000 0.000 0.000 0.000 Remarks: Chi-square = 2476.039, Degree of freedom = 201, Level of significance = 0.000. The values for fit indices have RMR = 0.05, NFI = 0.8, RFI = 0.8, IFI = 0.8, TLI = 0.8, CFI = 0.8. Hypothesis H1 and H2 are supported. rc1 Manpower Management 0.07 e4 Specialized Skills 0.03 e3 1 Transparency 0.04 e2 1 Product Sourcing 0.04 e1 rc2 Real Estate Cost 0.05 e8 Inadequate Infrastructure 0.07 e7 Multiple Taxes 0.05 e6 Karyana Stores 0.07 e5 1 1 1 rc3 High Connectivity 0.06 e12 Customer Loyalty 0.08 e11 Service Levels 0.08 e10 Quick Response 0.06 e9 1 1 1 1 rc4 Forecasting 0.08 e16 SC Performance 0.09 e15 Operations Management 0.08 e14 Operational Cos 0.05 e13 1 op Market Performance 0.19 e17 SC Competencies 0.18 e18 Stakeholder Satisfaction 0.17 e19 Innovation & Learning 0.16 e20 1 1 1 1 0.98 0.97 0.35 1.00 0.64 r1 1.16 r2 0.24 r3 0.70 r4 1 Customer Satisfaction 0.16 e21 1 Financial Performance 0.17 e22 1 0.03 r5 1 1 1 1 1 0.37 1.00 0.70 0.22 0.98 0.96 1.00 0.80 0.42 0.22 0.98 0.94 0.05 1.26 10.78 0.10 1 0.93 0.94 1 1 1.00 0.89 10.730.65 0.37 1.37 1.00 Figure 2. Confirmatory model for retail challenges and organizational performance. C opyright © 2011 SciRes. iB  Organizational Performance and Retail Challenges: A Structural Equation Approach Copyright © 2011 SciRes. iB 167 set at 1.0. The loading for environmental challenges (RC2) range from 0.93 to 0.98 and loading for real estate cost was set to 1.0. The loadings for customer challenges (RC3) range from 0.89 to 0.98 and loading for customer loyalty was set to 1.0. The loading for SC challenges (RC4) range from 0.35 to 0.70 and operations manage- ment was set at 1.0 loading. The loading for organiza- tional performance range from 1.26 to 0.22 and the load- ing for stakeholder satisfaction was set to 1.0. Also, the loading range for RC factors and OP varies from –0.05 to 1.37. The model has Chi-square = 2476.039, Degree of freedom = 201, Level of significance = 0.000. The values for fit indices have RMR = 0.05, NFI = 0.8, RFI = 0.8, IFI = 0.8, TLI = 0.8, CFI = 0.8. All these values are acceptable to validate the model. Here, it is pertinent mention that values for fit indices: NFI, RFI, IFI, TLI, and CFI ≥ 0.8 RMR value ≤ 0.05 and chi-square level of significance ≥ 0.05 is good enough for structural validity of the model [21,18]. The effect estimates are shown in Table 6. The results indicate that the total effects of re- tail challenges on organizational performance are sig- nificant. Also, SC challenges are significantly influenced by strategic challenges, environmental challenges, and customer challenges. 5. Discussion, Limitations and Future Research The results in the Figure 2 indicate that all the items load significantly on their respective factors indicating the applicability and contribution. The total effect esti- mates (Table 7) show that the total effect was highest for environmental challenges on OP followed by cus- tomer challenges. The discussion with organized NLR practitioners revealed that these two challenges are most difficult to control hence maximum attention need to be focused on them. Also the discussion on total effect for strategic challenge (–0.111) and SC challenge (–0.097) revealed that these challenges are internal to the organi- zations and shall be solved by inputs from R&D or con- sultants. Here, it was also interesting to point out that the organized NLR practitioners understand the importance of SC challenges. The total effect estimate for strategic challenges (0.653), environmental challenges (0.366), and customer challenge (0.219) on SC challenges. It clearly indicates that understanding of organized NLR practitioners for the same. Hence the hypothesis H1 and H2 are proved. However, despite the statistical sophistication of con- firmatory technique more was needed to understand the retail challenges and the organizational performance. Here, it is pertinent to mention that in different stages of or- ganizational life cycle the RC and OP items and factors are also different. It was also interesting to note that along with organized retailers traditional retailers are also im- proving. Hence, to understand the dynamics, it is needed to study customers, organized retailers, and traditional retailers together for identification of better gaps be- tween organized and traditional retailers. REFERENCES [1] A. Neely, C. Adams and M. Kennerley, “The Perform- ance Prism—The Scorecard for Measuring and Manag- ing Success,” Pearson Education Limited, London, 2002. [2] R. Rajmohan, “India Retail Report 2007,” IMAGES, F & R Research, India, 2007. [3] R. Rajmohan, “India Retail Report 2009,” IMAGES, F & R Research, India, 2009. [4] P. Neetu, “Retailing Revolution in India: An Overview,” The Management Accountant, Accountant, Vol. 42, No. 10, 2007, pp. 764-66. [5] S. Pradhan, “Retailing Management Text and Cases,” Tata McGraw-Hill, Publishing Company Limited, New Delhi, 2007. [6] A. J. Newman and P. Cullen, “Retailing Environment and Operations,” Cengage Learning India Private Lim- ited, New Delhi, 2002. [7] P. K. Sinha and D. P. Uniyal, “Managing Retailing,” Oxford University Press, New Delhi, 2007. [8] S. Jack, “Challenges of the Future: The Rebirth of Small Independent Retail in America,” IRMA, 2004, pp.10-22. http://www.retail-revival.com [9] G. Kapoor, “Revolutionizing the Retail Industry in In- dia,” Proceedings of the 51th World Business Summit, CIES, The Food Business Forum, 20-22 June 2007, pp. 211-35. [10] P. Bhatia and A. Sharma, “India’s Organised Retail Play- ers Rethinking Strategy,” The Economic Times, India, 27 September 2008. http://www.theeconomics times.com [11] S. Yamin, A. Gunasekruan and F. T. Mavondo, “Rela- tionship Between Generic Strategy, Competitive Advan- tage and Firm Performance: An Empirical Analysis,” Technovation, Vol. 19, No. 8, 1999, pp. 507-518. doi:10.1016/S0166-4972(99)00024-3 [12] E. W. Anderson, C. Fornell and D. R. Lehmann, “Cus- tomer Satisfaction, Market Share, and Profitability: Find- ings from Sweden,” Journal of Marketing, Vol. 58, No. 3, 1994, pp. 53-66. doi:10.2307/1252310 [13] S. Chopra and P. Meindle, “Supply Chain Management: Strategy, Planning, and Operations,” Pearson Prentice- Hall, Upper Saddle River, 2004. [14] A. A. Katou and P. S. Budhwar, “Casual Relationship Between HRM Policies and Organizational Performance: Evidence from Greek Manufacturing Sector,” European Management Journal, Vol. 28, No. 2, 2010, pp. 25-39. doi:10.1016/j.emj.2009.06.001 [15] W. G. Kenneth, D. Whitten and R. A. Inman, “The Im- pact of Logistics Performance on Organizational Per- formance in the Supply Chain Context,” Supply Chain  Organizational Performance and Retail Challenges: A Structural Equation Approach 168 Management: An International Journal, Vol. 13, No. 4, 2008, pp. 317-327. [16] K. W. Green, and R. A. Inman, “Using a Just-in-Time Selling Strategy to Strengthen Supply Chain Linkages,” International Journal of Production Research, Vol. 43, No. 16, 2005, pp. 3437-3453. [17] N. Vivek, and S. Ravindran, “An Empirical Study on the Impact of Supplier Performance on Organizational Per- formance: A Supply Chain Perspective,” South Asian Journal of Management, Vol. 61, No. 3, 2009, pp. 61-70. [18] J. F. Hair, R. E. Anderson, R. L. Tatham and W. C. Black, “Multivariate Data Analysis,” Prentice Hall, Englewood Cliffs, 2009. [19] M. S. Bartlett, “Tests of Significance in Factor Analy- sis,” British Journal of Statistical Psychology, Vol. 3, No. 2, 1950, pp. 77-85. [20] L. J. Cronbach, “Coefficient Alpha and the Internal Structure of Tests,” Psychometrika, Vol. 16, No. 3, 1951, pp. 297-507. doi:10.1007/BF02310555 [21] M. W. Browne and R. Cudeck, “Alternative Ways of Assessing Model Fit, in Testing Structural Equation Models,” Sage Publication, 1993. C opyright © 2011 SciRes. iB
|