Journal of Materials Science and Chemical Engineering
Vol.03 No.01(2015), Article ID:54454,8 pages
10.4236/msce.2015.31014
Numerical Simulation of Mechanical Properties of Nano Particle Modified Polyamide 6 via RVE Modeling
M. Uhrig, J. Wiedmaier, U. Weber, S. Schmauder
Institute for Materials Testing, Materials Science and Strength of Materials, University of Stuttgart, Stuttgart, Germany
Email: muhrig3@gatech.edu, jing.wiedmaier@imwf.uni-stuttgart.de


Received October 2014

ABSTRACT
In this paper the mechanical behavior of a Polyamide 6 (PA 6)/Montmorillonit (MMT)-nanocom- posite is examined by a selected structure modification within a numerical parameter study. Experimental data of tensile tests of three different volume fractions at ambient temperature are used as reference. These were compared to homogenized stress-strain curves calculated with 3D representative volume elements (RVE) under periodic boundary conditions. Thereby the curve areas are considered until the tensile yield strength is reached. Besides the influence of filler orientation, exfoliation and its volume fraction, especially the adhesive interface behavior between filler and matrix, and local, partially crystalline interphases around the MMT-plates were taken into account. The interface behavior was described using a cohesive zone model whereby the implemented values where derived from a Molecular Dynamics (MD) simulation. The local, partially crystalline interphases around the MMT plates were modeled with a thickness of 30 - 40 nm. These areas were assumed to be transversely isotropic both in the elastic and in the plastic regime, whereby the transverse plane is defined by the lateral particle surface. A good approximation of the experimental curves was achieved only after the introduction of those interphases. In the elastic regime an excellent agreement is found between experimental and numerical values. In the plastic regime especially the largest MMT volume fraction investigated, matches perfectly with the experimental reference, whereby lower filler contents slightly underestimate the mechanical values.
Keywords:
PA 6 Nanocomposite, RVE Modeling, Cohesive Zone Model, Transverse Isotropic, Mechanical Properties

1. Introduction
Due to the thermal stability of their mechanical properties, polyamides are regarded to be one of the most important, super-engineering “materials. The two main types are Polyamide 6 (PA 6) und Polyamide 66 (PA 66) [1]. The increasing significance of lightweight constructions in the automotive industry offers an enormous potential for PA6 and PA66, due to their lower density compared to metals and their special properties compared to other plastics. Therefore well-known PA producers work on new material and technology solutions for lightweight constructions [2].
With rising demands on the range of properties of polymer materials, a particular importance is given to the new development of composites with improved mechanical characteristics. For instance, the combination of polymers with nanofillers, e.g. inorganic clays, promises a new generation of material with improved physical, mechanical, thermal, electrical and optical properties [3]. One of the biggest advantages of these materials is that even small volume fractions of nanoscaled clay would lead to enormous modifications of the general composite properties [3]. Thus, they achieve a lower weight and better processing properties compared to micro fillers [4]. The considerable effect of small filler fractions can be explained by the exceptional huge interacting clay surface, the presence of a large number of reinforcements and the fixation of polymer chains on the nanoscale. This results in a big spectrum of different influences on the matrix material [5]. To exploit the maximum potential of the nanomaterial, the understanding of the basic physical properties is essential. Although significant progresses have been made in the development of the nanocomposite, the understanding of the structure‑process‑property correlations is still a big scientific challenge. The interaction between polymer phase and clay surface has not been completely investigated. The phase interface behavior complicates the discussion of clay influence due to a lack of information. Furthermore deformation and failure are not as well investigated as structure and special properties [6]. The fitting clay surface modification is one of the most important challenges concerning the processing of the nanocomposite because it influences both the clay dispersion in the matrix and the phase interaction [4]. In the present work, a better understanding of the reinforcement effect of PA6/layered silicate is provided by a combined numerical and experimental approach.
2. Mechanical Properties
The experimental reference curves are resulting from a tension test (DIN EN ISO 527-1). To generate local stress-strain curves, the ARAMIS system was used. The optical system describes a short-distance photogrammetry, which allows the generation of real, local stress strain curves by the optical persecution of marker coordinates and their correlation with the applied force [9]. In Figure 1 the experimental reference curves of different filler contents are shown. Furthermore, a curve of pure PA 6 is depicted. The extent of strain shown in Figure 1 contains both Young’s Modulus and yield strength of the composite. This part of the stress strain curve was simulated in the present work.
In Table 1 the strengthening of the MMT is summarized for the different filler contents investigated. It is obvious that little filler fractions lead to an enormous increase of the mechanical values. The Young’s modulus is nearly doubled, if a filler fraction of 2.76 vol% is considered.
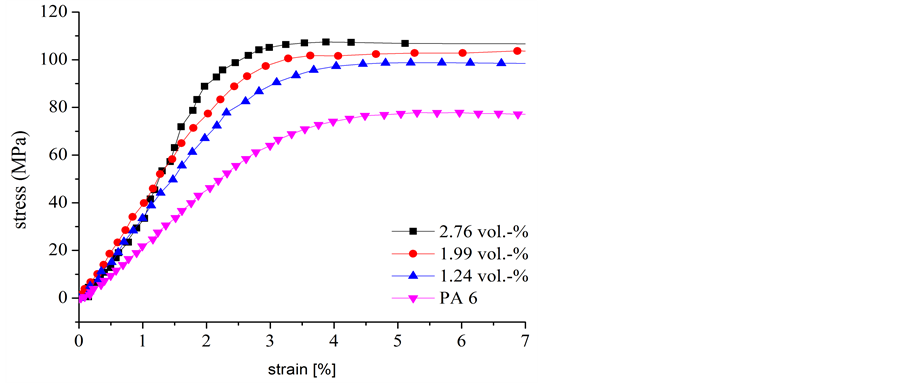
Figure 1. Experimentally determined stress and strain curves of the investigated composite containing different filler fractions of clay.

Table 1. Mechanical parameters of the composites.
3. Morphological Properties
The size of the nanofiller platelets (approximate height of 1 nm and diameter of 100 nm [13]) is in the same scale as the radius of gyration of a polymer chain. Additionally the polar clay surface interacts with the polar parts of the polymer chain (carbon amid groups, carboxyl group and amino groups). Both factors lead to the assumption that the polymer chain dynamics are strongly influenced by the MMT inclusions. [7] [12] The clay induces heterogeneous nucleation during the crystallization process of the polymer. In most cases the orientation of lamella in the semicrystalline areas around a platelet is described as perpendicular to the lateral particle surface [8]. This kind of orientation is depicted in Figure 2. A silica platelet (green) as well as the lamella orientation (blue) is indicated as an example. In the present work, the lateral expansion of the semi-crystalline phase is assumed to be between 15 - 20 nm on each side of the clay layer [5] [8].
The semi-crystalline area around the platelet has been assigned with transverse isotropic material behavior and the transversal plane complies with the particle surface. The material values used in this work are based on a publication by P.A. Tzika et al. [10]. Specific adaptations were made, because the values from Tzika et al. describe a compression test, whereby only the α-PA 6 crystalline was considered. Thus we reduced the R11 value because a tension test was simulated assuming that plastic deformation is caused by interlamellar displacements [11]. We also increased the shear strength values in the transversal plane with the assumption that the γ-PA 6 crystalline is the dominating form of the PA 6 crystals. The γ-form shows three dimensional hydrogen bonding between the folding planes whereas the planes of the α-form are only connected by van der Waals forces. Thus, a higher shear strength results [10]. The parameters used for the transverse isotropic PA 6 phases are summarized in Table 2 and Table 3.
4. Model Generation
All numerical material simulations were performed with a 3D representative volume element (RVE) with periodic boundary conditions. In order to define the “sufficient” RVE size, the minimum size was investigated based on the work of Gitman et al. using the CHI-square criterion [12]. We found out, that a sample size of 300 nm edge length results in an accuracy larger than 95%. In all of the simulated FE-Models, 100 platelets were used to describe the homogenized mechanical properties of the composite. The geometry was created with the program DIGIMAT/FE. The parameters used to describe the geometry of the composite result from TEM investigations as shown in Figure 3. The MMT platelets were described as perfect cylinders with a height of 0.94 nm. The diameters were varied within a normal distribution (average 100 nm; standard deviation 17nm). Thereby completely exfoliated (50%) and intercalated platelets, consisting of two (38%) and three (12%) layers were taken into account. In order to describe different volume fractions of MMT the box size was changed. The positions of the inclusions were chosen randomly by Digimat/FE but the orientations were predefined with an orientation tensor. Based on the experimental values Geier [13] assumed that the tension rod consist of three areas with different filler orientations. These differences result from the filling process of the tension rod during injection molding. Due to higher shear forces at the rim the MMT-inclusions are strongly oriented into the flow direction of the melt in that area and less oriented in the center of the tension rod. Referring to Geier [13] those two areas are connected with an elliptic superstructure which also shows a high orientation into the flow direction. Due to the fact that the available true stress-strain (ARAMIS) curves focus only on the rim of the tension rod the assumption was taken that the orientation in the simulated RVEs should be similar to the rim or at least to the elliptical superstructure. The resulting geometry is imported in the preprocessor Altair Hypermesh. Since ABAQUS/Standard only offers linear cohesive elements (COH3D6 and COH3D8) we preferred the use of linear

Figure 2.TEM image of the core region of an injection molded PA 6/MMT composite.
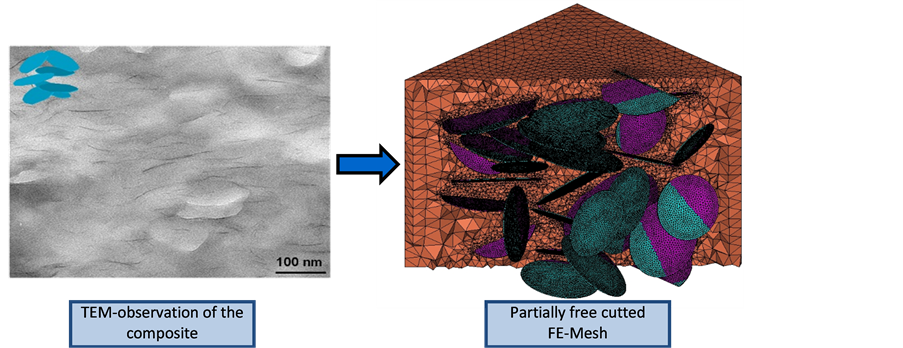
Figure 3. Description of the model generation (TEM picture by [14]).
Table 2. Elastic constants of the transversely isotropic PA 6.
Table 3. Hill-Ratios of the transversely isotropic PA 6.
elements for the entire models to the use of a contact definition between different element types. In a convergence study it was verified that linear C3D4-Tetraedas, which were taken to discretize the PA6-matrix, achieve a sufficient accuracy at lower computing time than quadratic elements.
5. Phase Interaction and Surface Effects
Surface and interface effects play an important role concerning processing and mechanical properties of the nano composite. From a thermo dynamic point of view, the work of adhesion Wa describes the work, which is necessary to separate wophases in are versible way [15]. The thermo dynamic work of adhesion is proportional to the local adhesion tension and the range of the surface force on the interface [15]. It is sum of the work consisted of the dispersion forces Wad and the work based on hydrogen bonds  [3]:
[3]:
 (1)
(1)
The range of dispersion is 0.3 - 10 nm and that of hydrogen bonds 0.3 - 0.5 nm [16]. In this work we assumed a range of approximately 0.85 nm. If Wa is exceeded, the adhesive fracture and thus interfacial debonding and the formation of nanopores will take place. This kind of damage was shown in the TEM-investigations [17].
Implementation of Adhesive Interface Behavior
The adhesive interfacial debonding was modeled with cohesive elements in ABAQUS/Standard. With those elements, it is possible to idealize complex fracture mechanisms with a “cohesive law” that relates the traction t across the interface with the separation δ [18]. The traction separation law is shown in Figure 4.
The cohesive elements are able to take traction their plane (n-direction) and tractions in their plane (shear directions t and s). The properties of the elements can be configured in each load direction by defining the parameters of the elements (stiffness, damage initiation criterion, type of the damage evolution). In this work we used the maximum stress (MAXS) criterion (Equation (2)) to describe damage initiation. Furthermore linear displacement based softening (Equation (3)) was assumed.
 (2)
(2)
 (3)
(3)
The material values of the interface were based on a molecular dynamics (MD) simulation and were iteratively adjusted to the experimentally determined yield strain. In Figure 5 this multiscale approach is sketched and the different scales are given. The latter increased in the numerical models with a higher work of adhesion Wa. The final resulting input values are compatible to references in the literature (e.g. Wa = 5.279 × 10⁻² J/m2 [19]). The parameters for all 3 directions (n, t and s) used for the cohesive layer are summarized in Table 4.

Figure 4. Traction separation law of the cohesive elements.
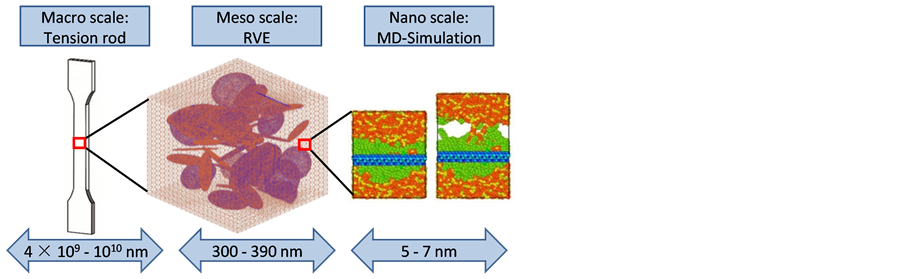
Figure 5. Multiscale approach for the adjustment of the interface behavior (Tension rod [20]; RVE; MD [21]).
6. Results
The different input data described in the previous chapters led to a good agreement of experimental and numerical curves (Figure 6). In the elastic regime the corresponding numerical (cal.) and experimental (exp.) curves are close together. By trend the numerical results show slightly lower stresses at the same strain values than the experimental ones. This applies especially to the plastic regime.
In Figures 7-9 the mechanical properties of the investigations are summarized. Figure 7 compares the Young’s modulus of the numerical models with the Young’s modulus of the experimental data (ARAMIS). Besides the RVEs in which semi-crystalline areas where taken into account, the values for a completely isotropic PA 6 matrix are also shown. The figure depicts that an excellent agreement with the numerical values is achieved only after the integration of semi-crystalline areas around each MMT platelet. A non-linear increase of the Young’s modulus at the highest volume fraction is also observed.
In the plastic regime (see yield strength in Figure 8) a discrepancy between the calculated curves and the ARAMIS values is observed. A very good agreement for the yield strength is only achieved at the highest volume fraction (2.76 vol.-%) of MMT. In general the results for the semi-crystalline matrix are closer to the ARAMIS data than the values that are generated by the isotropic matrix.
In Figure 9 the results for the yield strain are shown. The development of that parameter is also in good agreement with the experimental results. With increasing filler content the yield strain decreases. With the semi-crystalline matrix the change of the values is again non-linear.
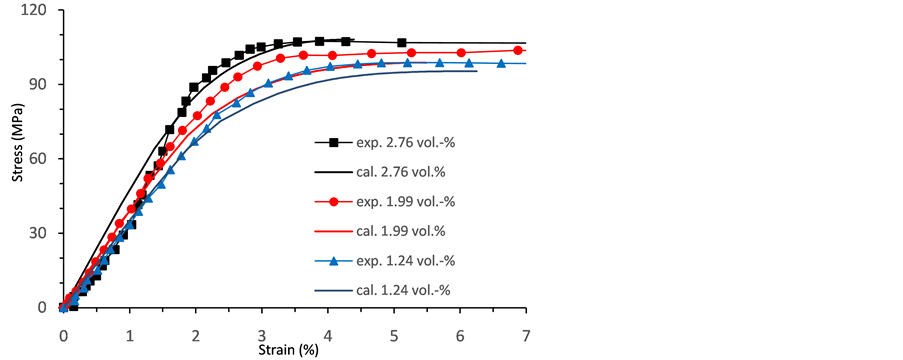
Figure 6. Comparison between numerical (cal.) and experimental determined (exp.) stress-strain curves for different filler contents of MMT.

Figure 7. Comparison of the Young’s module (numerical and experimental) for different filler contents of MMT.

Figure 8. Comparison of yield strength for different volume fractions of MMT.

Figure 9. Comparison of yield strain for different filler contents of MMT.
Table 4. Elastic constants of the transversely isotropic PA 6.
However, it must be noted, that the numeric values show a non-linear change for the yield strength which is not observable in the ARAMIS data. This non-linear change is observed for each parameter investigated (Young’s modulus, yield strength, yield strain). Since the thickness of the semi-crystalline phases is constant (15 - 20 nm), the percentage of transversely isotropic modelled RVE area increases with the filler content of MMT and takes a very big part in the models which represent the highest volume fraction (2.76 vol.%). In this context the nonlinearity is explainable.
The numerical results as well as the experimental findings support the premise that structural changes in the matrix morphology is caused by the presence of clay. These changes influence the general properties of the PA 6 composite.
7. Conclusion
The three-dimensional representative volume element with periodic boundary conditions and the material models used, generated a good description of the experimental stress-strain reference curves. Especially in the elastic regime there is an excellent agreement. The results of the investigations showed that the overall mechanical properties of the composite model is influenced by different parameters such as extent of exfoliation, orientation, filler content, phase interaction and morphology change of the polymer. However, the physics of nanomaterials could not be described by a linear superposition of the single phase properties. Additionally the specific phase interaction and modification of the polymer structure have to be taken into account to numerically approach the considered part of the real stress and strain curves, despite made simplifications.
Cite this paper
J. Huang,M. Uhrig,U. Weber,S. Schmauder, (2015) Numerical Simulation of Mechanical Properties of Nano Particle Modified Polyamide 6 via RVE Modeling. Journal of Materials Science and Chemical Engineering,03,95-102. doi: 10.4236/msce.2015.31014
References
- 1. Sarbadi, M.R. (2011) Study of the Influence of Nanoparticles on the Performance and the Properties of Polyamid 6. Universität, Institut für Polymerchemie, Diss., Stuttgart.
- 2. Bienmüller, M., Joachimi, D., Klein, A. and Münker, M. (2013) Polyamid 6 und 66 (PA 6 und 66) Kunststoffe, Heft 63, S. 68-78.
- 3. Bhattacharya, S.N., Gupta, R.K. and Kamal, M.R. (2008) Polymeric Nanocomposites. Theory and Practice. Hanser, München. ISBN 978-3-446-40270-6.
- 4. Zhang, M.Q., Rong, M.Z. and Ruan, W.H. (2009) Nano- and Micromechanics of Polymer Blends and Composites. Chapter 3. Nanoparticles. Polymer Composites: Fabrication and Mechanical Properties. Hanser, S., München, 93-140. ISBN 978-3-446-41323-8.
- 5. Dasari, A. (2009) Nano-and Micromechanics of Polymer Blends and Composites. Chapter 11. Fracture Properties and Mechanisms of Polyamid. Clay Nanocomposites, Hanser, S., München, 377-423. ISBN 978-3-446-41323-8.
- 6. Dominkovics, Z., et al. (2013) Effect of Clay Modification on the Mechanism of Local Deformations in PA6 Nanocomposites. Macromolecular Materials and Engineering, Band 298, Heft 7, S., 796-805.
- 7. Jancar, J. (2009) Nano- and Micromechanics of Polymer Blends and Composites. Chapter 7. Interphase Phenomena in Polymer Micro- and Nanocomposites, Hanser, S., München, 241-266. ISBN 978-3-446-41323-8.
- 8. Sheng, N., et al. (2004) Multiscale Micromechanical Modeling of Polymer/Clay Nanocom-posites and the Effective Clay Particle, Polymer, Band 45, Heft 2, S. 487-506.
- 9. Praktikum “Werkstoff- und Bau-teilprüfung” (2013) Experimentelle Spannungsanalyse mit Dehnungsmessstreifen und ARAMIS. Stuttgart, Universität, Institut für Materialprüfung, Werkstoffkunde und Festigkeitslehre, Praktikumsunterlagen.
- 10. Tzika, P.A., Boyce, M.C. and Parks, D.M. (2000) Micromechanics of Deformation in Particle-Toughened Polyamides. Journal of the Mechanics and Physics of Solids, 48, 1893-1929.
- 11. Michler, G.H. and Baltá-Calleja, F.J. (2012) Nano- and Micromechanics of Polymers. Structure Modification and Improvement of Properties. Hanser, München. ISBN 978-3-446-42767-9. http://dx.doi.org/10.3139/9783446428447
- 12. Gitman, I.M., Askes, H. and Sluys, L.J. (2007) Representative Volume: Existence and Size Determination. Engineering Fracture Mechanics, Band 74, Heft 16, S. 2518-2534,.
- 13. Geier, S. (2011) Optimierung von Steifigkeit/Zähigkeits-Eigenschaften nanoskaliger Polyamid 6—Verbund werkstoffe durch Analyse von Struktur/Eigenschafts—Korrelationen, University of Stuttgart, Institute for Polymer Technology, Diss.
- 14. IKT, Institute for Polymer Technology, University of Stuttgart.
- 15. Dutschk, V. (2000) Oberflächenkräfte und ihr Beitrag zu Adhäsion und Haftung in glasfaserversträrkten Thermoplasten. Dresden, Technische Universität, Fakultät Maschinenwesen, Diss.
- 16. Jurhart, J. (2011) Adhäsion von UHPC an Stahl und Glas. Ein Beitrag zu Adhäsion und Haftfestigkeit von Hochleistungs- und Ultra-Hochleistungs-Feinkornbeton an Stahl und Glas unterschiedlicher Rauheit. Technische Universität, Fakultät für Bauingenieurwissenschaften, Graz.
- 17. He, C., et al. (2008) Microdeformation and Fracture Mechanisms in Polyamide-6/Organoclay Nanocomposites. Macromolecules, 41, 193-202. http://dx.doi.org/10.1021/ma071781s
- 18. Weber, U. (2011) Cohesive Modeling with ABAQUS: Some General Remarks. University of Stuttgart, Institute for Materials Testing, Materials Science and Strength of Materials, Internal Semina.
- 19. Borse, N.K. and Kamal, M.R. (2006) Melt Processing Effects on the Structure and Mechanical Properties of PA-6/Clay Nanocomposites. Polymer Engineering & Science, 46, 1094-1103.