 American Journal of Oper ations Research, 2011, 1, 65-72 doi:10.4236/ajor.2011.12010 Published Online June 2011 (http://www.SciRP.org/journal/ajor) Copyright © 2011 SciRes. AJOR Evaluating the Performance of Iranian Football Teams Utilizing Linear Programming Jahangir Soleimani-Damaneh, Mehrzad Hamidi, Nasrollah Sajadi Faculty of Physical Education and Sport Science, University of Tehran, Tehran, Iran E-mail: j.soleimani.d@gmail.com, meh_hamidi@yahoo.com, nsajjadi@ut.ac.ir Received May 24, 201 1; revised June 10, 2011; accepted June 16, 2011 Abstract In this paper, we utilize Data Envelopment Analysis (DEA), which is a linear programming-based technique, for evaluating the performance of the teams which operate in the Iranian primer football league. We use Ana- lytical Hierarchy Process (AHP) technique for aggregating the sub-factors which involve in input-output fac- tors, and then DEA is used for calculating the efficiency measures. Also, AHP is used to construct some weight restrictions for increasing the discrimination power of the used DEA model. For calculating the effi- ciency measures, input-oriented weight-restricted BCC model is utilized. Keywords: DEA, Linear Programming, Sport Management, Football 1. Introduction Awareness of the performance scores and analyzing the effectiveness (productivity) of the units under the control of a manager, using the scientific methods, is one of the most important tools that could help the managers to make better decisions and can be lead in optimal usage of the current resources. Based upon the efficiency analysis, the manager can decide about contracting or expanding the units [1-3]. Furthermore, experiences show that measuring and analyzing the efficiency of units can lead to a feeling of competitiveness among the subsystems, and this would have a positive effect on the overall performance of the system [1,2]. Also, as a great advantage, the performance analysis of the system can help the managers to sketch a suitable plan for allocating the budget, common revenues, rewards or shared costs to DMUs [1]. Data envelopment analysis (DEA) is a non-parametric linear programming-based technique for measuring the relative efficiencies of a set of decision making units (DMUs) which consume multiple inputs to produce mul- tiple outputs. This technique was initially proposed by Charnes et al. (CCR model) [3] and was improved by other scholars, especially Banker et al. (BCC model) [4]. More than 4000 journ al articles are now published in this field [5]. DEA has allocated to itself a wide variety of theoretical and applied research. See monographs [1,2] and also the review paper [5] for more details about DEA and its applications. There are many publications that address the applica- tions of DEA in football frameworks. Most of these pa- pers are studying the English Football Premier League. The problem of hidden action in organizations makes direct measurement of managerial performance problem- atic. As mentioned in [6], in Eng lish association football, hidden action is unlikely to be as serious a problem be- cause the owner observes the manager’s performance each time the team plays. Barros et al. [7-10] utilized the random stochastic frontier model, DEA models, and an econometric frontier model to examine the (technical) efficiency of the English football Premier League. In [8], Barros and Garcia-del-Barrio considered a stochastic mo- del for performance analysis from 1998/99 to 2003/04 which disentangles homogenous and heterogeneous va- riables in the cost functio n. Guzman and Morrow [11] used information from clubs’ financial statements as a measure of corporate perform- ance. To measure changes in efficiency and productivity, they utilized the Malm quist non-param etric technique. Barros et al. [12] and Calôba and Lins [13] utilized DEA for performance evaluation in Brazilian Football League. Barros et al. [12] introduced a two-stage boot- strapped DEA analysis model. Calôba and Lins [13] in- corporated the value judgments, applying a method to consolidate the results of the national and international matches. Tiedemann et al. [14] studied the assessing the per- formance of German Bundesliga football players, cover-  66 J. SOLEIMANI-DAMANEH ET AL. ing the playing seasons 2002/03 to 2008/09, utilizing a non-parametric meta-frontier approach. Haas et al. [15] utilized some basic DEA models for evaluating the per- formance of German football teams. The efficiency scores obtained by Haas et al. are not correlated with rank in the league. Also, th ey studied the sources of the ineffi- ciency and utilized some tests for sensitivity analysis of the results with respect t o di ff erent i nput-output factors. Some scholars used DEA to evaluate the performance of Spanish football teams. Escuer and Cebrian [16] stud- ied this league, comparing the results that they actually obtain with those that they should have obtained on the basis of their potential. Barros and Garcia-del-Barrio [8] analyzed the efficiency drivers of a representative sample of Spanish football clubs, in the period 1996–2004, by means of a two-stage DEA procedure. Guzman [17] studied the Spanish league from a financial point of view. In another study, Gomez and Tadeo [18] performed a more comprehensive study on the Spanish league. They assessed the performance of Spanish professional foot- ball teams at various competition levels, namely, League, King’s Cup and European competitions (Champions League and UEFA Cup), using DEA and directional dis- tance functions. They used the gap between the result obtained by a team in a given competition and that ex- pected according to its potential as a proxy of the degree of satisfaction that fans should feel; the narrow er the gap, the greater the level of satisfaction. Jardin [19] studied the efficiency of the French foot- ball clubs (Ligue 1) from 2004 to 2007 using weight- restricted DEA m odel s. There is a comparative research work on performance assessing in Greece and Portugal football league. Douvis and Barros [20] estimated changes in total productivity, by means of DEA and Malmquist index, applied to a representative sample of football clubs in Portugal and Greece. They ranked the football clubs according to their change in total productivity for the period 1999/2000 to 2002/2003, seek ing out tho se best p ractices that will lead to improved performance in the market, and concluding that some clubs experienced productivity growth while others experienced a decrease in productivity. As another comparative research study, Boscá [21] analyzed the technical efficiency of Italian and Spanish football, using basic DEA, during three recent seasons, to shed light on the sport performance of professional football clubs. The only Asian country which we found a research work on its football league is Korea. Lee [22] studied three Korean sport league, including football. In addition to the above mention ed papers, which dealt with the assessing in football leagues in different coun- tries, there is a paper studying the UFEA league. Pa- pahristodoulou [23] used basic DEA to estimate the per- formance of all 32 participated football teams in the UEFA Champions League (CL) tournament 2005-2006, based on official match statistics from all 125 matches. The main aim of the paper is utilizing DEA for meas- uring the efficiency of the teams operating in the Iranian primer football league. In fact, we provide a hybrid tool consisting of Analytical Hierarchy Process (AHP) and DEA. The AHP instrument is used for aggregating the sub-factors which involve in input-output factors, and then DEA is used for calculating the efficiency measures. One of other techniques which are used in the present study is AHP. The concept of AHP was developed by Saaty [24] in the 1970s and is very useful when the deci- sion-making process is complex. AHP is an approach to decision making that invo lves stru cturing multiple ch o ice criteria into a hierarchy, assessing the relative impor- tance of these criteria, comparing alternatives for each criterion, and determining an overall ranking of the al- ternatives. Indeed, AHP allows a better, easier, and more efficient identification of selection criteria, their weight- ing and analysis [25]. The rest of the paper unfolds as follows: Section 2 deals with the basic DEA models; Section 3 is devo ted to the main results and; Section 4 contains conclusions. 2. Basic DEA Models Let us assume that we have n DMUs, that DMU ; 1, 2,,jn uses input levels ij ; to produce output levels rj , . 1, 2, ,rs ,im y1, 2, t ,Le j y denote the input-output vector of DMU . Considering DMUo , oo y, which as the unit un- der assessment, the following model contains both CCR and BCC models in input orientation. These two models were provided by Charnes et al. [3] and Bank er et al. [4], respectively, as the first DEA models. , n1, 2o inimiz 1 .. 0, n ojj j st xx 1 , n jo j yy in which :0 CCR and 1 :1, n BCC j j 0. These two models assess the DMUs under constant Copyright © 2011 SciRes. AJOR  J. SOLEIMANI-DAMANEH ET AL. 67 returns to scale (CRS) and variable returns to scale (VRS) assumptions of technology, respectively. After introduc- ing these basic DEA models, numerous applications of this instrument have been reported in financial services, sport frameworks, agricultural, health care services, education, manufacturing, telecommunication, supply chain management, and many more. See some bibliog- raphies of DEA in [1-5]. 3. Main Results 3.1. Novel Applications of AHP Although AHP is usually used for ranking the prefer- ences in an MCDM context, in this paper, we address some novel applications of this technique. One of the very important points which must be no- ticed during using of DEA for applied purposes is the number of input-output factors compared with the num- ber of the DMUs. As it can be seen in the DEA literature [1, 2, 26, 27], if the number of inputs and outputs is not very less than the number of DMUs, then the efficiency scores of the units increase and so the discrimination power of DEA models decrease. To overcome this, we must combine the input-output factors and reduce the number of inputs and outputs. To do this, in this paper, we estimate the value of the sub-factors which involve in inputs/outputs, by using the AHP technique (utilizing a group decision making manner), and then we calculate inputs/outputs as a weighted sum of the sub-factors. We do it through the following AHP steps: Step 1: Constructing the hierarchy analysis tree: To start the AHP approach, we need a hierarchy analysis tree as depicted in Figure 1. The tree considered in the present paper has three levels. The purpose of the study i.e. assessing the performance of Iranian football Primer League teams (P) is placed at the highest level. The sec- ond level is then divided into the two categories of input and output. In each category the decision criteria are placed in the second level and the next level is allocated to decision options (input-output sub-factors). As it can be seen in Figure 1, in the category of inputs: (F) refers to the fixed assets of each team and; (W) refers to the amount of wages paid to the employees. This criterion in turn is divided into three sub-factors: player wages (PW), coach wages (CW), and staff wages (SW). In the cate- gory of outputs, three criteria are also taken into account: here (P) refers to the points received by the team, (S) stands for the number of spectators watching the team’s matches, and (R) refers to the team’s income at the end of the season. The values of the above-mentioned factors for considered clubs have been obtained from the infor- mation sector of the Iranian Football Feder ation [2 8]. Step 2: Prioritizing the criteria through the use of paired comparisons (weighing): Regarding the above discussion, after obtaining the above mentioned factors for each state, the second step is weighing these factors. To this end, we used the pairwise comparison matrices and a group decision making manner. Considering each output, 50 top sports experts filled out these pairwise comparison matrices. In fact, for each pair of the criteria, 50 experts in top sport management were asked to an- swer the following question by making paired compari- sons and to determine the relative value of a given prior- ity as compared to the other priority by selecting a num- ber from 1 to 9: “how do criterion A and B relatively differ in importance?” In rating system, 1 indicates equal importance and 9 denotes the maximum difference of each criterion from another in importance. The values were made normal for determining the average weight of each criterion. After this, we used the geometric mean for aggregating the experts’ opinions, see [24]. Tables 1-3 denote the pairwise comparison matrices after ag- gregating the experts’ opinions. Now, our aim is to conduct the proper measurements for determining the priority of decision element by the use of the information provided in paired comparisons matrix (A). Here we normal each column of paired com- parisons matrix using the following formula: ij jtj t Ni The resulting matrix is called “normal comparisons matrix”. Afterwards, the mean of the numbers on each row of normal comparisons matrix was obtained as fol- lows: ij j i N mn Figure 1. AHP tree. P Input Output F CW W P S R PW SW Copyright © 2011 SciRes. AJOR  68 J. SOLEIMANI-DAMANEH ET AL. Table 1. Paired comparisons matrix for output criteria. P R S P 1 0.56243 2.091614 R 1.777997733 1 2.959909 S 0.478099721 0.337848 1 Table 2. Paired comparisons matrix for paired criteria of inputs. W F W 1 1.20217726 F 0.831824084 1 Table 3. Paired comparisons matrix for the criterion of wages. CW PW SW CW 1 0.503489 6.31888 PW 1.986142 1 6.973399 SW 0.158256 0.143402 1 in which n is the number of the rows. This mean refers to the relative weight of decision elements against the rows of the matrix. Step 3: Determining the overall value of each option: In the final step of the process, the obtained numbers from each option were combined together in order to de- termine the value of each criterion. For ranking the deci- sion options, the relative weight of each element is multi- plied by the weight of higher elements in order to deter- mine the overall weight of that element. The weights ob- tained from the above procedure for each sub-factor, which can be interpreted as the value of them, have been listed in the last column of Table 4. After obtaining the weights of the sub-factors, we calculated the inputs as weighted sum of these sub-factors. In Figure 1, it can be seen that the outputs have been obtained without using of AHP. It is worth mentioning that, after using the AHP pro- cedure, we calculated the consistency Ratio (CR) of each used pairwise matrix too, and it was lees than 0.1 for each matrix. Table 4. The overall value of considered criteria. Weight Sub criteria Weight Criteria P.W 0.550676 C.W 0.361873 W 0.714286 S.W 0.08745 - - - - - - Input F 0.285714 - - R 0.496231 - - P 0.322138 - - Output S 0.181632 - - In addition to the above-mentioned application of AHP, as another application of this instrument, we use it to construct some weight restrictions for imposing to DEA models to increase the discrimination power of these models [26,27]. It is worth mentioning that incor- porating the value judgments and managers’ opinions in efficiency analysis plays a crucial role to produce real efficiency measures and to have a more realistic per- formance analysis [1,2,26,27]. We have incorporated this here, using a group decision making manner in an AHP framework. To evaluate the Efficiency of Iranian Football Primer League teams, we selected the input-out put factors with a reference to the literature and with respect to the avail- ability of data. Accordingly, two inputs and three outputs were selected. The first input constitutes of the amount of the wages paid to coaches, players and staff. Nowadays, sport clubs invest huge amount of money in recruiting first grade coaches to guarantee the team’s success. In their studies, Haas et al. [16], Barros and Leach [7], and Barros et al. [12] used this factor as an input for assessing the per- formance of football teams. Furthermore, player wages constitute a huge part of each team’s expenditure. The results of the studies of Szymanski and Kuypers [29], Szymanski and Smith [30] have indicated that there is a relationship between the sporting success and the amount of player wages in a team. Haas et al. [15] in their re- search have taken this factor into account as an input in assessing the performance of football teams. Staff such as physician, massager, procurement manager, trainers is considered as one of the factors effective in a team’s success. Therefore, the wages paid to these people have also been taken into account in this study. The second input incorporates the teams’ fixed assets. For any football team one of the deciding factors in its achievement is no doubt the available facilities for that team. Since the fixed assets of each team such as private stadium, private practice camp, and administrative build- ings to some extent reflect the teams’ available facilities, this criterion has been considered as an input. Three outputs have also been considered: 1) The points gained by each team at the end of the season, 1: This variable assesses the sporting performance of a football team. Guzman and Morrow [11], Haas et al. [15], Douvis and Barros [20], Jardin [19], Lee [22], Bar- ros et al. [12], have considered this indicator as an output. 2) Season total revenues: This variable indicates the teams’ financial success [11]. In this study the club’s incomes involve the incomes received from TV broad- casting rights, sponsorship, trade, selling tickets, player transfer and the other sources of income. Haas et al. [6], Guzman [17], Douvis and Barros [20], Jardin [19], Bar- Copyright © 2011 SciRes. AJOR  J. SOLEIMANI-DAMANEH ET AL. 69 ros et al. [12], have utilized this variable as an effectual factor in team’s performance for assessing the perform- ance of football teams. 3) The rate of attraction of spectators to stadium: In their studies, Douvis and Barros [20], Haas et al. [15], and Lee [22] have utilized this variable as one of the in- puts in measuring the efficiency of football teams. To obtain the inputs-outputs of the clubs, we have used the AHP tool. AHP is on e of the most popular mul- tiple criteria decision making (MCDM) approaches and was first introduced by Saaty [24]. This technique is based on paired comparisons. Because of the high poten- tiality of AHP technique in solving the MCDM problems, it is extensively used in various areas such as taking de- cision about expanding oil fields, measuring the per- formance, agriculture, resource allocation, and decision making in general. After obtaining the above mentioned sub-factors for each state, we performed AHP for weighing these sub- factors, as mentioned above. After obtaining the weights of the sub-factors, we calculated the inputs as weighted sum of these sub-factors. In Figure 1, it can be seen that the outputs have been obtaine d witho ut using of AHP. 3.2. Using of DEA For starting the DEA application, the first stage is se- lecting a convenient model. Since we would like to let the small units to be efficient too, we choose the variable returns to scale assumption on technology [1-5]. Also, for incorporating the value judgments and managers’ opinion in analysis, we have used the weight-restricted models [26, 27]. For constructing the weight restriction we applied AHP again, and the obtained values of inputs and outputs have been listed in the third column of Table 4. Due to these values, we imposed the following weight restrictions: 13 3,uu , 12 1.5uu12 2.5 .uu Regarding the above discussion, we selected weight- restricted BCC model, as follows: 13 12 12 3 max .. 0,1,2,, , 1, 30, 1.5 0, 2.5 0, 0. oo jo j o uy u st uy u vxjn vx uu uu vv v Then we used the got input-output values in this model using the GAMS software. The obtained efficiency scores have been listed in Table 5. In fact, the considered models estimates the efficiency score based upon a weight restricted PPS (WRPPS), and so, it can be written as follows too: min :,. oo yWRPPS 3.3. Results and Discussions A ranking based upon the obtained efficiency scores can be seen in the last column of able 2. The results given in Table shows seven teams (i.e. 39%) are efficient. Sepa- han, Esteghlal TEH, Shahin, Abumoslem, Tirakhtor, Moghavemat and Steelazin possessed the efficiency score of 1 and Esteqlal AHV had the lowest score with efficiency score of 0.51. The average of the efficiency scores is 0.80 and 45% of the teams has a score more than this average. Al- though the average of the scores is approximately good (though it is not fabulous), there is only one inefficient team (Perspolis) having a score more than this average. This shows that the difference distance between the per- formances of the first-level teams (efficient ones) and other ones is high. The efficiency average in Iranian league is less than the efficiency average in French League during 2004 to 2007 with the efficiency average of 0.93 [19], English Premier League with the efficiency average of 0.85 [11], and German Bundesliga with the efficiency average of 0.92 [15]; having said that, the above scores in other leagues have been obtained using different models and different efficiency criteria. Table 5. Value of obtained efficiency. Tea Score Ran Perspolis TEH0.819179 8 Foolad KHU 0.764021 10 Sepahan ESF 1 1 Esteghlal TEH 1 1 Shahin BUSH 1 1 Abumoslem MSH 1 1 Zobahan ESF 0.670614 14 Saba QOM 0.607351 15 Mes KRM 0.56504 17 Malavan ANZ 0.778423 9 Steelazin THE 1 1 Paas HMD 0.691093 13 Peykan GHZ 0.727029 11 Rahahan RAY 0.724115 12 Saipa KRJ 0.603627 16 Tirakhtor TAB 1 1 Moghavemat SHZ 1 1 Esteghlal AHV 0.509958 18 Copyright © 2011 SciRes. AJOR  70 J. SOLEIMANI-DAMANEH ET AL. The results indicated that while Abumoslem, Mogh- avemat, and Shahin achieved the efficiency score of 1, Moghavemat and Shahin were ranked 16 and 13, respec- tively, in the final ranking and Abumoslem due to its weak results has been relegated to the lower league (League 1). Concerning the results it should be pointed out that the efficiency score of these two football clubs does not reflect their achievement. What these efficiency scores actually denote is that these three clubs have fully exploited the available resources and regarding their available facilities produced acceptable outputs, so it will not be reasonable to expect more. During the period of investigation, Abumuslem Football Club, in spite of sub- stituting five coaches, was relegated to a lower league. Such high frequency in substituting several coaches in- dicates that the club managers have recognized the weakness in this area as the leading factor in the failure of the team and by frequent substitution of the coaching board of the club has tried to improve the conditions. However, with respect to the results of the study and the position of Abumoslem among the clubs with the effi- ciency score of 1, it is safe to say that this football club has completely took the advantage of the available re- courses and with respect these resources, one cannot ex- pect more from the coaches. The actual solution for these three clubs is more investment in recruiting players and coaches and effective management of the resources for achieving either financial or sportive success. In evalu- ating the performance of their coaches, the club manag- ers are also recommended to take the available resources into account so that their expectation of the caching board will be proportional to the club’s facilities. As the winner of the championship, Sepehan Football Club enjoys an acceptable efficiency ranking and was efficient. By studying the conditions of this club in two input indicators, some amazing results were obtained. In the ranking of the clubs on the basis of the wages paid to the coaches, this club was ranked the first. This club has paid their coaches twice more than the second club and 21 times more than the last club in this ranking. Likewise, in the part of the wages paid to the players, this club was also ranked the first. Having the great output and achiev- ing the highest score, this club has invested huge amounts of money in recruiting players and caches. The efficiency position of Sepahan, is due to the maximum value of its first outputs, regarding Theorem 4.3 in [1]. And, this team might not be efficient under other assumptions on the production technology. In fact, this team can be consid- ered a very big decision m aking unit in DEA analysis. Zobahan, as the second team in the final season table, obtained the 14th rank in our obtained ranking. It is due to its outputs related to revenue and spectators. In fact, this team was not successful from these two viewpoints. The TV rights in many countries constitute a large part of a club’s revenues. Accordingly, success or failure of clubs acts as a deciding factor in attracting TV channels to obtain the TV rights. Nevertheless, football league broadcast in Iran is confined to public TV networks and there is no market for purchasing the TV rights. With respect to the aforementioned points, it is safe to say that in Iran, a club’s championship by no means con- tribute to raise the fiscal revenues and a club’s invest- ment in recruiting players and coaches is no guarantee of championship which as a result of that the increased in- come offsets the costs. However, this should not be overlooked that championship can be a major factor in attracting spectators to the stadiums and accordingly by selling tickets increasing the club’s fiscal revenue. Be- cause of failure in attracting spectators, a club such as Zobahan has earned a little amount of income from sell- ing the tickets. From Table 5, it can be seen that 10th to 17th p ositions in the efficiency ranking are related to the governmental clubs which are dependent on industries such as car companies and steel production. This question might be posed here that despite of being apparently successful clubs what caused such clubs to be in the lower effi- ciency ranking? Considering the wages paid by these clubs, it is observed that these are among the most ex- travagant clubs with paying wages. For instance, in the ranking of the clubs on the basis of the wages paid to players, four of these clubs is ranked in first till seventh. The same story also appears in the wages paid to coaches. Regarding these results, it is argued that by accessing the rich state recourses, these clubs have invested huge amounts of money in players and coaches in order to reach sportive achievements. At the end, some of these clubs have achieved success while the others have not. As it was mentioned, however, th ese club s do not en jo y a promising efficiency score. It is to be noted that in order to achieve efficiency, sportive achievement is not enough and those clubs are efficient which are successful in both financial and sportive domain [12]. The too much wages paid to players and coaches has been, in fact, one of the major factors in the inefficiency of these c lubs . In Fr en ch Leagues [19], American Leagues, and German Leagues [15] too much wages paid to players and coaches has also been identified as one of the inefficiency factors. Furthermore, the infinite availability of state resources for these clubs and, as a result, making no attempt to attract other fiscal revenues has been the other factors in the inefficiency of these clubs. With respect to the low efficiency scores of govern- mental clubs and also low average score in efficiency, it seems that the privatization of the clubs and incorporat- ing them into the stock market can be proposed as gen- Copyright © 2011 SciRes. AJOR  J. SOLEIMANI-DAMANEH ET AL. 71 eral strategies to improve efficiency in Iranian Football League. In the early 90s in England, due to increased club owning expenditures (particularly player wages), privatization of clubs was introduced as an effective strategy to achieve both financial and sportive success which proved to have desirable outcomes [31]. What happens in privatization is cutting the level of state sub- sidies. By doing so, the sport clubs should act as finan- cial corporations, which in such conditions income- earning is a fundamental strategy to survive. In other words, the corollary of privatization will be cutting the expenditures, an increase in incomes and consequently club’s efficiency improvement. In sequel, Pearson Test was used to determine the re- lationship between some of the variables. The results of the test showed that at a significance level of 0.05, there was no significant relationship between the clubs’s ranking in the Efficiency Table and its ranking in the Champion League Table. These results denote that de- spite of spectators’ belief, the club with the highest scores is not the best club of the league. This means that there is no relationship between the degree sportive suc- cess of a club and the degree of its efficiency and the champion of the league is not necessarily the most effi- cient club. These results are consistent with the results of Barros et al. [12] in Brazilian Football League, Jardin [19] in France football League, Haas [15] in English Football Premier League, Haas and Kocher [15] in Ger- man Football League. The results were, however, incon- sistent with the results of Barros and Leach [7]. The results of Pearson Test demonstrated that at a sig- nificance level of 0.05, there is a relationship between the efficiency degree of the clubs and the population of the host city. It means that the clubs in the over popu- lated cities have less efficiency compared with clubs from small cities with less population density. The re- sults of this part of the study are inconsistent with the results of Barros et al [12] in Brazil. However, Jardin [19] reported similar results in France. Furthermore, the results of the Pearson Test demon- strated that there is a significant relationship between the efficiency degree of the clubs and the amount of the wages paid to players and coaches. In other words, there is no significant relationship between the degree of spor- tive achievement and the amount of expenditure on re- cruiting coaches and players. These results are similar to the results of Kern and Sussm uth [32] in Ger m an League. 4. Conclusions In this paper, we used a hybrid approach, consisting of DEA and AHP, for analyzing the performance of Iranian football primer league team. DEA models have been util- ized for obtaining the efficiency scores. AHP helped us for obtaining the output factors and also to obtain some weight restrictions for imposing to DEA models. The results of the study, demonstrated that in 2009-10 season, seven teams (i.e. 39%) were efficient. Sepahan, Esteghlal, Shahin, Abumoslem, Tirakhtor, Moghavemat and Stee- lazin possessed the efficiency score of 1 and Esteqlal- e-Ahvaz had the lowest score with efficiency score of 0.51. The average of the efficiency scores is 0.80 and 45% of the teams has a score more than this average. Although the average of the scores is approximately good (though it is not fabulous), there is only one ineffi- cient team (Persplois) having a score more than this av- erage. The results of the Pearson Test showed there was no significant relationship between the team’s ranking in the efficiency Table and its ranking in the Champion League Table, however, there is a significant relationship between the efficiency degree of the clubs and the amount of wages paid to players and coaches and between the efficiency degree of the clubs and the population of the host city. Generally speaking, the deciding factor in inef- ficiency of Iranian football clubs is attributed to the too much wages paid to players and coaches. On the other hand, the government-owning of most of the clubs and ineffective management and as a result low profitability of the clubs can be considered as one of the causes of inefficiency. In general, regarding low average score in efficiency of clubs in Iranian Football Primer League, particularly the government-own clubs, privatization of clubs is proposed as an effective strategy to increase effi- ciency in Iranian Football Primer League clubs. 5. References [1] W. W. Cooper, L. M. Sieford and K. Tone, “Data Envel- opment Analysis: A Comprehensive Text with Models, Applications, References and DEA Solver Software,” Kluwer Academic Publishers, Norwell, 2000. [2] E. Thanassoulis, “Introduction to the Theory and Appli- cation of Data Envelopment Analysis,” Kluwer Academic Publishers, Norwell, 2001. [3] A. Charnes, W. W. Cooper and E. Rhodes, “Measuring the Efficiency of Decision Making Units,” European Journal of Operational Research, Vol. 2, No. 6, 1978, pp. 429-444. doi:10.1016/0377-2217(78)90138-8 [4] R. D. Banker, A. Charnes and W. W. Cooper, “Some Models For Estimating Technical and Scale Efficiencies in Data Envelopment Analysis,” Management Science, Vol. 30, No. 9, 1984, pp. 1078-1092. doi:10.1287/mnsc.30.9.1078 [5] A. Emrouznejad, B. R. Parker and G. Tavares, “Evalua- tion of Research in Efficiency and Productivity: A Survey and Analysis of the First 30 Years of Scholarly Literature in DEA,” Socio-Economic Planning Sciences, Vol. 42, No. 3, 2008, pp. 151-157. Copyright © 2011 SciRes. AJOR  J. SOLEIMANI-DAMANEH ET AL. Copyright © 2011 SciRes. AJOR 72 doi:10.1016/j.seps.2007.07.002 [6] P. Dawson, and S. Dobson, “Managerial Efficiency and Human Capital: An Application to English Association Football,” Managerial and Decision Economics, Vol. 23, No. 8, 2002, pp. 471-486. doi:10.1002/mde.1098 [7] C. P. Barros and S. Leach, “Performance Evaluation of the English Premier Football League with Data Envel- opment Analysis,” Applied Economics, Vol. 38, No. 12, 2006, pp. 1449-1458. doi:10.1080/00036840500396574 [8] C. P. Barros and Garcia-del-Barrio, “Efficiency Meas- urement of the English Football Premier League with a Random Frontier Model,” Economic Modelling, Vol. 25, No. 5, 2008, pp. 994-1002. doi:10.1016/j.econmod.2008.01.004 [9] C. P. Barros and S. Leach, “Analyzing the Performance of the English F. A. Premier League with an Econometric Frontier Model,” Journal of Sports Economics, Vol. 7, No. 4, 2006, pp. 391-407. doi:10.1177/1527002505276715 [10] C. P. Barros and S. Leach, “Technical Efficiency in the English Football Association Premier League with a Sto- chastic Cost Frontier,” Applied Economics Letters, Vol. 14, No. 10, 2007, pp. 731-741. doi:10.1080/13504850600592440 [11] Guzman and S. Morrow, “Measuring Efficiency and Productivity in Professional Football Teams: Evidence from the English Premier League,” Central European Journal of Operations Research, Vol. 15, No. 4, 2007, pp. 309-328. doi:10.1007/s10100-007-0034-y [12] C. P Barros, A. Assaf and F. Sa-Earp, “Brazilian Football League Technical Efficiency: A Bootstrap Approach,” School of Economics and Management, 2009, Working paper. [13] G. M. Caloba and M. P. Lins, “Performance Assessment of the Soccer Teams in Brazil Using DEA,” Pesquisa Operacional, Vol. 26, No. 3, 2006, pp. 521-536. [14] T. Tiedemann and T. Francksen, “Assessing the per- formance of German Bundesliga Football Players: An On-Parametric Meta Frontier Approach,” Unpublished. doi:10.1590/S0101-74382006000300005 [15] D. J. Haas, M. G. Kocher and M. Sutter, “Measuring efficiency of German football Teams by Data Envelop- ment Analysis,” Central European Journal of Operations Research and Economics, Vol. 12, No. 3, 2004, pp. 251-268. [16] M. E. Escuer and L. I. G. Cebrian, “Measurement of the Efficiency of Football Teams in the Champions League,” Journal Managerial and Decision Economics, Vol. 31, No. 6, 2010, pp. 373-386. doi:10.1002/mde.1491 [17] I. Guzman, “Measuring Efficiency and Sustainable Growth in Spanish Football Teams,” European Sport Management Quarterly, Vol. 6, No. 3, 2006, pp. 267-287. doi:10.1080/16184740601095040 [18] G. Gomez and A. J. Tadeo, “Can We be Satisfied with Our Football Team? Evidence from Spanish Professional Football,” Journal of Sports Economics, Vol. 11, No. 4, 2010, pp. 418-442. doi:10.1177/1527002509341020 [19] M. Jardin, “Efficiency of French Football Clubs and Its Dynamic s,” University of Rennes 1, CREM (UMR CNRS 6211), MPRA, Vol. 23, No. 19828, 2009. [20] J. Douvis and C. P. Barros, “Comparative Analysis of Football Efficiency among Two Small European Coun- tries: Portugal and Greece,” International Journal of Sport Management and Marketing, Vol. 6, No. 2, 2009, pp. 183-199. doi:10.1504/IJSMM.2009.028801 [21] J. E. Bosca, V. Liern, A. Martinez and R. Sala, “Increas- ing Offensive or Defensive Efficiency? An Analysis of Italian and Spanish Football,” Omega, Vol. 37, No. 1, 2009, pp. 63-78. doi:10.1016/j.omega.2006.08.002 [22] Y. H. Lee, “Evaluating Management Efficiency of Korean Professional Teams Using Data Envelopment Analysis (DEA),” International Journal of Applied Sports Sciences, Vol. 21, No. 2, 2009, pp. 93-112. [23] Ch. Papahristodoulou, “Team Performance in UEFA Champions League,” June 2005. http://mpra.ub.uni-muen-chen.de/138/ [24] T. L. Saaty, “The Fundamentals of Decision Making and Priority Theory with the Analytic Hierarchy Process,” RWS Publications, New York, 2000. [25] B. E. Fad, “Analytical Hierarchy Process (AHP) Ap- proach to Size Estimation,” Unpublished. [26] J. Soleimani-damaneh, M. Soleimani-damaneh and M. Hamidi, “Efficiency Analysis of Provincial Departments of Physical Education in Iran,” Submitted. [27] G. R. Jahanshahloo and M. Soleimani-damaneh. “A Note on Simulating Weights Restrictions in DEA: An Im- provement of Thanassoulis and Allen’s Method,” Com- puters and Operations Research, Vol. 32, No. 4, 2005, pp. 1037-1044. doi:10.1016/j.cor.2003.08.020 [28] http://www.ffiri.ir.2010. [29] S. Szymanski and T. Kuypers, “Winners and Losers: The Business Strategy of Football,” 1999, Unpublished. [30] S. Szymanski and R. Smith, “The English Football In- dustry: Profit, Performance and Industrial Structure,” In- ternational Review of Applied Economics, Vol. 11, No. 1, 1997, pp. 135-154. [31] S. Hamil, J. Michie, Ch. Oughton and L. Shailer, “The State of the Game: The Corporate Governance of Foot- ball Clubs,” New Academy Review, Vol. 1, No. 1, 2002, pp. 179-192. [32] M. Kern and B. Sussmuth, “Managerial Efficiency in German Top League Soccer: An Econometric Analysis of Club Performances on and off the Pitch,” German Eco- nomic Review, Vol. 6, No. 4, 2005, pp. 485-506. doi:10.1111/j.1468-0475.2005.00143.x
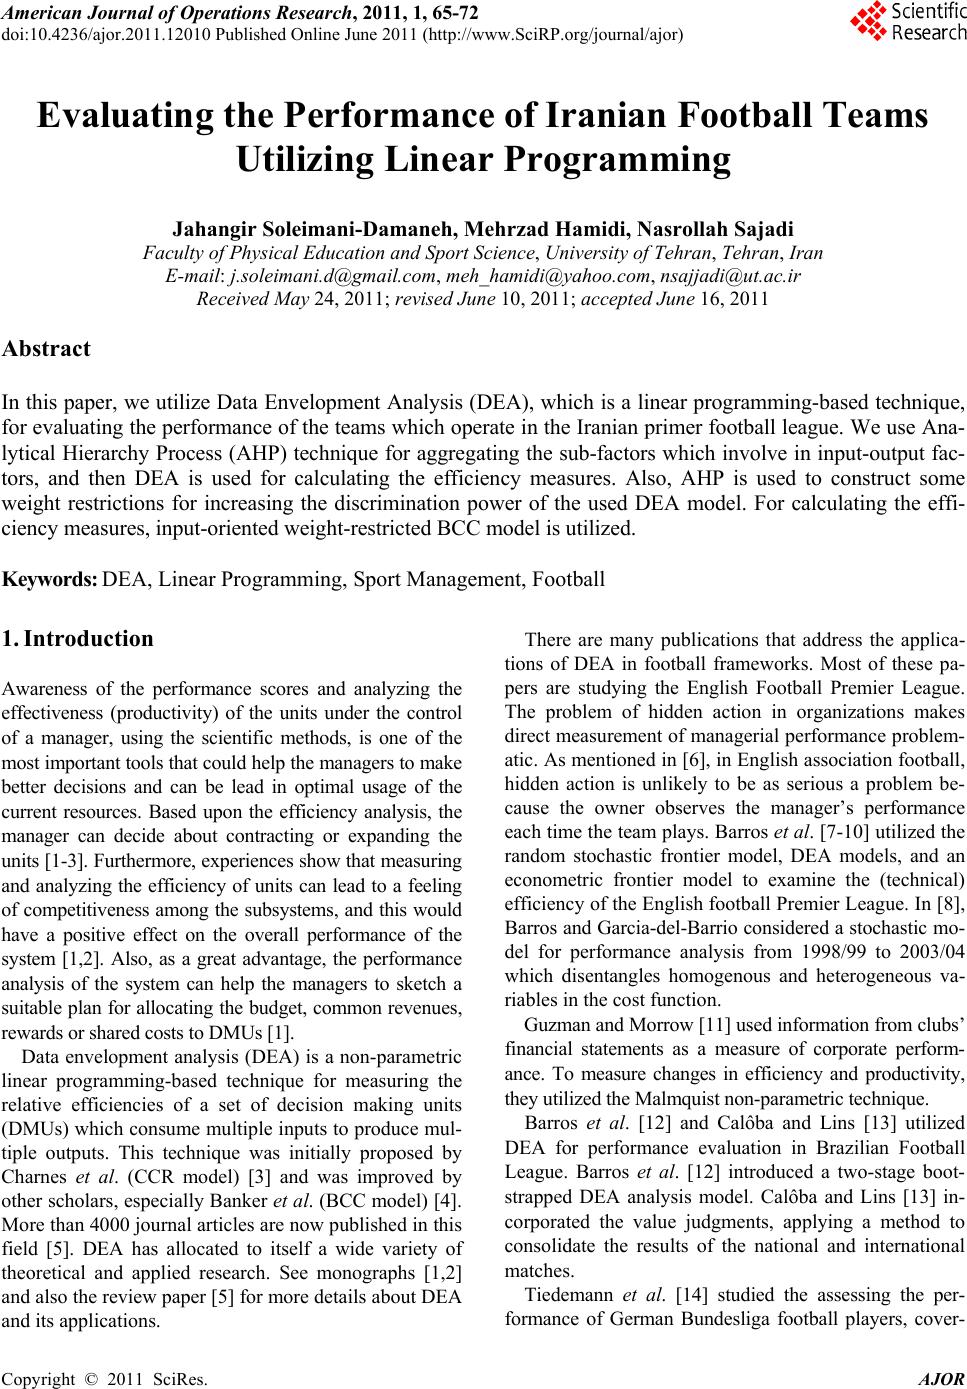
|