Distribution Behaviour of Dimethoate in Tea Leaf
484
membrane teflon filters (0.45 µm particle size) before
injection into the chromatographic column.
3. Standard Calibration Curve
Standard curve was prepared by diluting the stock solu-
tion to five different concentrations in acetone. The col-
umn was conditioned by repeated injections (3 times) of
the standard under constant operating conditions until the
peaks obtained were reproducible. Dimethoate was injected
at 0.2, 0.5, 1.0, 5.0 and 10.0 mg/l to validate the method.
Recovery Assay
Before laying the experiments in the field, recovery
studies were performed at 50.0 mg/l fortification level of
active ingredient (three replicates) of each matrix (green
leaves, dried leaves and soil). These samples were pre-
pared by adding known amount of standard in matrix
before extraction. The extraction was carried out as de-
scribed below in section The duplicate injections of each
extract were made in Gas Chromatograph (GC-NPD).
4. Extraction of Pesticide from Leaf Surface
Extraction of dimethoate was done with Chloroform (re-
covery > 90%) The extract was agitated mechanically
with acetonitrile for 3 hours on a horizontal shaker. The
mixture was filtered through Whatman no.1 filter paper
and the cake was washed twice with 20 ml solvent each
time. The combined water extract was partitioned with
150ml of acetonitrile twice in a 500 ml separating funnel.
Discarding the aqueous layer, the organic layer was con-
centrated to near dryness on a water bath and reconsti-
tuted with 1 ml of acetone for final analysis. The effect
of washing was thus confirmed by laboratory washing
and in case of samples collected from the treated fields in
dry and wet seasons, the residue was extracted in dichloro-
methane. The final eluate was evaporated to near dryness and the
residue was reconstituted with 1ml acetone for quantification.
4.1. Extraction of Pesticide from Epicuticular
Wax
Epicuticular wax extraction was done using the method
described by Mc. Donald et al. [12]. After thorough
washing to remove the surface pesticides, the tea leaves
were soaked in 100 ml of chloroform and shaken on an
automatic horizontal shaker for 1 minute. Extract was
filtered through Whatman No.1 filter paper and concen-
trated to 5 ml followed by passing through an adsorbent
column containing florisil topped with 1 cm of anhy-
drous sodium sulphate prewashed with chloroform. The
extract was eluted with 200 ml of chloroform, concen-
trated on a vacuum rotatory evaporator using a water
bath at 35˚C - 40˚C. The residue was finally reconstituted
with 1ml of acetone and quantified by GC (NPD).
4.2. Extraction of Pesticide from Cell Wall
Extraction of dimethoate was done by soaking the tea
leaves in 100 ml of chloroform and shaken on an auto-
matic horizontal shaker for 1 minute. Extract was filtered
through Whatman No.1 filter paper and concentrated to 5
ml followed by passing through an adsorbent column
containing florisil topped with 1 cm of anhydrous sodium
sulphate prewashed with chloroform. The extract was
eluted with 200 ml of chloroform, concentrated on a
vacuum rotatory evaporator using a water bath at 35˚C -
40˚C. The extract was finally eluted with dichloro-
methane (200 ml) from the florisil column. The eluate
was evaporated to dryness and reconstituted to 1 ml in
acetone and 2 µl of it was analysed by GC (NPD).
5. Detection and Quantification
Detection limit test
To determine the limit of detection made tea samples
were spiked with different concentration levels of di-
methoate standard and analysed by GC (NPD). The de-
tection limit was evaluated by the peak signal/noise (S/N)
ratio. An S/N ratio greater than 3 was considered as a
detectable peak.
6. Results and Discussion
6.1. Quantification
The GC analytical conditions were optimized in terms of
temperature program that allowed an improvement of the
time and the chromatographic run resolution. Moreover
to avoid the cross contamination between high and low
spiked samples, the sequence of injections was in the
following order: solvent, blank sample, sprayed samples
and finally standard solution. No interfering peaks were
present during the analysis of any samples as before each
run the solvent was injected.
Moreover, the adopted oven programming allowed a
good chromatographic separation of dimethoate. The total
run time was 14 minutes and the retention time of the
dimethoate in the given chromatographic conditions was
8.68 minutes and constant for each series of samples.
Chromatographic separation by HP-17 column provided
good results for the quantification of the samples.
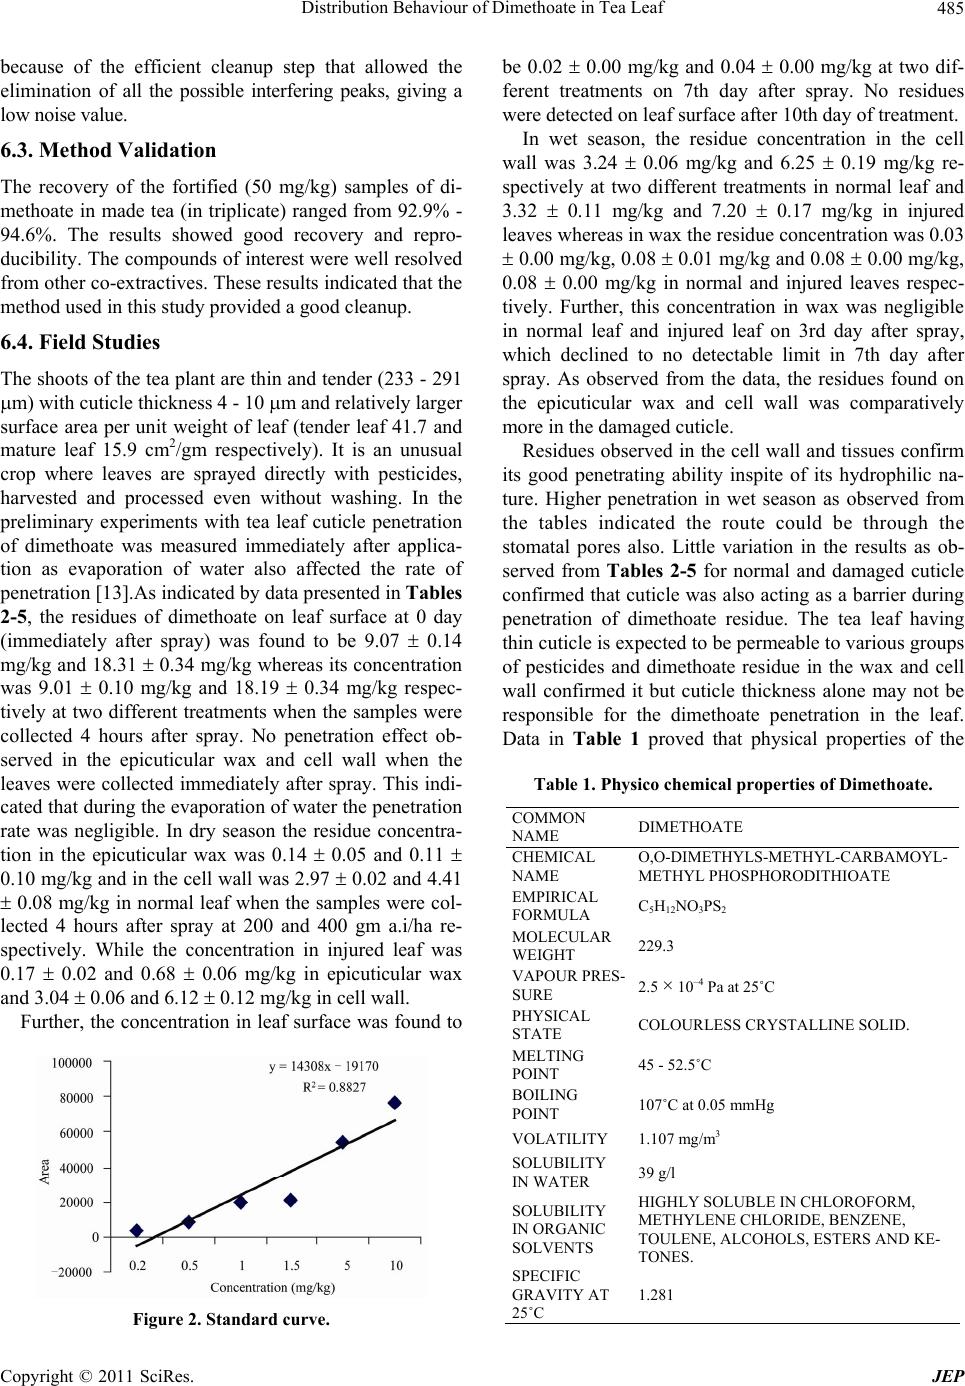
6.2. Linearity
The calibration curve of the analysed dimethoate gave a
good regression line (R2 = 0.8827) in the range of ex-
plored concentrations, 0.1 - 10.0 mg/l. The detection
limit of dimethoate was taken to be 0.01 mg/kg, which
were much lower than the maximum residue limits fixed
by European Commision for dimethoate in tea (0.2
mg/kg). Residues below 0.01 mg/kg were detected but
not quantified. This low detection limit was achieved
Copyright © 2011 SciRes. JEP