Paper Menu >>
Journal Menu >>
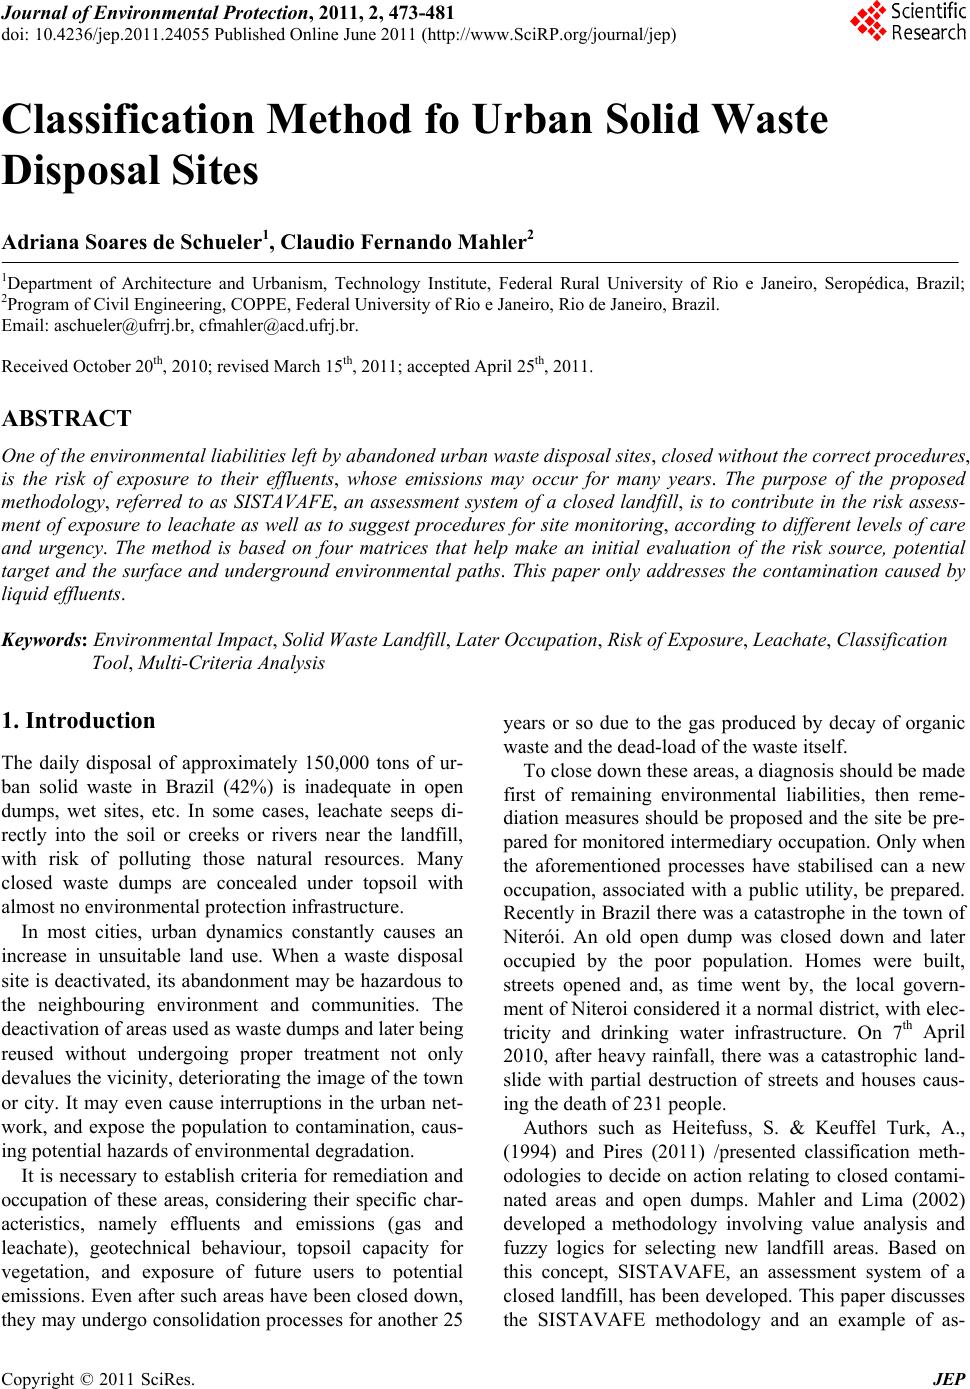 Journal of Environmental Protection, 2011, 2, 473-481 doi: 10.4236/jep.2011.24055 Published Online June 2011 (http://www.SciRP.org/journal/jep) Copyright © 2011 SciRes. JEP 473 Classification Method fo Urban Solid Waste Disposal Sites Adriana Soares de Schueler1, Claudio Fernando Mahler2 1Department of Architecture and Urbanism, Technology Institute, Federal Rural University of Rio e Janeiro, Seropédica, Brazil; 2Program of Civil Engineering, COPPE, Federal University of Rio e Janeiro, Rio de Janeiro, Brazil. Email: aschueler@ufrrj.br, cfmahler@acd.ufrj.br. Received October 20th, 2010; revised March 15th, 2011; accepted April 25th, 2011. ABSTRACT One of the environmental liabilit ies left b y a band on ed urban wa ste disposal sites , closed without the correct procedures, is the risk of exposure to their effluents, whose emissions may occur for many years. The purpose of the proposed methodology, referred to as SISTAVAFE, an assessment system of a closed landfill, is to contribute in the risk assess- ment of exposure to leachate as well as to suggest procedures for site monitoring, according to different levels of care and urgency. The method is based on four matrices that help make an initial evaluation of the risk source, potential target and the surface and underground environmental paths. This paper only addresses the contamination caused by liquid efflu ents. Keywords: Environmental Imp act, Solid Waste Landfill, Later Occupation, Risk of Exposure, Leachate, Classification Tool, Multi-Criteria Analysis 1. Introduction The daily disposal of approximately 150,000 tons of ur- ban solid waste in Brazil (42%) is inadequate in open dumps, wet sites, etc. In some cases, leachate seeps di- rectly into the soil or creeks or rivers near the landfill, with risk of polluting those natural resources. Many closed waste dumps are concealed under topsoil with almost no environmental protection infrastructure. In most cities, urban dynamics constantly causes an increase in unsuitable land use. When a waste disposal site is deactivated, its abandonment may be hazardous to the neighbouring environment and communities. The deactivation of areas used as waste dumps and later being reused without undergoing proper treatment not only devalues the vicinity, deteriorating the image of the town or city. It may even cause interruptions in the urban net- work, and expose the population to contamination, caus- ing potential hazards of environmental degradation. It is necessary to establish criteria for remediation and occupation of these areas, considering their specific char- acteristics, namely effluents and emissions (gas and leachate), geotechnical behaviour, topsoil capacity for vegetation, and exposure of future users to potential emissions. Even after such areas have been closed down, they may undergo consolidation processes for another 25 years or so due to the gas produced by decay of organic waste and the dead-load of the waste itself. To close down these areas, a diagnosis should be made first of remaining environmental liabilities, then reme- diation measures should be proposed and the site be pre- pared for monitored intermediary occupation. Only when the aforementioned processes have stabilised can a new occupation, associated with a public utility, be prepared. Recently in Brazil there was a catastrophe in the town of Niterói. An old open dump was closed down and later occupied by the poor population. Homes were built, streets opened and, as time went by, the local govern- ment of Niteroi considered it a normal district, with elec- tricity and drinking water infrastructure. On 7th April 2010, after heavy rainfall, there was a catastrophic land- slide with partial destruction of streets and houses caus- ing the deat h of 231 people. Authors such as Heitefuss, S. & Keuffel Turk, A., (1994) and Pires (2011) /presented classification meth- odologies to decide on action relating to closed contami- nated areas and open dumps. Mahler and Lima (2002) developed a methodology involving value analysis and fuzzy logics for selecting new landfill areas. Based on this concept, SISTAVAFE, an assessment system of a closed landfill, has been developed. Th is paper discusses the SISTAVAFE methodology and an example of as-  Classification Method fo Urban Solid Waste Disposal Sites 474 sessment and classification of closed landfills, consider- ing the risk of leachate reaching the population and/or natural resources, using the source-pathway-receptor approach developed herein. The aim was to provide the public administration with scientific tools for defining priority investments in environmental recovery of the old contaminated areas and waste disposal sites. 2. Methodology 2.1. Risk Ogura (1995) includes a sequence of activities o f preven- tion and preparation, in-line approach to the Disaster Mitigation Programme of UNDRO. These activities listed below can be considered elements of a risk management system: Hazard Assessment; Risk Analysis Disaster Prevention Measures; Emergency Planning Public Information and Training The firs t three steps relate to preventiv e action and the last two stages with regard to preparation. The identification and risk assessment steps aimed to take appropriate measures for elimination or reduction of risk situations. These steps depend on an accurate under- standing of the processes of generating mass movements. Ogura (1995) points out that the geological hazard as- Figure 1. Landslide in Morro do Bumba, Niterói, Brazil (source: www .ambie ncia.org) sessment (mass movements) begins by identifying and characterising the phenomenological type of geological process. Risks can be assessed in cases of specific or general risks. Also in the stages of identification and risk assessment, areas are located where mass movements may occur (risk areas) in order to establish the conditions and circum- stances of the occurrence of the processes (temporal resolution). Therefore, risk assessment helps locate, di- agnose, categorize and map the risk status. Fell (1994) and Fell & Hartford (1997) present a risk management system applied to mass movements on slopes, consisting of a sequence of three basic steps: Hazard Assessment; Risk Analysis Actual Risk Assessment According to this view risk management receives the information from the risk assessment and takes risk man- agement action from decision making and risk monitor- ing. Risk means a measure of the probability of a mass movement and intensity of adverse consequences for hu- man health, property or the environment. Risk is usually estimated by the product of the prob- ability of the consequences. However, there are more general interpretations o f th e co nc ept of risk co mparisons involving probabilities and consequences of different forms of material between them. Keaton & Eckhoff (1989) define risk as the exposure of something of value to a risk situation. According to Einstein (1997) risk can be set using the following ana- lytical expression: R = d·u(X) (1) where: R - Risk; d - probability of danger, if the mass movement; u(X) - is a utility function that expresses the costs of the consequences, which are the basis of these attribute vector X, which relates the consequences as the loss of lives, destruction of homes, housing the homeless, etc. Ogura (1995) considers the product of risk probability /frequency of occurrence of a phenomenon of mass movement for the associated socio economic losses. Keaton & Eckhoff (1989) define risk as something to expose a dangerous situation. In this definition the Eng- lish words “danger” and “hazard” are used as synony- mous. Public Policy” (1992) who defines risk as a function of two major factors: the probability that an event or series of events occurring and the consequence of these events and UNDRO-Office of the United Nations Disasters Re- lief Coordinator “(1979) defines risk as to the meaning of Copyright © 2011 SciRes. JEP  Classification Method fo Urban Solid Waste Disposal Sites475 alleged number of lives lost, people injured, property damage and intervention in economic activity due to a particular phenomenon. Proceeds from the Specific Risk “and” Elements at Risk.” For a risk characterisation, a source—the waste land- fill—and receptor—people and natural resources—are required. In a risk assessment the danger, exposure, as- sessment and its management should be identified. The question of exposure assessment in this case consists first of: Quality identification of leachate volume potentially produced in a waste landfill; Identification of the environmental pathways the leachate may follow until it reaches people or natural resources; Identification of the mobility of the leachate, which may affect the population and natural resources be- yond the bound ary of the waste disposal site In this paper Risk is defined as the probability of oc- currence of contamination caused by the leachate pro- duced in the closed land fill. It was considered that a sim- ple methodology of analyses of the different contamina- tion possibilities could be an important tool to help the public administration to treat the question of contami- nated areas. The proposed methodology, SISTAVAFE involves establishing four matrices that together help guide each phase of the risks assessment of exposure of the leachate contamination to people and natural resources. The result of the assessment will point to different levels of care in relation to the procedures to be taken on its closure and subsequent monitoring. The following pa- rameters refer to: Contaminant source: Potential volume of leachate produced, which is influenced by the volume of waste landfill and the age of the last waste disposal. These are presented in the matrix 1; Pathways that the leachate may follow: They may be surface or subsurface. Subsurface pathways are basically influenced by soil permeability and the thickness of the vadoze zone (the zone over the gr oundwater level). Surface pathways are influenced by topography and morphology of the site, which may give rise to natural ponds, natural drainage and run-off. When ponds are created, the stagnated leachate tends to evaporate or seep in to contaminate the air and soil. When there is runoff, depending on the gradient, erosion may be caused by the impact of the liquid over the soil, with the risk of dam- aging the top layer of the landfill, which is generally poorly built and covers large distances. Both situations can be attenuated depend ing on its position in relation of the landfill. When the local water balance is negative, which means that the volume of precipitated water is less than the volume of evaporation (due to dry climate or presence of vegetation), the leachate produced by the waste landfill consists only of the n atural moisture of the waste and of sub-products from the aerobic decay of or- ganic waste mat t e r. Subject of potential exposure: Human beings or ani- mals living near the land fill, and natural resources; The limit values used in the matrices were based on a two-year monitoring of the landfill studied (Schueler, 2005) and in value an alysis methodo logy by interv iewing ten different specialists. The purpose of the proposed assessment system is to help identify the environmental liabilities left by solid waste disposal activities on a site and to establish proce- dures for its reintegration in a suitable urban context. Th e assessment is based on data collection guided by indica- tors of potential environmental and human health h azards. It should emphasise the use of existing data as far as pos- sible, unless information is available for indicating the need for further detailed inv estigation. The co llected data corresponds to specific points in the matrices, which provide results classified in accordance with the potential risk of leachate production, transportation and distance in a landfill. The result of the assessment will indicate the different levels of care in relation to the procedures to be taken on its closure and subsequent monitoring. 3. Assessment Matrix Tables 1, 2, 3, 4 present the matrices built to specify the source, pathways and exposure of subj ects. 3.1. Source 3.1.1. Waste Leachate Production Assessment Source leachate production is controlled by biological decay of the waste. Although the divisions in stages in which the waste is being stabilised do not have strict time limits, three main ranges are considered: Five years or less: The pollutants carried in the leachate generally reach maximum values in the first years of landfill operation (2 - 3 years) and gradually decrease during the subsequent years. This tendency can be gener- ally applied to dissolved organic matter and principal inorganic ions (heavy metals, chloride, sulphate, etc.). (IPT/Cempre, 2000, and Andreotolla et al., 1997). Five to thirty years: The speed of waste decay after reaching its maximum continues to slowly decline for 25 years or so (Tchobanoglous et al., 1993). These figures were obtained from gas measurements, where there is a relation with leachate production. Over 30 years: At this age, it is no longer expected to produce a significant amount of gas, indicating that the stabilisation process of the waste is considerably ad- Copyright © 2011 SciRes. JEP  Classification Method fo Urban Solid Waste Disposal Sites Copyright © 2011 SciRes. JEP 476 vanced, thereby reducing leachate production. 3.2. Pathway 3.2.1. Assessment of Subsurf ace Pat hw a y by Evaluating Landfill Base and Risk of Reach the Groundwater Five ranges of values for soil permeability (K) are being considered. For permeability the maximum value of 10 –3 cm/s was adopted and low permeability is considered when it is more than 10–6 cm/s. Three medium intervals limited by the values, 10–3 and 10–6 cm/s are being con- sidered. 3.2.2. Assessment of Surface Pathways, Local Geomorphology and Rainfall Table 3 provides the matrix for assessing surface hy- drology. This matrix relates to the dynamics of surface hydrology—capacity for flooding or surface runoff, which includes water balance—and its location in rela- tion to the landfill. Its purpose is to rate the natural drainage capacity of leachate and surface runoff water. Topographic information, consisting of geomorphologic compartmentalization, characteristics of the units com- prising relief, land slope and main processes acting on the region, such as erosion, landslide, flooding, and so on, Table 1. Matrix 1 - for source assessment (leachate production). Waste Landfill Assessment: Time since the last disposal at the landfill (years) Volume of waste m3 Less than 6 6 to 12 12 to 18 18 to 24 24 to 30 or more Over 100,000 21 22 23 24 25 60,000 to 80,000 16 17 18 19 20 40,000 to 60,000 11 12 13 14 15 20,000 to 40,000 6 7 8 9 10 Less than 20,000 1 2 3 4 5 Table 2. Matrix 2 - for assessment of landfill base. Soil thickness unti l the ground water level (m) Soil permeability cm/s Until 1 1 to 2 2 to 3 3 to 4 4 to 5 Less than 10-3 21 22 23 24 25 10-3 > k > 10-4 16 17 18 19 20 10-4 > k > 10-5 11 12 13 14 15 10-5 > k > 10-6 6 7 8 9 10 More than 10-6 1 2 3 4 5 Table 3. Matrix 3 - for surface pathway assessment (topography and water balance). Region characteristic Region subject to high-energy surface runoff Floodable region Water Balance Downstream from landfill Upstream from landfill Upstream from land- fill Downstream from landfill On landfill Positive all the year 21 22 23 24 25 Positive 9 mon ths/year 16 17 18 19 20 Positive 6 mon ths/year 11 12 13 14 15 Positive 3 mon ths/year 6 7 8 9 10 Negative all the year 1 2 3 4 5 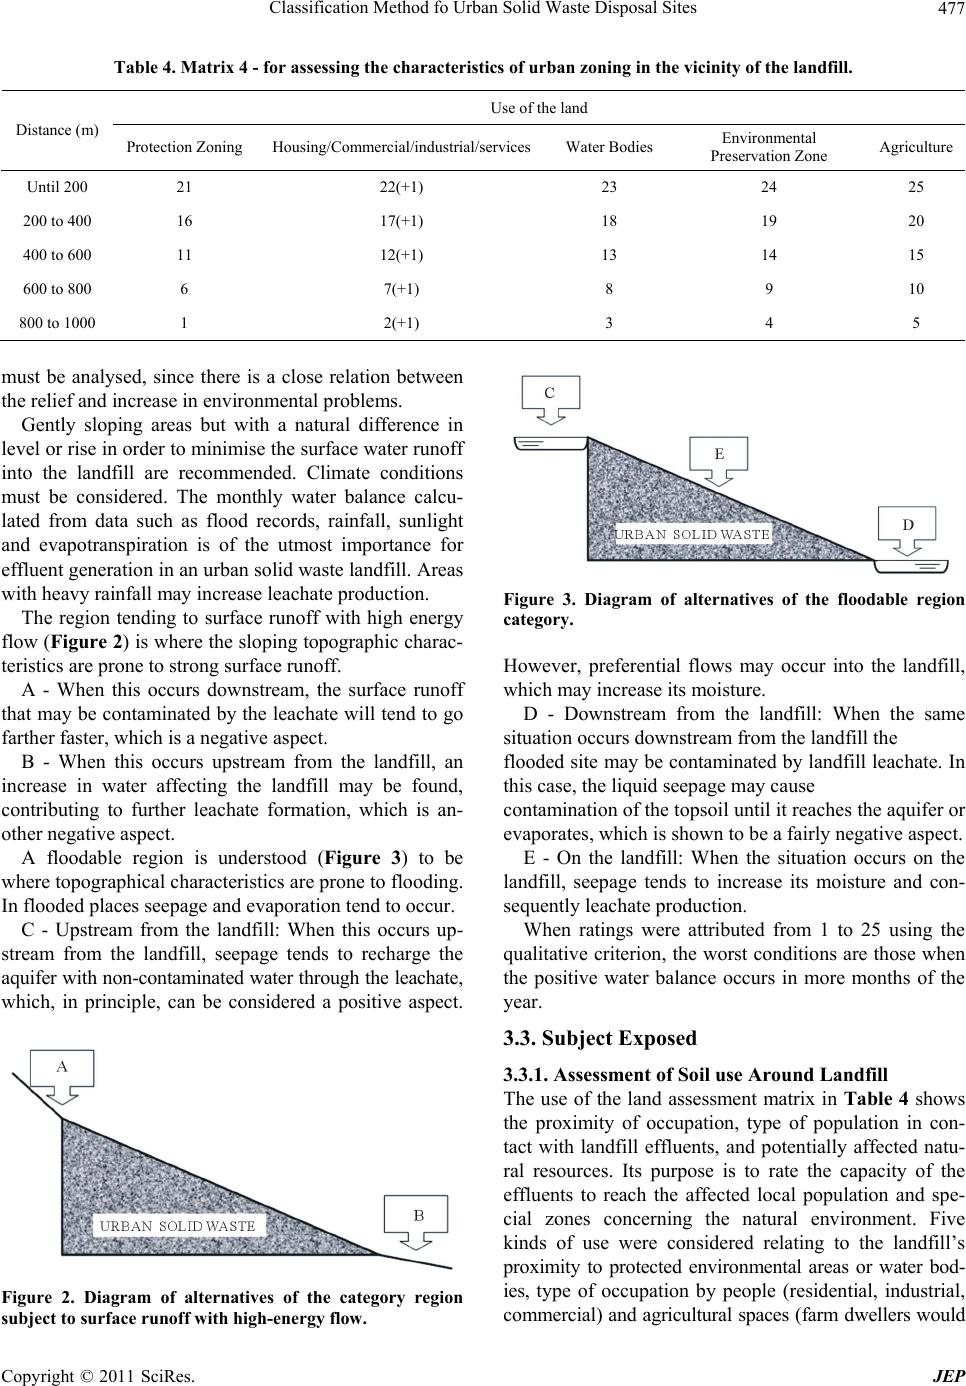 Classification Method fo Urban Solid Waste Disposal Sites477 Table 4. Matrix 4 - for assessing the characteristics of urban zoning in the vicinity of the landfill. Use of the land Distance (m) Protection Zoni ngHousing/Commercial/industrial/services Water Bodies Environmental Preservation Zone Agriculture Until 200 21 22(+1) 23 24 25 200 to 400 16 17(+1) 18 19 20 400 to 600 11 12(+1) 13 14 15 600 to 800 6 7(+1) 8 9 10 800 to 1000 1 2(+1) 3 4 5 must be analysed, since there is a close relation between the relief and increase in environmental proble ms. Gently sloping areas but with a natural difference in level or rise in order to minimise the surface water runoff into the landfill are recommended. Climate conditions must be considered. The monthly water balance calcu- lated from data such as flood records, rainfall, sunlight and evapotranspiration is of the utmost importance for effluent generation in an urban solid waste landfill. Areas with heavy rainfall may increase leachate production. The region tending to surface runoff with high energy flow (Figure 2) is where th e sloping topogra phic char ac- teristics are prone to strong surface runoff. A - When this occurs downstream, the surface runoff that may be contaminated by the leachate will tend to go farther faster, which is a negative aspect. B - When this occurs upstream from the landfill, an increase in water affecting the landfill may be found, contributing to further leachate formation, which is an- other negative aspect . A floodable region is understood (Figure 3) to be where topographical characteristics are prone to flooding. In flooded places seepage and evaporation tend to occur. C - Upstream from the landfill: When this occurs up- stream from the landfill, seepage tends to recharge the aquifer with non-contaminated water through the leachate, which, in principle, can be considered a positive aspect. Figure 2. Diagram of alternatives of the category region subject to surface runoff with high-energy flow. Figure 3. Diagram of alternatives of the floodable region category. However, preferential flows may occur into the landfill, which may increase its moisture. D - Downstream from the landfill: When the same situation occurs downstream from the landfill the flooded site may be contaminated by landfill leachate. In this case, the liquid seepage may cause contamination of the topsoil until it reaches the aquifer or evaporates, which is shown to be a fairly negative aspect. E - On the landfill: When the situation occurs on the landfill, seepage tends to increase its moisture and con- sequently leachate production. When ratings were attributed from 1 to 25 using the qualitative criterion, the worst conditions are those when the positive water balance occurs in more months of the year. 3.3. Subject Exposed 3.3.1. Assessment of So il use Around Landfill The use of the land assessment matrix in Table 4 shows the proximity of occupation, type of population in con- tact with landfill effluents, and potentially affected natu- ral resources. Its purpose is to rate the capacity of the effluents to reach the affected local population and spe- cial zones concerning the natural environment. Five kinds of use were considered relating to the landfill’s proximity to protected environmental areas or water bod- ies, type of occupation by people (residential, industrial, commercial) and agricultura l spaces (farm dwellers would Copyright © 2011 SciRes. JEP 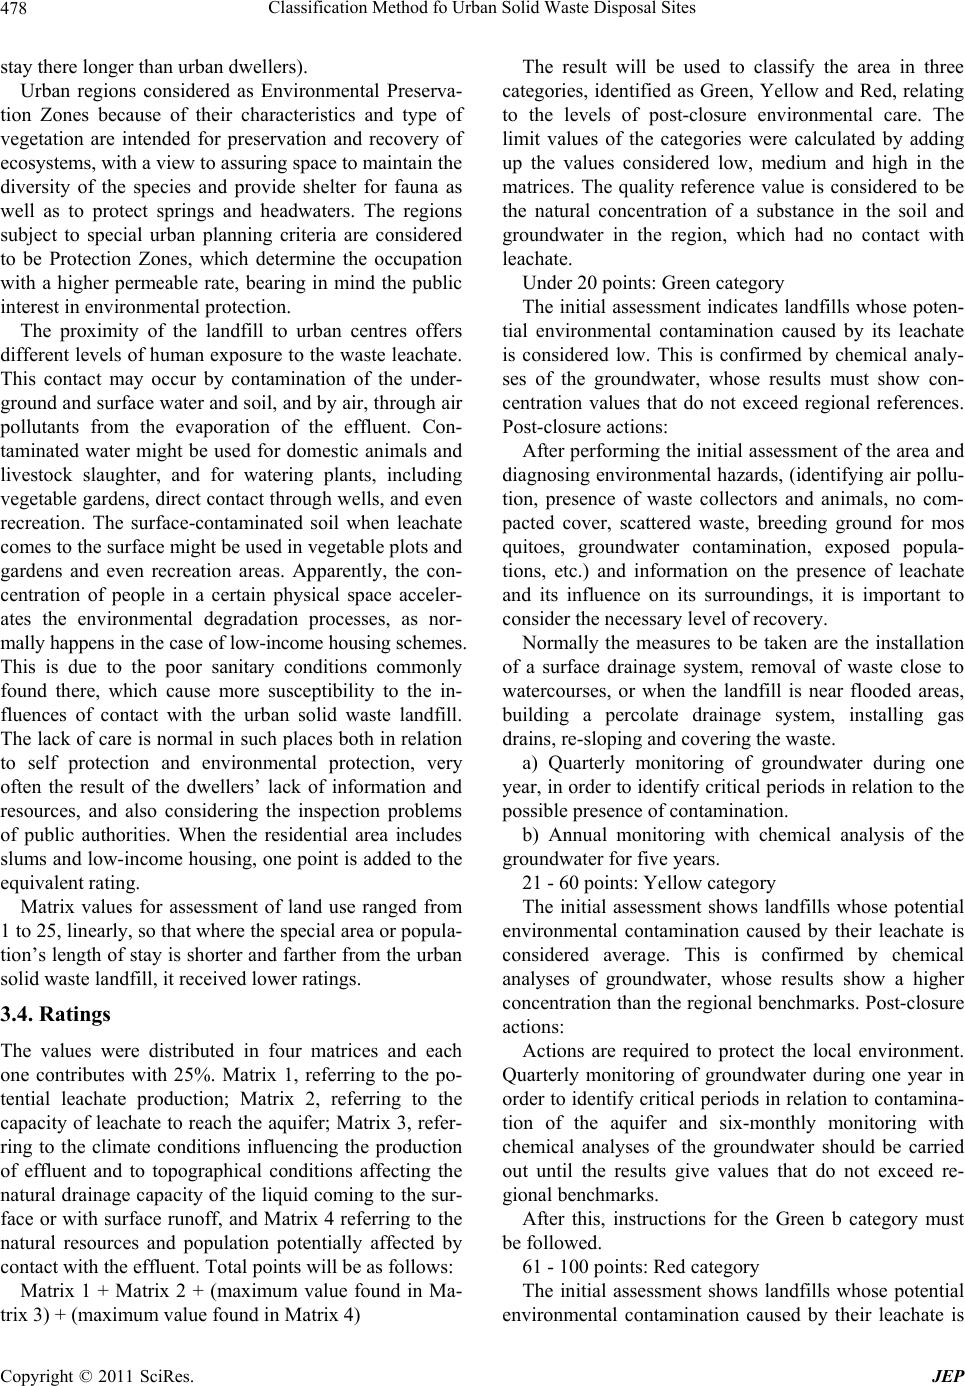 Classification Method fo Urban Solid Waste Disposal Sites 478 stay there longer than urb an dweller s ). Urban regions considered as Environmental Preserva- tion Zones because of their characteristics and type of vegetation are intended for preservation and recovery of ecosystems, with a view to assuring space to maintain the diversity of the species and provide shelter for fauna as well as to protect springs and headwaters. The regions subject to special urban planning criteria are considered to be Protection Zones, which determine the occupation with a higher permeable rate, bearing in mind the public interest in environmental protection. The proximity of the landfill to urban centres offers different levels of human exposure to the waste leachate. This contact may occur by contamination of the under- ground and surface water and soil, and by air, through air pollutants from the evaporation of the effluent. Con- taminated water might be used for domestic animals and livestock slaughter, and for watering plants, including vegetable gardens, direct contact through wells, and even recreation. The surface-contaminated soil when leachate comes to the surface might be used in vegetable plots and gardens and even recreation areas. Apparently, the con- centration of people in a certain physical space acceler- ates the environmental degradation processes, as nor- mally happens in the case of low-income housing schemes. This is due to the poor sanitary conditions commonly found there, which cause more susceptibility to the in- fluences of contact with the urban solid waste landfill. The lack of care is normal in such places both in relation to self protection and environmental protection, very often the result of the dwellers’ lack of information and resources, and also considering the inspection problems of public authorities. When the residential area includes slums and low-income housing, one point is added to the equivale nt rating . Matrix values for assessment of land use ranged from 1 to 25, linearly, so that where the special area or popula- tion’s length of stay is shorter and farther from the urban solid waste landfill, it received lower ratings. 3.4. Ratings The values were distributed in four matrices and each one contributes with 25%. Matrix 1, referring to the po- tential leachate production; Matrix 2, referring to the capacity of leachate to reach the aquifer; Matrix 3, refer- ring to the climate conditions influencing the production of effluent and to topographical conditions affecting the natural drainage capacity of the liquid coming to the sur- face or with surface runoff, and Matrix 4 referring to the natural resources and population potentially affected by contact with the effluent. Total points will be as follows: Matrix 1 + Matrix 2 + (maximum value found in Ma- trix 3) + (maximum value found in Matrix 4) The result will be used to classify the area in three categories, identified as Green, Yellow and Red, relating to the levels of post-closure environmental care. The limit values of the categories were calculated by adding up the values considered low, medium and high in the matrices. The quality reference value is considered to be the natural concentration of a substance in the soil and groundwater in the region, which had no contact with leachate. Under 20 points: Green category The initial assessment indicates landfills whose poten- tial environmental contamination caused by its leachate is considered low. This is confirmed by chemical analy- ses of the groundwater, whose results must show con- centration values that do not exceed regional references. Post-closure actions: After performing the initial assessment of the area and diagnosing environmental hazards, (identifying air pollu- tion, presence of waste collectors and animals, no com- pacted cover, scattered waste, breeding ground for mos quitoes, groundwater contamination, exposed popula- tions, etc.) and information on the presence of leachate and its influence on its surroundings, it is important to consider the necessary level of recovery. Normally the measures to be taken are the installation of a surface drainage system, removal of waste close to watercourses, or when the landfill is near flooded areas, building a percolate drainage system, installing gas drains, re-sloping and covering the waste. a) Quarterly monitoring of groundwater during one year, in order to identify critical periods in relation to the possible presence of contamination. b) Annual monitoring with chemical analysis of the groundwater for five years. 21 - 60 points: Yellow category The initial assessment shows landfills whose potential environmental contamination caused by their leachate is considered average. This is confirmed by chemical analyses of groundwater, whose results show a higher concentration than the regional benchmarks. Post-closure actions: Actions are required to protect the local environment. Quarterly monitoring of groundwater during one year in order to identify critical periods in relation to con tamina- tion of the aquifer and six-monthly monitoring with chemical analyses of the groundwater should be carried out until the results give values that do not exceed re- gional benchmarks. After this, instructions for the Green b category must be followed. 61 - 100 points: Red category The initial assessment shows landfills whose potential environmental contamination caused by their leachate is Copyright © 2011 SciRes. JEP 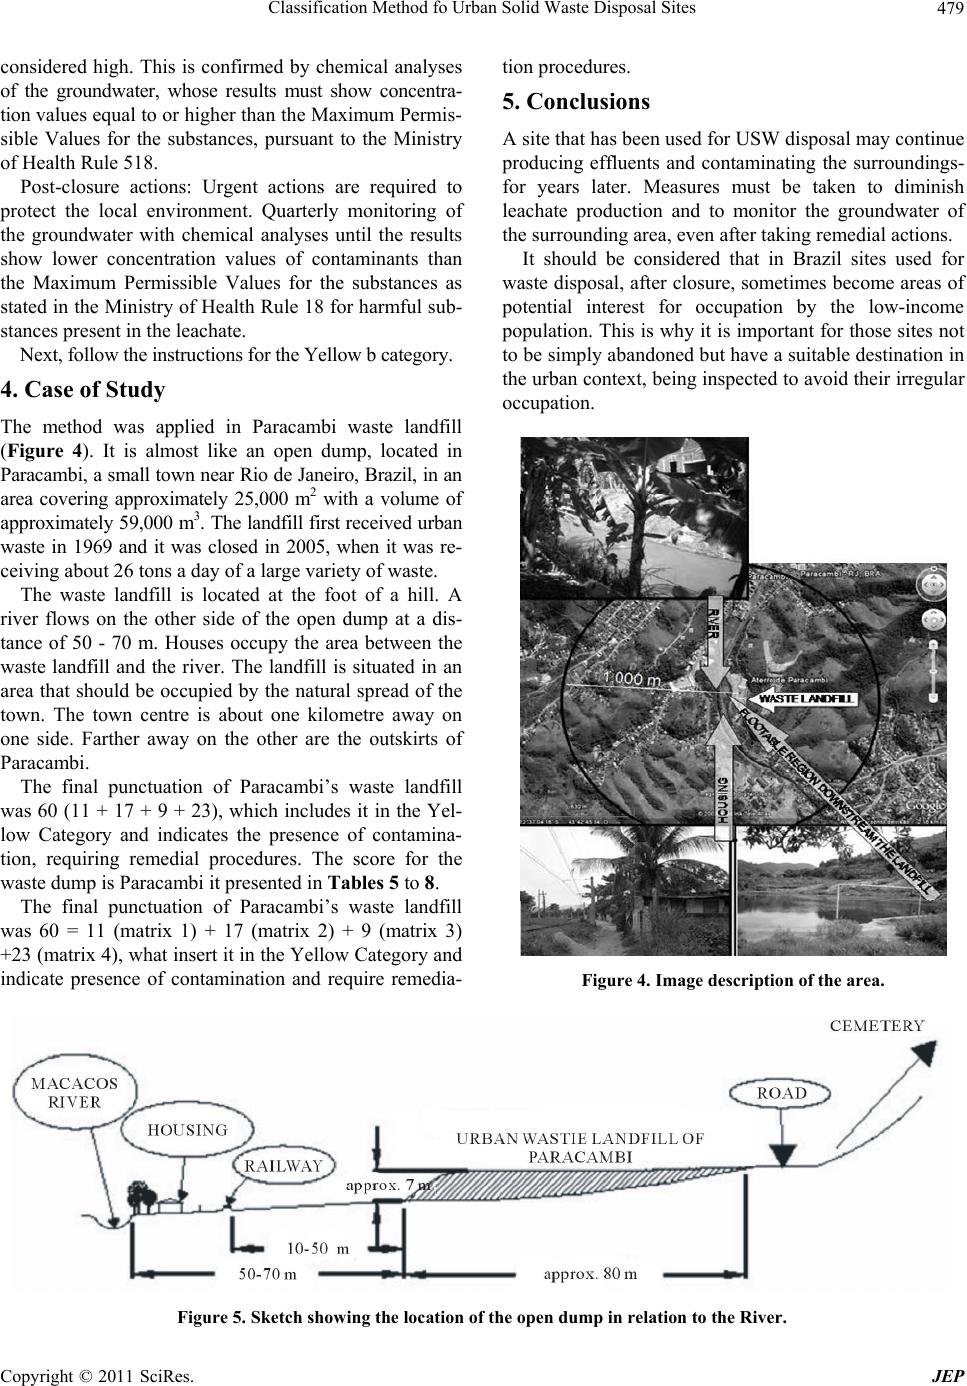 Classification Method fo Urban Solid Waste Disposal Sites Copyright © 2011 SciRes. JEP 479 tion procedu res. considered high. This is confirmed by chemical analyses of the groundwater, whose results must show concentra- tion values equal to or higher than the Maximum Permis- sible Values for the substances, pursuant to the Ministry of Health Rule 518. 5. Conclusions A site that has been used for USW disposal may continue producing effluents and contaminating the surroundings- for years later. Measures must be taken to diminish leachate production and to monitor the groundwater of the surrounding area, even after taking remedial actions. Post-closure actions: Urgent actions are required to protect the local environment. Quarterly monitoring of the groundwater with chemical analyses until the results show lower concentration values of contaminants than the Maximum Permissible Values for the substances as stated in the Ministry of Health Rule 18 for harmful sub- stances present in the leachate. It should be considered that in Brazil sites used for waste disposal, after closure, sometimes become areas of potential interest for occupation by the low-income population. This is why it is important for those sites not to be simply abandoned but have a suitable destination in the urban context, being inspected to avoid their irregular occupation. Next, follow the instructions for the Yellow b category. 4. Case of Study The method was applied in Paracambi waste landfill (Figure 4). It is almost like an open dump, located in Paracambi, a s mall town near Rio de Janeiro, Braz il, in an area covering approximately 25,000 m2 with a volume of approximately 59,000 m3. The landfill first received urban waste in 1969 and it was closed in 2005, when it was re- ceiving about 26 tons a day of a large variety of waste. The waste landfill is located at the foot of a hill. A river flows on the other side of the open dump at a dis- tance of 50 - 70 m. Houses occupy the area between the waste landfill and the river. The landfill is situated in an area that should be occupied by the natural spread of the town. The town centre is about one kilometre away on one side. Farther away on the other are the outskirts of Paracambi. The final punctuation of Paracambi’s waste landfill was 60 (11 + 17 + 9 + 23), which includes it in the Yel- low Category and indicates the presence of contamina- tion, requiring remedial procedures. The score for the waste dump is Paracambi it presented in Tables 5 to 8. The final punctuation of Paracambi’s waste landfill was 60 = 11 (matrix 1) + 17 (matrix 2) + 9 (matrix 3) +23 (matrix 4), what insert it in the Yellow Category and indicate presence of contamination and require remedia- Figure 4. Image description of the area. Figure 5. Sketch showing the location of the open dump in relation to the River. 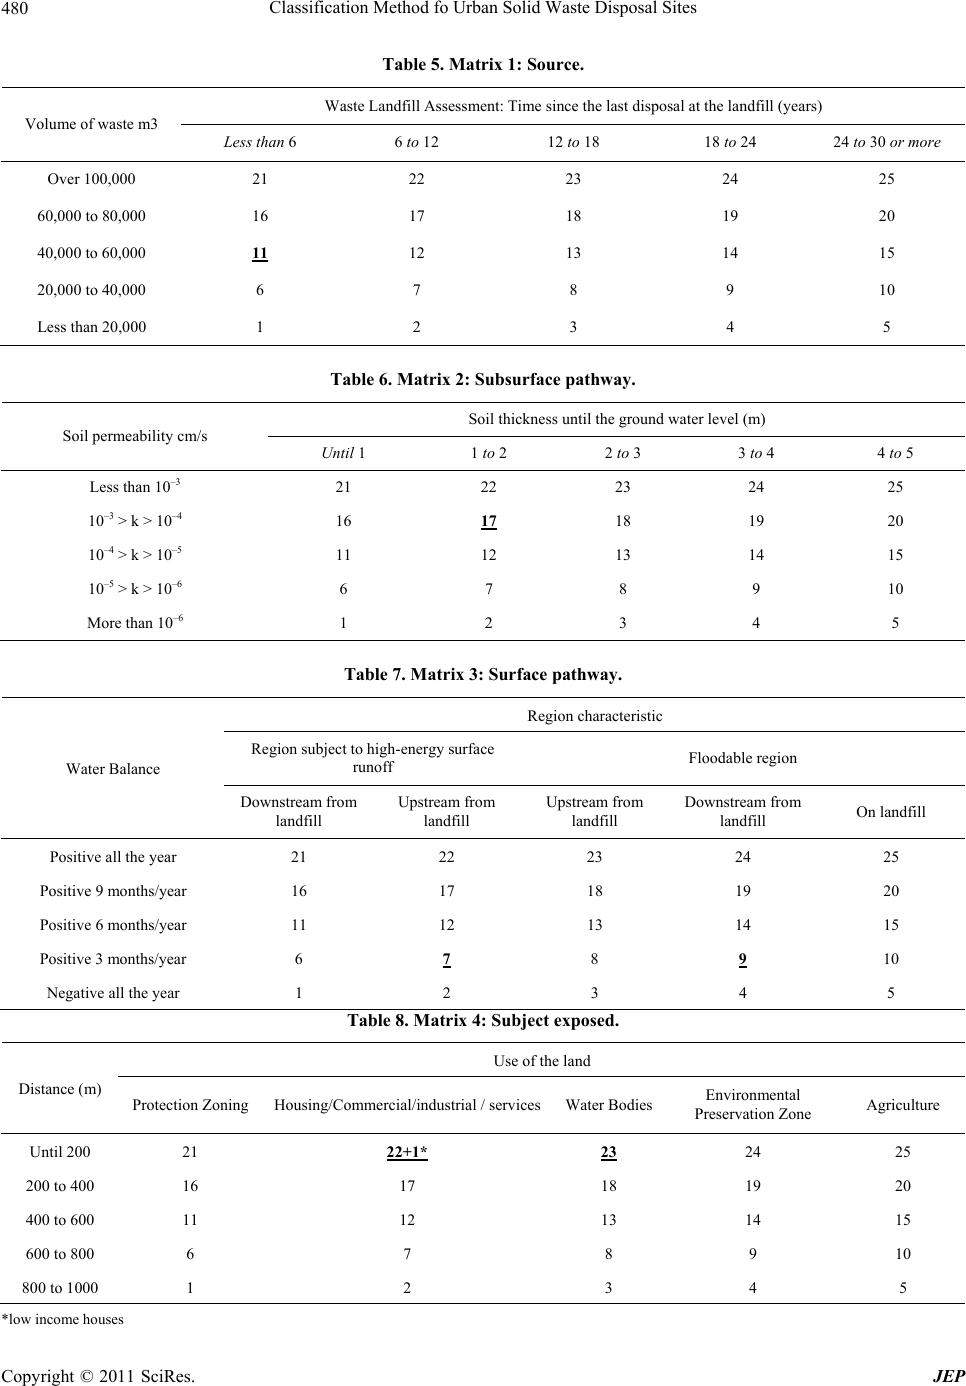 Classification Method fo Urban Solid Waste Disposal Sites 480 Table 5. Matrix 1: Source. Waste Landfill Assessment: Time since the last disposal at the landfill (years) Volume of waste m3 Less than 6 6 to 12 12 to 18 18 to 24 24 to 30 or more Over 100,000 21 22 23 24 25 60,000 to 80,000 16 17 18 19 20 40,000 to 60,000 11 12 13 14 15 20,000 to 40,000 6 7 8 9 10 Less than 20,000 1 2 3 4 5 Table 6. Matrix 2: Subsurface pathway. Soil thickness unti l the ground water level (m) Soil permeability cm/s Until 1 1 to 2 2 to 3 3 to 4 4 to 5 Less than 10–3 21 22 23 24 25 10–3 > k > 10–4 16 17 18 19 20 10–4 > k > 10–5 11 12 13 14 15 10–5 > k > 10–6 6 7 8 9 10 More than 10–6 1 2 3 4 5 Table 7. Matrix 3: Surface pathway. Region characteristic Region subject to high-energy su r face runoff Floodable region Water Balance Downstream from landfill Upstream from landfill Upstream from landfill Downstream from landfill On landfill Positive all the year 21 22 23 24 25 Positive 9 months/year 16 17 18 19 20 Positive 6 months/year 11 12 13 14 15 Positive 3 months/year 6 7 8 9 10 Negative all the year 1 2 3 4 5 Table 8. Matrix 4: Subject expose d. Use of the land Distance (m) Protection Zoni ngHousing/Commercial/industrial / s ervicesWater BodiesEnvironmental Preservation Zone Agriculture Until 200 21 22+1* 23 24 25 200 to 400 16 17 18 19 20 400 to 600 11 12 13 14 15 600 to 800 6 7 8 9 10 800 to 1000 1 2 3 4 5 *low income houses Copyright © 2011 SciRes. JEP  Classification Method fo Urban Solid Waste Disposal Sites Copyright © 2011 SciRes. JEP 481 The proposed assessment system SISTAVAFE is a simple system that may also contribute to establishing criteria for the urban reintegration of such sites, creating guidelines for investigation areas and, consequently, op- timising time and resources. Its application to a real case showed that it is a simple but valuable too l that should b e used by many local governments worldwide for deciding on actions relating to closed landfills. 5. Acknowledgements The authors thank CNPq and FAPERJ for their support. REFERENCES [1] Brazilian Technical Standards Association, “Non-Haz- ardous Waste Landfills—Criteria for Design, Implemen- tation and Operation—Procedure (NBR-13896),” ABNT- Associação Brasileira de Normas Técnicas, Rio de Ja- neiro, 1997. [2] G. Andreottola and P. Cannas, “Chemical and Biological Characteristics of Landfill Leachate,” In: T. H. Christen- sen, R. Cossu and R. Stegman, Eds., Landfilling of Waste: Leachate, 1997, pp. 65-88 [3] O. A. Filho, L. E. S. Cerri and C. J. Amenomori, “Geologic Risks. Conceptual Aspects,” I Simpósio Latino-Americano sobre Risco Geológico Urbano, São Paulo, 1990, pp. 334-341. (in Portuguese) [4] R. Fell, “Landslide Risk Assessment and Acceptable Risk”. Canadian Geotechnical Journal, Vol. 31, 1994, pp. 261-272. [5] R. Fell and D. Hartford, “Landslide Risk Management,” Proceedings of the International Workshop on the Land- slide Risk Assessment, Hawaii, 19-21 February 1997, pp. 51-109. [6] S. Heitefuss and K. Turk, “Additional Processing Notes for Establishing Regional Lists of Priorities and Regional Waiting Lists by the Regional Commission for Assess- ment A. Old Landfill Facts: First assessment of Old Landfill Disposal at Proof Level 1,” 1994, 8S., 7 Abb. (in German) [7] IPT/CEMPRE “Local Waste: Handbook on Integrated Management,” Institute of Technological Research, 1st Edition, São Paulo, 2000. [8] Mahler, C. F.; Lima, G. S. A. “Applying the value analy- sis and fuzzy logic to select areas for installing waste fills. Environmental Monitoring and Assessment” (EMA), 2002. [9] A. T. Ogura, “Riesgos Geologicos Urbanos”. Clases Dictadas en el Curso Formación en Aspectos Geológicos de Protección Ambiental. Instituto de Geociencias de la Universidad Estatal de Campinas - UNICAMP, São Paulo, Vol. 1, 1995, pp. 89-101. [10] A. S. Schueler, “Case Study and Proposed Assessment of Degraded Areas by Disposal of Urban Solid Waste” Ph.D. Thesis, Coppe-Federal University of Rio de Janeiro (UFRJ). Rio de Janeiro, 2005. [11] A. Pires, G. Martinho, N.-B. Chang, “Solid Waste Management in European Countries: A Review of Systems Analysis Techniques” Journal of Environmental Management, Vol. 92, No. 4, 2011, pp. 1033-1050. [12] G. Tchobanoglous, H. Theisen and S. A. Vigil, “Inte- grated Solid Waste Management”, McGraw-Hill, New York, 1993. [13] Ministry of Health Rule 518. |