Materials Sciences and Applicatio ns, 2011, 2, 596-604
doi:10.4236/msa.2011.26080 Published Online June 2011 (http://www.SciRP.org/journal/msa)
Copyright © 2011 SciRes. MSA
Predicting the Fatigue Life in Steel and Glass Fiber
Reinforced Plastics Using Damage Models
Roselita Fragoudakis, Anil Saigal
Department of Mechanical Engineering, Tufts University, Medford, USA.
Email: roselita.fragoudakis@tufts.edu
Received December 20th, 2010; revised March 21st, 2011; accepted March 30th, 2011.
ABSTRACT
Three cumulative damage models are examined for the case of cyclic loading of AISI 6150 steel, S2 glass fibre/epoxy
and E glass fibre/epoxy composites. The Palmgren-Miner, Broutman-Sahu and Hashin-Rotem models are compared to
determine which of the three gives the most accurate estimation of the fatigue life of the materials tested. In addition,
comparison of the fatigue life of the materials shows the superiority of AISI 6150 steel and S2 glass fibre/epoxy at lower
mean stresses, and that of steel to the composites at higher mean stresses.
Keywords: Glass Fiber Reinforced Plastic (GFRP), Cumulative Damage Distribution, Low Cycle Fatigue (LCF), High
Cycle Fatigue (HCF)
1. Introduction
Technological advances require light and durable struc-
tures, as is the case in the automotive industry. For this
reason composites have replaced metals in many applica-
tions. In the case of heavy-duty vehicle suspensions, the
market has expanded to composite leaf springs as a re-
placement of the conventional steel beams. Composites
weigh less than metals and have high strength and stiff-
ness [1]. When selecting a material for cyclic loading
applications, knowledge of its fatigue life is crucial. It is
impossible to predict the fatigue failure of individual
specimens, and therefore a statistical approach in deter-
mining the fatigue life of materials is necessary. The
Weibull distribution helps predict the fatigue life and
failure of materials using failure data from specimens
subjected to certain loading conditions and is essential
when the materials involved are brittle as in the case of
composites [1,2].
The ensemble of attempts to calculate the damage
caused by cycling, as well as its accumulation when cy-
cling includes more than one stress amplitudes, is Cu-
mulative Damage Theory [3]. The concept of cumulative
damage can be discussed either based on residual
strength, being the instantaneous static strength that the
material can still maintain after being loaded to stress
levels causing damage, or the estimation of cumulative
damage through damage models, such as the ones dis-
cussed in this study [4].
Contrary to the case of homogeneous isotropic materi-
als such as metals where fatigue failure is characterized
by the initiation and propagation of a crack, fatigue fail-
ure in composites is the result of accumulated damage
[1,5]. In metals the strength of the material may change
little, if at all, during cycling fatigue, while crack propa-
gation is what will define the fatigue damage [6]. Com-
posites behave very differently, as their strength starts
decreasing slowly early in their fatigue life, and as failure
approaches, the rate of decreasing strengths becomes
very rapid [7]. The damage generated in a material under
loading can be predicted using damage models even
when minimum information on the fatigue of the mate-
rial is known.
The intensity of the stress being applied has a different
effect in composites and metals. In a metal structure the
stresses that are critical in designing a metal structure are
low stresses, while in composites it is higher stresses that
define low cycle fatigue, that become critical when de-
signing a composite structure [8].
2. Damage Models and Materials
This study uses the following three damage models to
predict and compare the damage caused in AISI 6150
steel and unidirectional Glass Fiber Reinforced Plastics
(GFRP), S2 glass fibre/epoxy and E glass fibre/epoxy,
under cyclic loading conditions:
Palmgren-Miner [9-11]:
Predicting the Fatigue Life in Steel and Glass Fiber Reinforced Plastics Using Damage Models597
1
1
n
i
ii
nK
N



(1)
Broutman-Sahu [10,12]:


11
1
nUltimate ii
iUltimate ii
nK
N






(2)
and Hashin-Rotem [3,10]:




1
1
1
1
11
1
k
k
S
S
nki
ii
k
nnK
NN










(3)
k
k
Ultimate
S
(3a)
1
1
k
k
Ultimate
S
(3b)
where ni is the number of cycles under the applied stress,
Ni the cycles to failure under this same stress, σi and σk
are the stresses applied,
Ultimate is the ultimate strength,
Sk is the ratio of the applied stress to the ultimate strength,
and K is the number of repetitions of the loading cycle.
When each of these equations equals 1, the damage ac-
cumulated leads to failure. However, damage is still be-
ing caused even if the right hand side of the above equa-
tions is less than 1 [3,4,9-13].
A specimen may be subjected to one or more stress
levels and undergo cycling. When there are two stress
levels, where
1 and
2 are imposed on the specimen for
an amount of n1 and n2 cycles, respectively, n2 is the
number of cycles that will lead the specimen to failure,
called the residual lifetime. Residual lifetime can be pre-
dicted by all three of the above models, when their ma-
thematical expression equals 1, i.e. at failure. The cou-
ples i and ni are the stress and respective number of cy-
cles used to create a damage curve. The damage curve
shows the ultimate damage caused to the specimen, when
its residual life is zero. Such a curve is called S-N curve.
Each point on a damage curve, defined by (
, n), repre-
sents the damage caused to a specimen after n cycles
under a load
. As a result it can be concluded, that
damage is a way to describe the life of the specimen that
is spent when it is loaded at
. The ratio ni/Ni represents
a life fraction for the specimen being loaded at
i [3].
The Palmgren-Miner model defines damage in the mate-
rial, in the form of life fractions, the sum of which when
1 defines failure of the material when no more residual
life remains to be expended. The other two models also
define damage in the form of life fractions, but in these
two cases the models account for the loading sequence,
which is not accounted for in Palmgren-Miner.
The Palmgren-Miner damage rule, also referred to as
Miner’s sum, expresses damage in terms of cycles ap-
plied at a stress level, divided by the number of cycles
that lead to failure at this stress level. Each such ratio
represents a percentage of life consumed [3,8,12]. When
the summation of all these ratios equals 1, as given by (1),
the specimen has failed. In the Palmgren-Miner damage
rule the order in which the stresses are applied to the
specimen has no effect in its fatigue life [11].
When a metal component is undergoing a two-stress
level loading, damage, according to Palmgren-Miner rule,
is greater when the first stress is higher than the second
stress (in such case the sum in (1) is close or higher than
1), and less damage occurs when the loading sequence is
a low to high stress (when the sum in (1) is less than 1)
[11,12]. Broutman and Sahu presented a modified Min-
er’s sum, in order to account for this discrepancy of
Miner’s sum from unity. Broutman and Sahu used the
linear strength reduction curves, and assuming that the
residual strength is a linear function of the fractional life
spent when the component is loaded at a given stress
level, predicted more accurately the fatigue behavior in
GFRP, especially at higher stress levels [12].
Hashin and Rotem used the concept of damage curve
families to represent residual lifetimes for two-stress lev-
el loading, as well as the fact that equivalent residual
lives are expended by specimens that undergo different
loading schemes1. They developed a cumulative damage
model to predict damage in two-stress level loading,
which can be expanded for use in multi-stress level
loadings [3].
As mentioned above, the Palmgren-Miner rule has
been shown not to account for loading sequences, as the
sum can be calculated irrespective of the loading order.
As a result for a high-low stress test the predicted cumu-
lative damage by this model is greater than 1, and for a
sequence of low-high stress the sum is less than 1 [3,
11,12]. The other two models, which take into account
the order of loading, give more accurate results. Palm-
gren-Miner and Hashin-Rotem rules have been initially
designed and tested on metals, although later used in
GFRP damage predictions. Broutman-Sahu rule was de-
veloped and tested on GFRP.
A classification of the damage models can be made
based on their linearity or non-linearity, and according to
the parameters required for their calculation [1]. Conse-
quently, Palmgren-Miner is a linear stress independent
model, Broutman-Sahu is a linear stress dependent model
and Hashin-Rotem is a non-linear stress dependent mod-
1This is referred to as the equivalent loading postulate that states: “cy-
clic loadings which are equivalent for one stress level are equivalen
t
f
or all stress levels” [3].
Copyright © 2011 SciRes. MSA
Predicting the Fatigue Life in Steel and Glass Fiber Reinforced Plastics Using Damage Models
598
el.
The materials investigated in this study are AISI 6150
steel with an ultimate tensile strength of 1.24 GPa [14],
and unidirectional laminate composites with +/–5˚ fiber
orientation and ultimate flexural strength of 1.28 GPa for
S2 glass fibre/epoxy and 1.08 GPa for E glass fibre/epoxy
[15].
AISI 6150 is a chromium-vanadium steel commonly
used in the manufacturing of leaf-springs for heavy duty
vehicles. For the production of leaf springs the steel is
quenched in oil at 850˚C and then tempered at 500˚C. A
surface treatment of shot peening is then followed in or-
der to induce compressive residual stresses to the surface
of the leaf spring and therefore, enhance its fatigue life
[11,14,16,17]. The shot peening intensity used is ap-
proximately 0.3 in the Almen C scale. In this study the
steel data used is based on experiments carried out on
chromium-vanadium steel springs that have undergone,
quenching, tempering and shot peening.
S2 glass fibre/epoxy and E glass fibre/epoxy are very
common composite alternatives to steel in the manufac-
turing of leaf springs for heavy-duty vehicles [15]. The
unidirectional nature of the composites assures a trans-
verse isotropic environment [5,13]. The direction of the
fibers plays a crucial role in determining the fatigue life
of the material, especially in loading conditions that in-
volve bending [5,13].
All three materials are used in the manufacturing of
leaf springs for heavy-duty vehicle suspension systems.
The fatigue life data for both steel and composites is the
result of static fatigue tests on individual leaves. The
apparatus used to conduct the AISI 6150 steel tests [14]
and that used to test the fatigue life of S2 glass fi-
bre/epoxy and E glass fibre/epoxy [15] are very similar.
In both cases a single leaf spring was mounted on a test
rig as shown in Figure 1, a downward concentrated load
was applied to the center of the leaf spring using a hy-
draulic cylinder. The magnitude of the load was regu-
lated with a load cell, and the number of cycles was
counted. Displacement transducers measured the deflec-
tions in different parts of the leaf. The specimens were
cycled under a specific load until failure occurred.
3. Results
Damage was calculated for a range of maximum stresses
from 500 MPa to 1100 MPa (corresponding to a range of
mean stresses from 256 MPa to 560 MPa), and for a
loading ratio of approximately 0.2. These stress ampli-
tudes correspond to both low cycle (LCF) and high cycle
(HCF) fatigue loading in both materials. A two-parameter
Weibull analysis was performed for each of the three
damage models mentioned above [2,18-20], in order to
decide which model gives more realistic results for
Figure 1. The test rig in the AISI 6150 steel leaf spring static
fatigue tests [14].
damage and fatigue life, when compared to experimental
data [14,15].
A scale parameter α and a shape parameter β for each
damage model were calculated through the analysis of
the accumulated damage and fatigue life (Table 1).
When the shape parameter β is larger than 1, failure in-
creases with time [18]. In the case of the two linear mod-
els for steel we can see that the failure of the material is
dependent on time. However, for the majority of our
models, and especially all the models of the composites,
damage accumulate independently of time. In these cases
damage is purely dependent on the loading, and the
shape parameter β is less than 1. The scale parameter α
gives the mean value of damage caused in the material
after one loading cycle. From Table 1 it can be con-
cluded that for the case of the two linear models, damage
per cycle is larger for the composites, especially in E
glass fibre/epoxy, by at least one order of magnitude
when compared to steel damage. However, in the case of
the non-linear model, Hashin-Rotem, damage caused per
cycle is higher in E glass fibre/epoxy, followed by steel.
However, the mean damage per cycle in steel as pre-
dicted by the Hashin-Rotem model has no significant
difference from that caused in the S2 glass fibre/epoxy
composite.
The cumulative distributions for damage are shown in
Figure 2(a) for steel and Figures 2(b) and 2(c) for the
composites. As it can be seen from Figure 2(a), the two
linear models coincide at lower stresses. Broutman-Sahu
and Palmgren-Miner models give almost identical results
up to the mean stress of 360 MPa. Compared to the two
linear models, Hashin-Rotem gives a higher probability
of failure at stresses between 256 MPa and 350 MPa and,
and lower probability between 360 MPa to 460 MPa and
462 MPa to 560 MPa. However, it agrees with Brout-
man-Sahu at 485 MPa. The Hashin-Rotem model esti-
mates an approximately 95% probability of failure at 560
MPa, which is just 1% higher than that estimated at the
Copyright © 2011 SciRes. MSA
Predicting the Fatigue Life in Steel and Glass Fiber Reinforced Plastics Using Damage Models599
Table 1. Shape and scale parameters for all damage models.
Palmgren-Miner Broutman-Sahu Hashin-Rotem
β 6150 steel 1.18 1.89 0.40
β E glass/fibre 0.22 0.28 0.38
β S2 glass/fibre 0.28 0.37 0.42
α 6150 steel 6.21 × 10⁻⁶ 3.51 × 10⁻⁶ 1.17 × 10⁻²
α E glass/fibre 1.29 × 10⁻³ 2.68 × 10⁻⁴ 0.41
α S2 glass/fibre 5.06 × 10⁻⁵ 2.08 × 10⁻⁵ 8.49 × 10⁻³
(a)
(b)
(c)
Figure 2. Cumulative distribution of damage versus mean
stress: (a) AISI 6150 steel, (b) S2 glass fibre/epoxy compos-
ite, (c) E glass fibre/epoxy composite.
same mean stress lever by the two linear models.
For the S2 glass fibre/epoxy composite (Figure 2(b))
the two linear models give similar results at almost all
mean stresses. For the interval between 256 MPa and 350
MPa, Hashin-Rotem gives a lower probability of failure
than Broutman-Sahu and Palmgren-Miner. For stresses
from 350 MPa to 485 MPa Hashin-Rotem gives higher
probability of failure, but at 485 MPa gives a failure
probability very close to that of the other two models.
For the case of the S2 glass fibre/epoxy composite, Ha-
shin-Rotem gives failure probability at 560 MPa, same as
that estimated by the model for the case of the steel,
which is approximately 95%, 2% lower than the estimate
of the two linear models at the same mean stress.
In the case of E glass fibre/epoxy composite, the two
linear models give almost identical results. Both Palm-
gren-Miner and Broutman-Sahu show a constant prob-
ability of failure at low mean stresses up to 280 MPa. For
both cases of the linear models failure probability at
these mean stress levels is approximately 19%. Figure
2(c) shows that the Broutman-Sahu model gives a bit
lower probability of failure at mean stresses between
350 MPa and 400 MPa, and higher values at 460 MPa to
485 MPa. However, these values of failure probability
when compared to the results of the Palmgren-Miner
model differ by at most 1%. At 560 MPa, all three mod-
els give a prediction of total failure, where cumulative
damage is 1. This is due to the fact that this mean stress
level at a stress ratio of 0.2 corresponds to a maximum
stress of 1.1 GPa, which is higher than the ultimate ten-
sile strength of the material. The Hashin-Rotem model
starts with lower probability of failure, than the linear
models, but the cumulative damage increases between
280 MPa and 360 MPa, giving a probability 5% higher
than the Palmgren-Miner model. Above the mean stress
of 360 MPa it agrees with the two linear models, with
differences less than 0.1%.
For all three materials, and especially in the cases of
steel and E glass fibre/epoxy, it is observed from the
graphs that the curve based on the Hashin-Rotem model
is a smooth curve resembling a best-fit line for the other
two curves of the two linear damage models. It is also
worth mentioning that the deviation of Hashin-Rotem
from the other two models is larger in the case of the S2
glass fiber/epoxy composite and smaller in E glass fi-
bre/epoxy. The maximum deviation in steel at 360 MPa
is 26% less than the other two models. In the S2 glass
fibre/epoxy Hashin-Rotem deviates the most from the
two linear models between 462 MPa to 485 MPa. At
these mean stress levels the non-linear model gives ap-
proximately 31% more damage probability than Palm-
gren-Miner and Broutman-Sahu models. Finally, in E
glass fibre/epoxy the highest deviation of the Hashin-
Copyright © 2011 SciRes. MSA
Predicting the Fatigue Life in Steel and Glass Fiber Reinforced Plastics Using Damage Models
600
Rotem model from the two linear ones is 7% and occurs
at 358 MPa.
A final observation regarding probability of failure
shows that the composites start with higher probability of
failure at lower stresses (28% failure probability esti-
mated by the linear models for S2 glass fibre/epoxy, 19%
for E glass fibre/epoxy, as compared to 15% for steels),
but slowly show lower cumulative damage than steel
between 350 MPa to 360 MPa2. This can be explained by
the inhomogeneous nature of composites that fail due to
damage accumulation, and the fact that in steel failure is
based on crack initiation and propagation. From the
above comparison it can conclude that the composites
accumulate damage from the beginning of loading when
a crack in steel is most probably not even initiated yet.
However, at the point where failure probability for steel
is higher than that of the composites, it can be suspected
that a crack in the steel material has formed and is being
propagated. At the highest mean stress where calcula-
tions were made, at 560 MPa, the composites’ failure
probability estimate given by the two linear models is at
least 3% higher than the estimate in steel. The composite
materials’ components, matrix and fibers, do not carry
equal amounts of loading and as a result fatigue differ-
ently. Damage accumulation may occur through a range
of microstructural mechanisms such as fibre fracture and
fibre/matrix deboning [5]. For this reason, the composites
end up with a higher chance of failure at 560 MPa. This
can also be understood by looking at the fatigue life
curves of the materials (Figure 4(c)).
The mean stresses 256 MPa to 360 MPa correspond to
HCF above 106 cycles for the S2 glass fibre/epoxy com-
posite, but only 105 for the steel and E glass fibre/epoxy.
The damage accumulation leading to failure of the
composites is also obvious from the graphs as the LCF,
460 MPa to 560 MPa mean stress, is less than that of the
steel.
Figure 2 shows cumulative damage distribution for
one cycle (K = 1). The fatigue life of the materials can be
calculated by calculating the value K when each of the
three models equals 1, i.e. at failure. Figures 3(a), 3(b),
and 3(c) give the mean stress versus cycles to failure for
the steel, S2 glass fibre/epoxy and E glass fibre/epoxy
composites, respectively. The short dash line in each
graph is experimental data from literature [14,15].
(a)
(b)
(c)
Figure 3. Mean stress versus life to failure: (a) AISI 6150
steel, (b) S2 glass fibre/epoxy composite, (c) E glass fibre/
epoxy composite.
In the case of the steel, the two linear models give
similar results at lower stresses up to 280 MPa, while at
higher stresses they differ by one order of magnitude,
with the Broutman-Sahu model giving better fatigue life.
The experimental results give a lower fatigue life for the
same stresses, with 48% difference in life cycles at a
mean stress level of 560 MPa when compared to Palm-
gren-Miner model results, and 79% difference when
compared to results from the Broutman-Sahu model. The
Hashin-Rotem model greatly underestimates the fatigue
life of steel by two orders of magnitude at the mean
stress of 256 MPa, and more than four orders of magni-
2The Hashin-Rotem model gives similar results in S2 glass fi
b
re/epoxy
and steel. The Ultimate Tensile Strength (UTS) of both the steel and
the above composite differ by 40 MPa in magnitude, with the compos-
ite having the higher UTS. The non-linear nature of the Hashin-Rotem
model fails to account significantly for this small difference in the
magnitude of the ultimate strength. As a result, this model gives almost
identical results for the probability of failure, under the same mean
stress, for the two materials.
Copyright © 2011 SciRes. MSA
Predicting the Fatigue Life in Steel and Glass Fiber Reinforced Plastics Using Damage Models601
tude at 560 MPa, when compared to experimental data.
In the case of the S2 glass fibre/epoxy composite,
Broutman-Sahu and Palmgren-Miner give similar up to
360 MPa, and differ by 86% at 560 MPa, while Ha-
shin-Rotem model underestimates the composite’s life,
as in the case of steel, by three orders of magnitude at
low mean stresses. The stress dependent model Brout-
man-Sahu starts with lower fatigue life at lower stresses
and shows higher life predictions at higher stresses, when
compared to Palmgren-Miner model. This is based on the
fact that the Palmgren-Miner model is not sensitive to
small changes in stress, as it is a stress independent mod-
el. Although small, these changes in stress are important
in a material that fails by accumulating damage while
being cyclic loaded. When the predictions of the damage
models are compared to experimental data, we see that
the two linear models predictions are within one order of
magnitude higher, at very low mean stresses, while this is
the case when experimental data is compared to the
non-linear model predictions at high mean stresses,
above 400 MPa.
The results for E glass fibre/epoxy are not very differ-
ent from those of S2 glass fibre/epoxy, as far as com-
parison among the three damage models is concerned.
The two linear models give a fatigue life that differs by
less than one order of magnitude at low mean stresses up
to 280 MPa (Palmgren-Miner gives a fatigue life 15%
higher than Broutman-Sahu). At higher stresses Brout-
man-Sahu shows better results, which are 92% higher
than Palmgren-Miner at 512 MPa. Hashin-Rotem under-
estimates the fatigue life of the composite, as is the case
of this model in the previous two materials. At low mean
stresses the non-linear model predicts a fatigue life three
orders of magnitude smaller than that predicted by the
Palmgren-Miner model, while at higher stresses these
predictions are one order of magnitude smaller than the
Palmgren-Miner predictions and two orders of magnitude
less than the fatigue life given by the Broutman-Sahu
model. A similar pattern to S2 glass fibre/epoxy compos-
ite is seen at low mean stresses, when compared to the
predictions of the damage models to experimental data
for the material. However, at higher mean stresses it is
the Palmgren-Miner model that agrees with experimental
data. The Hashin-Rotem model remains within one order
of magnitude below experimental data, at all mean stre-
sses.
It is worth mentioning that for all three materials the
experimental results fall between the linear and non-linear
models. In the case of the composites, predictions of fa-
tigue life using the damage models give better results at
HCF levels. It can be seen how damage accumulation
may affect composite materials if close attention is paid
to what happens when, as is the case of this study, the
mean stress rises above 460 MPa. At this stress level the
fatigue life of the composite drops by 72%, in S2 glass
fibre/epoxy and 99% in E glass fibre/epoxy, compared to
19% in the case of steel, which fails by crack initiation
and propagation mechanisms. However, it should be re-
minded that the experimental results for steel are taken
from fatigue tests carried out on steel leaf springs that
have been surface treated by shot peening. The effect of
this surface treatment cannot be accounted for when us-
ing the damage models examined in this study. As men-
tioned before, the fiber direction in the composite plays
significant role in determining the fatigue life of the ma-
terial [5,13]. A different fibre direction than the one of
the composite specimens in the experimental data used in
this study could have resulted in a fatigue life higher or
lower than that of steel.
4. Discussion and Conclusions
Based on this study, the following conclusions can be
drawn:
It can be seen that the larger the probability of failure,
the smaller the fatigue life of the material. In addition,
the deviation of Hashin-Rotem from the two linear mod-
els is proportional to the amount of underestimation of
the fatigue life.
The non-linear models in the steel and S2 glass fibre/
epoxy composite give very close results of predicted fa-
tigue life, especially at lower stresses, and predict fatigue
lives that show small differences between them. How-
ever, the predictions for S2 glass fibre/epoxy are slightly
better than those for steel and E glass fibre/epoxy com-
posite.
The linear models predict similar probability of failure
for all materials at high mean stresses, above 485 MPa.
For E glass fibre/epoxy composite and steel this similar-
ity can also be observed at low mean stresses below 358
MPa for the two linear models, and 280 MPa for all three
damage models. The life predictions based on the linear
models are better in the case of the composites at mean
stresses below 460 MPa. Above this stress level the
composites moves fast towards the LCF region, while
steel remains above 105 cycles of life.
It can be argued therefore, that composites are superior
to steel in applications of mean stresses below 460 MPa.
Experimental results may show otherwise, but one sh-
ould keep in mind the effect of shot peening on the sur-
face of the steel that renders the material more resistant
to fatigue failure.
When comparing the cumulative distribution of dam-
age diagrams as well as the fatigue life curves of the ma-
terials, it is hard to decide upon a damage model that will
give equally good predictions in both cases of materials.
For the AISI 6150 steel, it is the linear, stress independent
Copyright © 2011 SciRes. MSA
Predicting the Fatigue Life in Steel and Glass Fiber Reinforced Plastics Using Damage Models
Copyright © 2011 SciRes. MSA
602
(a)
(b)
(c)
Figure 4. Cumulative graphs for all materials: (a) Cumulative distribution of damage versus mean stress for all damage
models, (b) Mean stress versus life to failure for all damage models, (c) Mean stress versus life to failure, experimental results.
Palmgren-Miner model that better estimates, closer to
experimental results, the fatigue life of the material. Al-
though it gives a higher fatigue life than the one experi-
mentally measured, it should be taken into consideration
that undetected pre-existing flaws can greatly affect the
life of a specimen. Such effects will demonstrate them-
selves by lowering fatigue life of the piece, but cannot be
accounted for when using the damage models presented
in this study, and as a result will not be obvious from the
estimated fatigue lives.
The case of the composites seems to be a more com-
plicated one when deciding upon an optimal damage
model among the three examined in this study. Concern-
ing the fatigue life of the materials, at low stresses both
Predicting the Fatigue Life in Steel and Glass Fiber Reinforced Plastics Using Damage Models603
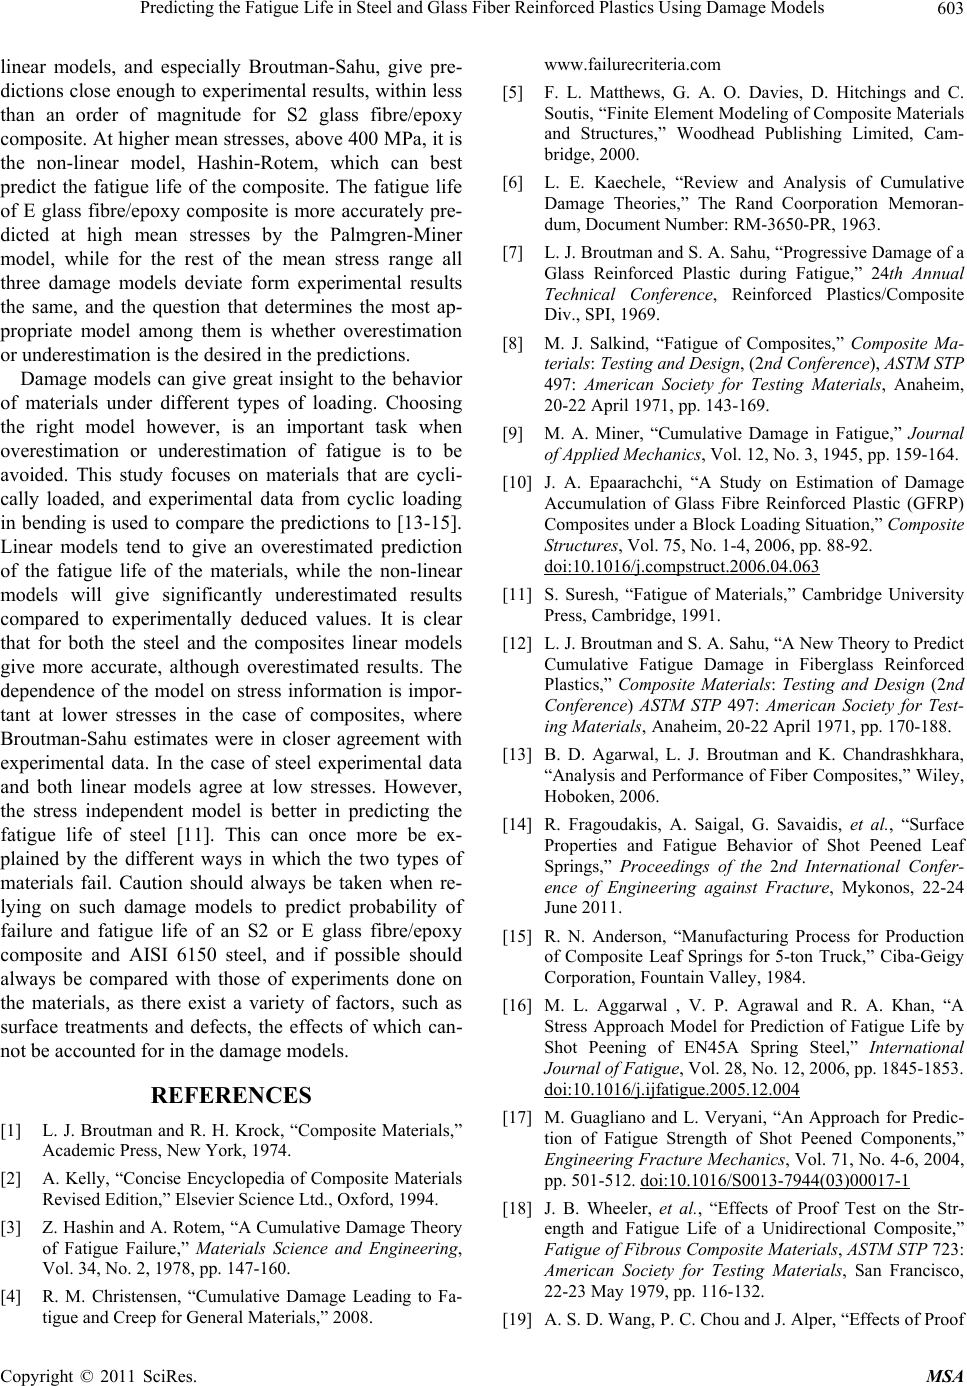
linear models, and especially Broutman-Sahu, give pre-
dictions close enough to experimental results, within less
than an order of magnitude for S2 glass fibre/epoxy
composite. At higher mean stresses, above 400 MPa, it is
the non-linear model, Hashin-Rotem, which can best
predict the fatigue life of the composite. The fatigue life
of E glass fibre/epoxy composite is more accurately pre-
dicted at high mean stresses by the Palmgren-Miner
model, while for the rest of the mean stress range all
three damage models deviate form experimental results
the same, and the question that determines the most ap-
propriate model among them is whether overestimation
or underestimation is the desired in the predictions.
Damage models can give great insight to the behavior
of materials under different types of loading. Choosing
the right model however, is an important task when
overestimation or underestimation of fatigue is to be
avoided. This study focuses on materials that are cycli-
cally loaded, and experimental data from cyclic loading
in bending is used to compare the predictions to [13-15].
Linear models tend to give an overestimated prediction
of the fatigue life of the materials, while the non-linear
models will give significantly underestimated results
compared to experimentally deduced values. It is clear
that for both the steel and the composites linear models
give more accurate, although overestimated results. The
dependence of the model on stress information is impor-
tant at lower stresses in the case of composites, where
Broutman-Sahu estimates were in closer agreement with
experimental data. In the case of steel experimental data
and both linear models agree at low stresses. However,
the stress independent model is better in predicting the
fatigue life of steel [11]. This can once more be ex-
plained by the different ways in which the two types of
materials fail. Caution should always be taken when re-
lying on such damage models to predict probability of
failure and fatigue life of an S2 or E glass fibre/epoxy
composite and AISI 6150 steel, and if possible should
always be compared with those of experiments done on
the materials, as there exist a variety of factors, such as
surface treatments and defects, the effects of which can-
not be accounted for in the damage models.
REFERENCES
[1] L. J. Broutman and R. H. Krock, “Composite Materials,”
Academic Press, New York, 1974.
[2] A. Kelly, “Concise Encyclopedia of Composite Materials
Revised Edition,” Elsevier Science Ltd., Oxford, 1994.
[3] Z. Hashin and A. Rotem, “A Cumulative Damage Theory
of Fatigue Failure,” Materials Science and Engineering,
Vol. 34, No. 2, 1978, pp. 147-160.
[4] R. M. Christensen, “Cumulative Damage Leading to Fa-
tigue and Creep for General Materials,” 2008.
www.failurecriteria.com
[5] F. L. Matthews, G. A. O. Davies, D. Hitchings and C.
Soutis, “Finite Element Modeling of Composite Materials
and Structures,” Woodhead Publishing Limited, Cam-
bridge, 2000.
[6] L. E. Kaechele, “Review and Analysis of Cumulative
Damage Theories,” The Rand Coorporation Memoran -
dum, Document Number: RM-3650-PR, 1963.
[7] L. J. Broutman and S. A. Sahu, “Progressive Damage of a
Glass Reinforced Plastic during Fatigue,” 24th Annual
Technical Conference, Reinforced Plastics/Composite
Div., SPI, 1969.
[8] M. J. Salkind, “Fatigue of Composites,” Composite Ma-
terials: Testing and Design, (2nd Conference), ASTM STP
497: American Society for Testing Materials, Anaheim,
20-22 April 1971, pp. 143-169.
[9] M. A. Miner, “Cumulative Damage in Fatigue,” Journal
of Applied Mechanics, Vol. 12, No. 3, 1945, pp. 159-164.
[10] J. A. Epaarachchi, “A Study on Estimation of Damage
Accumulation of Glass Fibre Reinforced Plastic (GFRP)
Composites under a Block Loading Situation,” Composite
Structures, Vol. 75, No. 1-4, 2006, pp. 88-92.
doi:10.1016/j.compstruct.2006.04.063
[11] S. Suresh, “Fatigue of Materials,” Cambridge University
Press, Cambridge, 1991.
[12] L. J. Broutman and S. A. Sahu, “A New Theory to Predict
Cumulative Fatigue Damage in Fiberglass Reinforced
Plastics,” Composite Materials: Testing and Design (2nd
Conference) ASTM STP 497: American Society for Test-
ing Materials, Anaheim, 20-22 April 1971, pp. 170-188.
[13] B. D. Agarwal, L. J. Broutman and K. Chandrashkhara,
“Analysis and Performance of Fiber Composites,” Wiley,
Hoboken, 2006.
[14] R. Fragoudakis, A. Saigal, G. Savaidis, et al., “Surface
Properties and Fatigue Behavior of Shot Peened Leaf
Springs,” Proceedings of the 2nd International Confer-
ence of Engineering against Fracture, Mykonos, 22-24
June 2011.
[15] R. N. Anderson, “Manufacturing Process for Production
of Composite Leaf Springs for 5-ton Truck,” Ciba-Geigy
Corporation, Fountain Valley, 1984.
[16] M. L. Aggarwal , V. P. Agrawal and R. A. Khan, “A
Stress Approach Model for Prediction of Fatigue Life by
Shot Peening of EN45A Spring Steel,” International
Journal of Fatigue, Vol. 28, No. 12, 2006, pp. 1845-1853.
doi:10.1016/j.ijfatigue.2005.12.004
[17] M. Guagliano and L. Veryani, “An Approach for Predic-
tion of Fatigue Strength of Shot Peened Components,”
Engineering Fracture Mechanics, Vol. 71, No. 4-6, 2004,
pp. 501-512. doi:10.1016/S0013-7944(03)00017-1
[18] J. B. Wheeler, et al., “Effects of Proof Test on the Str-
ength and Fatigue Life of a Unidirectional Composite,”
Fatigue of Fibrous Composite Materials, ASTM STP 723:
American Society for Testing Materials, San Francisco,
22-23 May 1979, pp. 116-132.
[19] A. S. D. Wang, P. C. Chou and J. Alper, “Effects of Proof
Copyright © 2011 SciRes. MSA
Predicting the Fatigue Life in Steel and Glass Fiber Reinforced Plastics Using Damage Models
Copyright © 2011 SciRes. MSA
604
Test on the Strength and Fatigue Life of a Unidirectional
Composite,” Interim Technical Report, Accession Num-
ber: ADA076334, 1979.
[20] D. N. P. Murthy, M. Xin and R. Jiang, “Weibull Models,”
Wiley, Hoboken, 2004.