 Low Carbon Economy, 2011, 2, 91-98 doi:10.4236/lce.2011.22012 Published Online June 2011 (http://www.SciRP.org/journal/lce) Copyright © 2011 SciRes. LCE Energy Efficiency Regulation and R&D Activity: A Study of the Top Runner Program in Japan Mitsutsugu Hamamoto Faculty of Economics, Dokkyo University, Sōka, Japan. Email: hmitutug@dokkyo.ac.jp Received March 4th, 2011; revised April 13th, 2011; accepted May 2nd, 2011. ABSTRACT The Top Runner Program, a new app roach to enhancing the energy efficien cy of appliances and vehicles, has been in- troduced in Japan. In this paper an empirical analysis of the impact of the program and the labeling systems on firms’ R&D efforts is carried out. The results show that the Top Runner Program and the labeling system for appliances led to increases in R&D expenditures by appliance producers. The program combined with the labeling system caused a 9.5% increase in appliance producers’ R&D expenditures. However, the Top Runner Program and the labeling system for motor vehicles had little or even a negative effect on the innovative activity of motor vehicle manufacturers. R&D ex- penditures by motor vehicle producers may have increased in response to th e exhau st gas regu lation for diesel-p owered vehicles rather than the energy efficien cy regulation. Keywords: Top Runner Standards, Energy Efficiency, R&D 1. Introduction As the literature on the economics of environmental pol- icy has often discussed, technological change is one of the critical factors for solving long-term environmental problems such as climate change.1 Research and devel- opment (R&D) activities by firms play a significant role in determining the rate and direction of technological change. In theory, to what extent firms’ innovative ac- tivities are spurred depends on the choice of environ- mental policy instruments, and it has been recognized that market-based instruments can provide firms with more powerful incentives to develop or adopt new pollu- tion control technologies than command-and-control regulations. Recently market-based approaches such as emission taxes and tradable permits have been introduced (Stavins [2]). To combat climate change, several member states of the European Union (EU) adopted carbon taxes in the 1990s and the EU Emissions Trading Scheme was launched in January 2005. While the introduction of market-based instruments for reducing carbon dioxide emissions makes energy efficiency investments more beneficial for consumers and firms, there are obstacles that dampen their incentives to reap gains from energy saving potentials: search and information costs of energy efficiency measures, capital market failure that prevents firms investing more energy-efficient processes, and un- certainty about the long-run value of energy savings. Stern [3] claims that regulatory measures such as per- formance-based regulations and design standards can be an effective policy response to the obstacles, showing examples of successful programs including the Corporate Average Fuel Economy (CAFE) standards in the United States and the Top Runner standards in Japan. In April 1999, the Top Runner Program, the aim of which is to reduce energy consumption in the household and transportation sectors, was introduced by a revision of the Law concerning the Rational Use of Energy. The driving force for the Japanese government to carry out this revision was the third conference of the parties to the U.N. Framework Convention on Climate Change in 1997. The conference led to the Kyoto Protocol, which com- pelled developed countries including Japan to take mea- sures for reducing greenhouse gas emissions. The Top Runner Program requires manufacturers of energy-using products to meet the Top Runner standards, which are future energy efficiency requirements based on the best performance of current technologies. The stan- dards are applied to selected groups of energy-using pro- ducts. At the start of the program, nine groups of appli- ances and vehicles such as air conditioners, cathode-ray 1For a comprehensive survey of issues related to technological change and the environment, see Jaffe et al. [1].  Energy Efficiency Regulation and R&D Activity: A Study of the Top Runner Program in Japan 92 tube television sets, video cassette recorders, and pas- senger vehicles were selected. As of April 2007, the product groups to which the Top Runner standards are applied are as follows: gasoline/diesel/LPG passenger vehicles, air conditioners, fluorescent lights, cathode-ray tube/liquid crystal display/plasma television sets, copy- ing machines, computers, magnetic disk units, diesel/ gasoline freight vehicles, video cassette recorders, DVD recorders, electric refrigerators, electric freezers, gas/oil space heaters, gas cooking appliances, gas water heaters, oil water heaters, electric toilet seats, vending machines, oil-filled/molded transformers, electric rice cookers, and microwave ovens. Under this program, the regulatory agency uses the highest efficiency of an energy-using product achieved by a manufacturer as the basis of a new energy efficiency standard for the product.2 Other manu- facturers in the market are required to meet the new (Top Runner) standard within a certain period. More specifi- cally, each firm must make sure that the weighted aver- age of energy efficiency of products included in a cate- gory the program designates meets the standard within a fixed time limit. Thus, the Top Runner Program can pro- vide firms with incentives to develop more en- ergy-efficient products which can ensure that they will comply with the standard.3 In addition, the program may have an effect on R&D activity: it is likely that firms will invest more in their R&D activities to be a ‘‘top runner’’ – the first to achieve the highest energy efficiency if it is burdensome for manufacturers except the top runner to achieve the highest efficiency established as a mandatory standard. The program might be able to provide manu- facturers with more powerful incentives to develop en- ergy-efficient products as compared with existing ap- proaches such as minimum and average energy stan- dards. There are data suggesting how effective the Top Run- ner Program has been in enhancing the energy efficiency of the products.4 A trend in electricity consumption by air conditioners illustrates the effect of the program on energy efficiency. The average annual electricity con- sumption of air conditioners was 1,068 kWh in 1999 and was cut down to 882 kWh in 2006: after the introduction of the Top Runner Program, a 17.4% reduction in elec- tricity consumption was realized. A change in the elec- tricity consumption of cathode-ray tube televisions (CRT- TVs) also suggests the effectiveness of the program. The average electric power consumption of CRT-TVs in ac- tive mode decreased gradually, and so did the average annual electricity consumption. While the average annual electricity consumption of the 1999 models is 201 kWh, the 2006 models, on average, use 144 kWh – a 28.4% reduction compared with the 1999 models. The aim of this paper is to explore whether the Top Runner Program, a new approach to enhancement of en- ergy efficiency, can promote the development of prod- ucts using less energy. More specifically, an empirical analysis is carried out in order to investigate whether the program could spur R&D activities by Japanese appli- ance and motor vehicle manufacturers. The paper is or- ganized as follows. Section 2 presents a brief review of empirical studies on the effects of energy efficiency standards or the relationship between environmental regulation and innovation. Section 3 provides the model and data that are used to measure the effect of the Top Runner Program on R&D expenditures by the Japanese manufacturers. Section 4 presents and discusses the re- sults of the empirical analysis. Section 5 offers conclud- ing remarks. 2. Related Literature There are several articles examining the impacts of en- ergy efficiency standards on the fuel economy of vehi- cles or the consumption of electricity by home appliances. In the United States, the Energy Policy and Conservation Act of 1975 established mandatory fuel economy stan- dards for automobiles and light trucks, which are known as the CAFE standards. Greene [4] shows that the stan- dards were a binding constraint for many manufacturers and were nearly twice as effective for improving fuel efficiency as gasoline prices. Goldberg [5] estimates the effects of the CAFE standards on consumers’ behavior and automobile prices and sales, combining a demand side model of vehicle choice and utilization with a supply side model of oligopoly and product differentiation. Ac- cording to the estimates, changes in fuel costs tended to shift consumers’ choices toward more fuel efficient vehi- cles, and producers primarily bore the cost of the CAFE regulation. Newell et al. [6] develop a methodology for empirical analysis of the induced innovation hypothesis to measure the effects of energy prices and government regulations on the energy efficiency of room air condi- tioners, central air conditioners, and gas water heaters. Their findings indicate that mandatory minimum effi- ciency standards and energy price changes affected the energy efficiency of these appliances, while a large por- tion of efficiency improvements were autonomous. Greening et al. [7] use the hedonic pricing method to 2The Energy Efficiency Standards Subcommittee, established under the Advisory Committee for Natural Resources and Energy (an advisory ody to the Minister of Economy, Trade and Industry), deliberates and makes decisions on the Top Runner standard setting. 3For more detailed information on the Top Runner Program, see the Energy Conservation Center, Japan (ECCJ) website at http://www.eccj.or.jp/top_runner/index_contents_e.html (accessed April 26, 2007). 4See the ECCJ website. C opyright © 2011 SciRes. LCE  Energy Efficiency Regulation and R&D Activity: A Study of the Top Runner Program in Japan93 examine the effects of efficiency standards on the qual- ity-adjusted prices of refrigerators. They show that the standards resulted in declines in the quality-adjusted prices and efficiency improvements that brought about a welfare gain for consumers. Recently empirical studies on the effects of environ- mental policy instruments on technological innovation have emerged. Some of the studies address the measure- ment of the impacts of the Clean Air Act (CAA) in the United States on technical progress in scrubbers used at power plants. Bellas [8] finds no significant technologi- cal advances in scrubber technology under the new source performance standards of the CAA. In contrast, Lange and Bellas [9] show that the sulfur dioxide (SO2) allowance trading system created by the 1990 Clean Air Act Amendments (1990 CAAA) caused reductions in the costs of purchasing and operating scrubbers. Popp [10] investigates the effects of command-and-control and market-based approaches on innovation in scrubber tech- nology using data on electric utilities before and after passage of the 1990 CAAA. He estimates the impacts of these approaches on scrubber-related patent applications, finding that while innovation under command and con- trol regime reduced the costs of operating scrubbers, the SO2 allowance trading brought about improvements in the removal efficiency of scrubbers. The results suggest that the nature of innovation may change if the choice of environmental policy instruments is altered. Debates on the relationship between environmental regulation and innovation have been developed with theoretical and empirical studies examining the Porter hypothesis (Palmer et al. [11]; Porter and van der Linde [12]; Simpson and Bradford [13]). Jaffe and Palmer [14] investigate how pollution abatement expenditures af- fected innovative activities in U.S. manufacturing indus- tries. They find that R&D expenditures significantly re- sponded to lagged pollution control costs. Brunnermeier and Cohen [15] indicate that increases in pollution abate- ment expenditures are significant determinants of envi- ronmental innovation by U.S. manufacturing industries, which is measured by the number of successful environ- mental patent applications. Hamamoto [16] employs an extended Cobb-Douglas production function in order to examine the impacts of environmental regulations on R&D spending and productivity in Japanese manufac- turing industries, showing that increases in R&D invest- ment stimulated by regulatory stringency have a signifi- cant positive effect on the growth rate of total factor pro- ductivity. 3. Estimation Model and Data Even if highly efficient products are developed, they cannot diffuse without users’ awareness of their own benefits from using them. The Top Runner Program is working with labeling systems contributing toward the diffusion of more energy-efficient appliances and motor vehicles. In 2000, the energy conservation labeling sys- tem for several categories of appliances to which the Top Runner standards are applied was launched. This labeling system provides consumers with information about to what extent appliances have achieved the standards.5 A similar system of labeling for the energy efficiency of motor vehicles was introduced in 2004. If such labeling systems are effective, the demand for products with higher efficiency will grow: consumers may put forward the date of replacing appliances or motor vehicles that are old and less efficient, or more energy-efficient prod- ucts will tend to attract environmentally conscious cus- tomers. On the other hand, the labeling systems will re- duce the demand for less efficient products because con- sumers who obtain information about the energy effi- ciency level of each product will seek to buy products with higher energy efficiency. Thus, the labeling systems are expected to provide appliance and motor vehicle producers with the incentive to develop more energy- efficient products. In order to examine the effect of the Top Runner Pro- gram and the labeling systems on R&D activity, the fol- lowing reduced form equation is estimated. ,1 ,12 3456 , ln &ln it itt TLI it RDa bSALEb SALEGROW b Db Db DbTRENDu 1 where a is a constant, R&Di,t is firm i’s R&D expenditure at time t, SALEi,t-1 represents the one-year lagged firm’s sales used as a measure of the firm size, SALEGROWt-1 is the one-year lagged growth rate of sales in the industry to which the firm belongs, DT and DL are dummy variables relevant to the Top Runner Program and the labeling system, respectively, DI is a dummy variable for the mo- tor vehicles industry, TREND represents a trend variable (treated as a linear time trend), and ui,t is a residual error term. SALEGROW does not have the form of logarithm because the data for the variable include negative num- bers. The dummy variable DT takes the value one in the years when the Top Runner Program has been imple- mented and zero in other years. Similarly, DL is defined as DL = 1 in the years when the labeling system has been introduced and DL = 0 in other years. In the estimation, two types of DL are used: DLA for the labeling system for appliances and DLV for the one for motor vehicles. Numerous empirical studies have examined the rela- tionship between firm size and innovation and found that 5For example, if a product is 20% more (less) efficient than the Top Runner standard, it has a label indicating ‘‘120% (80%)’’. Copyright © 2011 SciRes. LCE  Energy Efficiency Regulation and R&D Activity: A Study of the Top Runner Program in Japan Copyright © 2011 SciRes. LCE 94 large firms have the advantage in innovation.6 In the es- timation, SALE is used to capture the effect of the firm size on the R&D expenditure. However, exaggerated emphasis on the role of firm size in R&D may be mis- leading because the relationship between firm size and innovative activity can vary across industries which have different technological and market conditions. Cohen et al. [18] show that the effect of overall firm size on busi- ness unit R&D intensity is statistically insignificant when inter-industrial differences in technological opportunity and appropriability are taken into account. While the importance of industry characteristics such as demand conditions, appropriability, and technological opportu- nity has been acknowledged, quantitative analysis of their influence on innovative activity has inadequately been carried out partly because reliable data necessary for empirical study are unavailable.7 In this paper, de- mand conditions are measured with the one-year lagged growth rate of sales in each industry, and technological opportunity and appropriability are treated as unobserv- able industry characteristics. In the estimation, the indus- try characteristics are captured by a dummy variable DI because sample firms that were selected for the estima- tion can be categorized into two industries: the motor vehicles industry and the electrical machinery manufac- turing industry. The dummy variable takes the value one if a firm produces motor vehicles and zero otherwise. Sample selection and data sources are as follows. Be- cause the data for R&D expenditures by individual com- panies are published in their financial statements, only listed companies can be used as sample firms. In addition, R&D expenditure data for some companies are lacking for the past several years. Therefore, sample firms and years were selected based on consistency and availability of R&D expenditure data. The estimation uses a sample including thirteen Japanese firms producing air condi- tioners, fluorescent lights, cathode-ray tube television sets, copying machines, computers, magnetic disk units, video cassette recorders, electric refrigerators, and elec- tric freezers and six Japanese firms manufacturing diesel/ gasoline freight vehicles and gasoline/diesel/LPG pas- senger vehicles. The Top Runner standards have been applied to these appliances and motor vehicles since 1999. The labeling systems for appliances (air condition- ers, fluorescent lights, cathode-ray tube television sets, electric refrigerators, and electric freezers) and motor vehicles were introduced in 2000 and 2004, respectively. While the sample was selected on the basis of data availability, it includes firms that have a large share of several domestic markets for appliances and motor vehi- cles. Of the six firms manufacturing motor vehicles, four had a 68% share of the market for automobiles (except light motor vehicles) and five a 91.7% share of the mar- ket for light motor vehicles in 2005. In addition, of the thirteen firms producing appliances, five had 88.1% of the electric refrigerator market in 2006, four 56.4% of the air conditioner market in 2005, and three 47.6% of the personal computer market in 2005.8 Firm-level R&D expenditure and sales data were taken from the consolidated financial statements. The sales data for the motor vehicles and electrical machinery manufacturing industries and the R&D deflator were obtained from the Report on the Survey of Research and Development. The deflator for the household final con- sumption expenditure of durable goods in the Annual Report on National Accounts is used for deflating the sales data. The empirical test uses the data of the nine- teen firms during the period 1996-2005 (t = 1997, 1998, ··· , 2005).9 The summary statistics of main vari- ables used for estimation are presented in Table 1. 4. Results and Discussion Table 2 reports results obtained using full sample. Col- umn (1) and (2) of the table present the results of regres- sions using OLS with and without the industry dummy (DI), respectively. Column (3) displays the result of a fixed effects model that treats firm-specific effects as unobservable factors that are constant over time but vary across firms. More specifically, the model contains firm-specific dummies to capture the effects of such un- observable factors. The analysis using the fixed effects model is reasonable if we can be confident that the dif- ferences between sample firms can be viewed as para- metric shifts of the regression function. However, it is likely that firm-specific constant terms are randomly dis- tributed across firms. In such a case, it is appropriate to use a random effects model that contains a random dis- turbance to represent firm-specific effects. Column (4) of Table 2 presents the result of a regression using the ran- dom effects model. 6There are several justifications for the large firm advantage in innova- tion. First, there are scale economies in knowledge production. Second, a large volume of sales is needed in order to increase returns from R&D because the fixed costs of innovative activity are spread over the vol- ume of sales. Third, capital market imperfections necessitate holding internally-generated funds for R&D. Such funds are likely to be avail- able for large firms. Finally, large firms can afford to prepare activities complementary to R&D (such as advertising and customer service). The empirical literature has mainly explored whether R&D increases more than proportionately with firm size, finding a positive and often roportional relationship between firm size and innovative activity (Cohen [17]). As shown in Table 2, the coefficient of the Top Run- 8These market share data come from Nikkei Sangyo-Shinbun [20,21]. 9The scope of products to which the Top Runner standards are applied was extended in 2006. This paper uses the data during the period before 2006 because it aims to measure the effect of the original version of the Top Runner Program on R&D activity. 7Cohen et al. [18] and Cohen and Levinthal [19] use survey- ased measures of technological opportunity and appropriability conditions.  Energy Efficiency Regulation and R&D Activity: A Study of the Top Runner Program in Japan 95 Table 1. Summary statistics of main variables. Variable Mean Standard Deviation Description R&D 2354.02 2867.51 Firm’s R&D expenditure (108 yen) SALE 46362.12 27918.92 Firm’s sales (108 yen) SALEGROW 7.272 9.141 The growth rate of industry sales (%) DT 0.778 0.417 Dummy for the Top Runner Program DLA 0.456 0.500 Dummy for the labeling system (appliances) DLV 0.070 0.256 Dummy for the labeling system (motor vehicles) DI 0.316 0.466 Dummy for industries Table 2. Effect of the Top Runner Program: Full sample. Variable (1) OLS with DI (2) OLS without DI (3) Fixed Effects Model (4) Random Effects Model Constant –1.76656 (0.070556)*** –1.78111 (0.084149)*** –1.57845 (0.197252)*** ln(SALE) 1.13454 (0.015802)*** 1.12541 (0.018808)*** 0.876098 (0.108572)*** 1.07420 (0.045369)*** SALEGROW 0.336893E–03 (0.101252E–02) –0.102162E–02 (0.119241E–02) 0.474845E–03 (0.600851E–03) 0.266329E–03 (0.598047E–03) DT 0.056807 (0.030550)* 0.348565E–02 (0.035650) 0.042685 (0.018989)** 0.049528 (0.018165)*** DLA –0.287115E–02 (0.033042) 0.184215 (0.029094)*** –0.012131 (0.019898) 0.909417E–02 (0.019265) DLV 0.699752E-02 (0.043432) –0.013928 (0.051730) 0.011011 (0.025709) 0.634664E–02 (0.025661) DI –0.231009 (0.027528)*** TREND –0.027728 (0.630209E–02)*** –0.037766 (0.738182E–02)*** –0.016742 (0.591629E–02)*** –0.025949 (0.417749E–02)*** R-squared 0.969601 0.956468 0.990500 0.941508 Adjusted R-squared 0.968296 0.954876 0.988938 0.939368 Standard errors in parentheses. *** Significant at the 0.01 level; ** Significant at the 0.05 level; * Significant at the 0.1 level. ner dummy is positive and significant at least at the 5% level in the fixed and random effects models. In OLS with the industry dummy, the coefficient of DT is positive and significant at the 10% level, while that of OLS without DI is insignificant. An F-test is carried out and the result rejects the null hypothesis that the firm-specific effects are all equal.10 This suggests that the fixed effects model should be used rather than OLS. In addition, the Hausman test is conducted in order to make a choice between the fixed and random effects models. The result of the test is that the chi-squared statistic and p-value are 19.605 and 0.0001, respectively. This indicates that it is appropriate to adopt the fixed effects model. The coeffi- cients of the labeling system dummies (DLA and DLV) are statistically insignificant in OLS with DI and the fixed and random effects models, while OLS without DI has a significant positive coefficient of DLA. In sum, these re- sults suggest that the introduction of the Top Runner Program stimulated R&D activities performed by appli- ances and motor vehicle manufacturers and that the la- beling systems had little effect on the R&D activities. The coefficient of SALE is positive and significant at the 1% level in all of the models, which is consistent with the findings of the existing literature about the rela- tionship between firm size and R&D activity. The coeffi- cient of SALEGROW is statistically insignificant, imply- ing that the rate of sales growth in the industries may not be the prime determinant of innovation. The result in column (1) shows that the industry dummy has a significant negative coefficient. This im- plies that unobservable industry characteristics may be one of the important factors for explaining the difference of the level of R&D expenditures between appliance and motor vehicle producers. In addition, the coefficient of the Top Runner dummy is significant in OLS with DI but not significant in the one without DI. This may suggest that there is a difference in the effect of the Top Runner Program between appliance and motor vehicle manufac- 10The F statistic is 29.057, which indicates that the null hypothesis is rejected at the 1% significance level. C opyright © 2011 SciRes. LCE 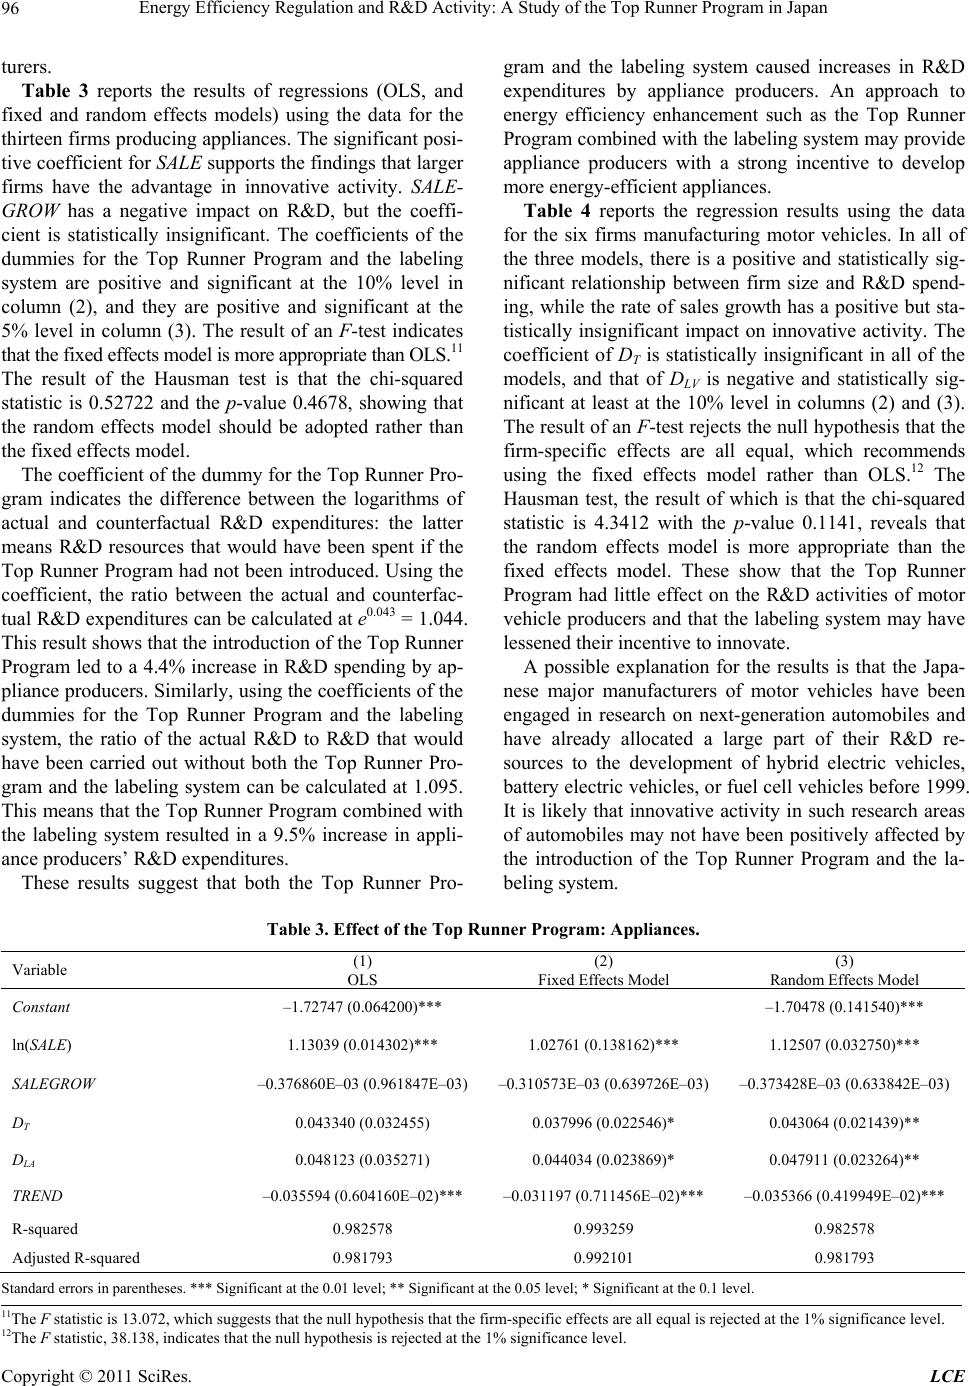 Energy Efficiency Regulation and R&D Activity: A Study of the Top Runner Program in Japan 96 turers. Table 3 reports the results of regressions (OLS, and fixed and random effects models) using the data for the thirteen firms producing appliances. The significant posi- tive coefficient for SALE supports the findings that larger firms have the advantage in innovative activity. SALE- GROW has a negative impact on R&D, but the coeffi- cient is statistically insignificant. The coefficients of the dummies for the Top Runner Program and the labeling system are positive and significant at the 10% level in column (2), and they are positive and significant at the 5% level in column (3). The result of an F-test indicates that the fixed effects model is more appropriate than OLS.11 The result of the Hausman test is that the chi-squared statistic is 0.52722 and the p-value 0.4678, showing that the random effects model should be adopted rather than the fixed effects model. The coefficient of the dummy for the Top Runner Pro- gram indicates the difference between the logarithms of actual and counterfactual R&D expenditures: the latter means R&D resources that would have been spent if the Top Runner Program had not been introduced. Using the coefficient, the ratio between the actual and counterfac- tual R&D expenditures can be calculated at e0.043 = 1.044. This result shows that the introduction of the Top Runner Program led to a 4.4% increase in R&D spending by ap- pliance producers. Similarly, using the coefficients of the dummies for the Top Runner Program and the labeling system, the ratio of the actual R&D to R&D that would have been carried out without both the Top Runner Pro- gram and the labeling system can be calculated at 1.095. This means that the Top Runner Program combined with the labeling system resulted in a 9.5% increase in appli- ance producers’ R&D expenditures. These results suggest that both the Top Runner Pro- gram and the labeling system caused increases in R&D expenditures by appliance producers. An approach to energy efficiency enhancement such as the Top Runner Program combined with the labeling system may provide appliance producers with a strong incentive to develop more energy-efficient appliances. Table 4 reports the regression results using the data for the six firms manufacturing motor vehicles. In all of the three models, there is a positive and statistically sig- nificant relationship between firm size and R&D spend- ing, while the rate of sales growth has a positive but sta- tistically insignificant impact on innovative activity. The coefficient of DT is statistically insignificant in all of the models, and that of DLV is negative and statistically sig- nificant at least at the 10% level in columns (2) and (3). The result of an F-test rejects the null hypothesis that the firm-specific effects are all equal, which recommends using the fixed effects model rather than OLS.12 The Hausman test, the result of which is that the chi-squared statistic is 4.3412 with the p-value 0.1141, reveals that the random effects model is more appropriate than the fixed effects model. These show that the Top Runner Program had little effect on the R&D activities of motor vehicle producers and that the labeling system may have lessened their incentive to innovate. A possible explanation for the results is that the Japa- nese major manufacturers of motor vehicles have been engaged in research on next-generation automobiles and have already allocated a large part of their R&D re- sources to the development of hybrid electric vehicles, battery electric vehicles, or fuel cell vehicles before 1999. It is likely that innovative activity in such research areas of automobiles may not have been positively affected by the introduction of the Top Runner Program and the la- beling system. Table 3. Effect of the Top Runner Program: Appliances. Variable (1) OLS (2) Fixed Effects Model (3) Random Effects Model Constant –1.72747 (0.064200)*** –1.70478 (0.141540)*** ln(SALE) 1.13039 (0.014302)*** 1.02761 (0.138162)*** 1.12507 (0.032750)*** SALEGROW –0.376860E–03 (0.961847E–03)–0.310573E–03 (0.639726E–03)–0.373428E–03 (0.633842E–03) DT 0.043340 (0.032455) 0.037996 (0.022546)* 0.043064 (0.021439)** DLA 0.048123 (0.035271) 0.044034 (0.023869)* 0.047911 (0.023264)** TREND –0.035594 (0.604160E–02)*** –0.031197 (0.711456E–02)*** –0.035366 (0.419949E–02)*** R-squared 0.982578 0.993259 0.982578 Adjusted R-squared 0.981793 0.992101 0.981793 Standard errors in parentheses. *** Significant at the 0.01 level; ** Significant at the 0.05 level; * Significant at the 0.1 level. 11The F statistic is 13.072, which suggests that the null hypothesis that the firm-specific effects are all equal is rejected at the 1% significance level. 12The F statistic, 38.138, indicates that the null hypothesis is rejected at the 1% significance level. C opyright © 2011 SciRes. LCE  Energy Efficiency Regulation and R&D Activity: A Study of the Top Runner Program in Japan97 Table 4. Effect of the Top Runner Program: Motor vehicles. Variable (1) OLS (2) Fixed Effects Model (3) Random Effects Model Constant –2.15986 (0.238263)*** –1.29809 (0.473024)*** ln(SALE) 1.15951 (0.053187)*** 0.722204 (0.157512)*** 0.963094 (0.107068)*** SALEGROW 0.104954E–02 (0.296589E–02) 0.112260E–02 (0.134443E–02) 0.108235E–02 (0.134429E–02) DT 0.514743E–02 (0.079802) –0.020438 (0.037296) –0.634453E–02 (0.036678) DLV –0.076269 (0.081935) –0.069923 (0.037203)* –0.073418 (0.037165)** TREND –0.746177E–02 (0.019722) 0.011436 (0.011187) 0.102619E–02 (0.010011) R-squared 0.911265 0.983672 0.909977 Adjusted R-squared 0.902022 0.979875 0.900599 Standard errors in parentheses. *** Significant at the 0.01 level; ** Significant at the 0.05 level; * Significant at the 0.1 level. R&D activity in the motor vehicles industry will be affected by exhaust gas regulations. In the late 1990s, the Environment Agency of Japan planed to tighten the regu- lation for the emission of pollutants from diesel-powered vehicles. In 2000, the Director-General of the agency requested motor vehicle manufacturers to devote their efforts to developing exhaust gas control technologies in order for the new emission standards to be met as soon as possible (Environment Agency [22]). In order to examine the effect of this regulatory agency behavior on the in- novative activity of motor vehicle producers, a dummy variable, DR, is used instead of DT and DLV in the regres- sion analysis for motor vehicles: DR takes the value one in the years after 2001 and zero in other years. Table 5 reports the results.13 The coefficient of DR indicates that the ratio of the actual R&D to R&D that would have Table 5. Effect of the exhaust gas regulation. Variable Fixed Effects Model Random Effects Model Constant –1.12408 (0.448734)** ln(SALE) 0.706778 (0.143515)*** 0.935878 (0.102029)*** SALEGROW 0.288737E–03 (0.137340E–02) 0.161045E–03 (0.137225E–02) DR 0.096743 (0.037976)** 0.101238 (0.037925)*** TREND –0.013601 (0.880800E–02) –0.022963 (0.778272E–02)*** R-squared 0.984527 0.909794 Adjusted R-s uared 0.981362 0.902430 Standard errors in parentheses. *** Significant at the 0.01 level; ** Sig- nificant at the 0.05 level. been carried out without the new emission standards for diesel-powered vehicles is 1.1, suggesting that motor vehicle producers increased their R&D expenditures by 10% in order to comply with the standards. 5. Conclusions This paper investigates the effect of a new approach to enhancing energy efficiency on firms’ R&D efforts. An empirical analysis is conducted in order to examine the impact of the Top Runner Program and the labeling sys- tems on the R&D activities of Japanese appliance and motor vehicle manufacturers. The results show that the program and the labeling system for appliances had sig- nificant effects on the innovative activity of appliance producers. The Top Runner Program combined with the labeling system caused a 9.5% increase in appliance producers’ R&D expenditures. However, the program and the labeling system for motor vehicles had little or even a negative effect on the innovative activity of motor vehicle producers, whose R&D expenditures may have increased in response to the exhaust gas regulation for diesel-powered vehicles. The results of the empirical study imply that the effec- tiveness of an energy efficiency regulation such as the Top Runner Program may depend on the directions of research activities performed by firms manufacturing products to which the regulation is applied. The Top Runner standards for the fuel efficiency of motor vehi- cles may be ineffective in spurring research activity to develop next-generation automobiles. Encouragement of innovative activity with high-spillovers or serious diffi- culty in financing, such as the development of next-ge- neration automobiles, may need technology policy in- cluding R&D subsidies, or other institutional settings to promote environmental R&D activity. 13The result of the Hausman test is that the chi-squared statistic is 5.1525 and the p-value 0.0232, indicating that the fixed effects model should be adopted rather than the random effects model. Copyright © 2011 SciRes. LCE  Energy Efficiency Regulation and R&D Activity: A Study of the Top Runner Program in Japan 98 REFERENCES [1] A. B. Jaffe, R. G. Newell and R. N. Stavins, “Techno- logical Change and the Environment,” In: K.-G. Maler and J. R. Vincent, Eds., Handbook of Environmental Eco- nomics, Vol. 1, North-Holland Publishing, Amsterdam, 2003, pp. 461-516. [2] R. N. Stavins, ‘‘Experience with Market-Based Environ- mental Policy Instruments,’’ In: K.-G. Maler and J. R. Vincent, Eds., Handbook of Environmental Economics, Vol. 1, North-Holland Publishing, Amsterdam, 2003, pp. 355-435. [3] N. Stern, “The Economics of Climate Change: The Stern Review,” Cambridge University Press, New York, 2007. [4] D. L. Greene, “CAFE or price? An Analysis of the Ef- fects of Federal Fuel Economy Regulations and Gasoline Price on New Car MPG, 1978-1989,” Energy Journal, Vol. 11, No. 3, 1990, pp. 37-57. [5] P. K. Goldberg, “The Effects of the Corporate Average Fuel Efficiency Standards in the US,” Journal of Indus- trial Economics, Vol. 46, No. 1, 1998, pp. 1-33. doi:10.1111/1467-6451.00059 [6] R. G. Newell, A. B. Jaffe and R. N. Stavins, “The In- duced Innovation Hypothesis and Energy-Saving Tech- nological Change,” Quarterly Journal of Economics, Vol. 114, No. 3, 1999, pp. 941-975. doi:10.1162/003355399556188 [7] L. A. Greening, A. H. Sanstad and J. E. McMahon, “Ef- fects of Appliance Standards on Product Price and Attrib- utes: A Hedonic Pricing Model,” Journal of Regulatory Economics, Vol. 11, No. 2, 1997, pp. 181-194. doi:10.1023/A:1007906300039 [8] A. S. Bellas, “Empirical Evidence of Advances in Scrub- ber Technology,” Resource and Energy Economics, Vol. 20, No. 4, 1998, pp. 327-343. doi:10.1016/S0928-7655(97)00039-0 [9] I. Lange and A. Bellas, “Technological Change for Sulfur Dioxide Scrubbers under Market-Based Regulation,” Land Economics, Vol. 81, No. 4, 2005, pp. 546-556. [10] D. Popp, “Pollution Control Innovations and the Clean Air Act of 1990,” Journal of Policy Analysis and Man- agement, Vol. 22, 2003, pp. 641-660. doi:10.1002/pam.10159 [11] K. Palmer, W. E. Oates and P. R. Portney, “Tightening Environmental Standards: The Benefit-Cost or the No-Cost Paradigm?” Journal of Economic Perspectives, Vol. 9, No. 4, 1995, pp. 119-132. [12] M. E. Porter and C. van der Linde, “Toward a New Con- ception of the Environment-Competitiveness Relation- ship,” Journal of Economic Perspectives, Vol. 9, No. 4, 1995, pp. 97-118. [13] R. D. Simpson and R. L. Bradford III, “Taxing Variable Cost: Environmental Regulation as Industrial Policy,” Journal of Environmental Economics and Management, Vol. 30, No. 3, 1996, pp. 282-300. doi:10.1006/jeem.1996.0019 [14] A. B. Jaffe and K. Palmer, “Environmental Regulation and Innovation: A Panel Data Study,” Review of Eco- nomics and Statistics, Vol. 79, No .4, 1997, pp. 610-619. doi:10.1162/003465397557196 [15] S. B. Brunnermeier and M. A. Cohen, “Determinants of Environmental Innovation in US Manufacturing Indus- tries,” Journal of Environmental Economics and Man- agement, Vol. 45, No. 2, 2003, pp. 278-293. doi:10.1016/S0095-0696(02)00058-X [16] M. Hamamoto, “Environmental Regulation and the Pro- ductivity of Japanese Manufacturing Industries,” Re- source and Energy Economics, Vol. 28, No. 4, 2006, pp. 299-312. doi:10.1016/j.reseneeco.2005.11.001 [17] W. M. Cohen, “Empirical Studies of Innovative Activ- ity,” In: P. Stoneman, Ed., Handbook of the Economics of Innovation and Technological Change, Blackwell, Ox- ford, 1995, pp. 182-264. [18] W. M. Cohen, R. C. Levin and D. C. Mowery, “Firm Size and R&D Intensity: A Re-Examination,” Journal of In- dustrial Economics, Vol. 35, No. 4, 1987, pp. 543-565. doi:10.2307/2098587 [19] W. M. Cohen and D. A. Levinthal, “Innovation and Learning: The Two Faces of R&D,” Economic Journal, Vol. 99, No. 397, 1989, pp. 569-596. doi:10.2307/2233763 [20] Nikkei Sangyo-Shinbun, “Nikkei Shijo-Senyuritsu 2007 (Nikkei Market Share 2007),” in Japanese, Nikkei Inc., Tokyo, 2006. [21] Nikkei Sangyo-Shinbun, “Nikkei Shijo-Senyuritsu 2008 (Nikkei Market Share 2008),” in Japanese, Nikkei Inc., Tokyo, 2007. [22] Environment Agency, “White Paper on the Environment 2000,” in Japanese, The Government of Japan, 2000. C opyright © 2011 SciRes. LCE
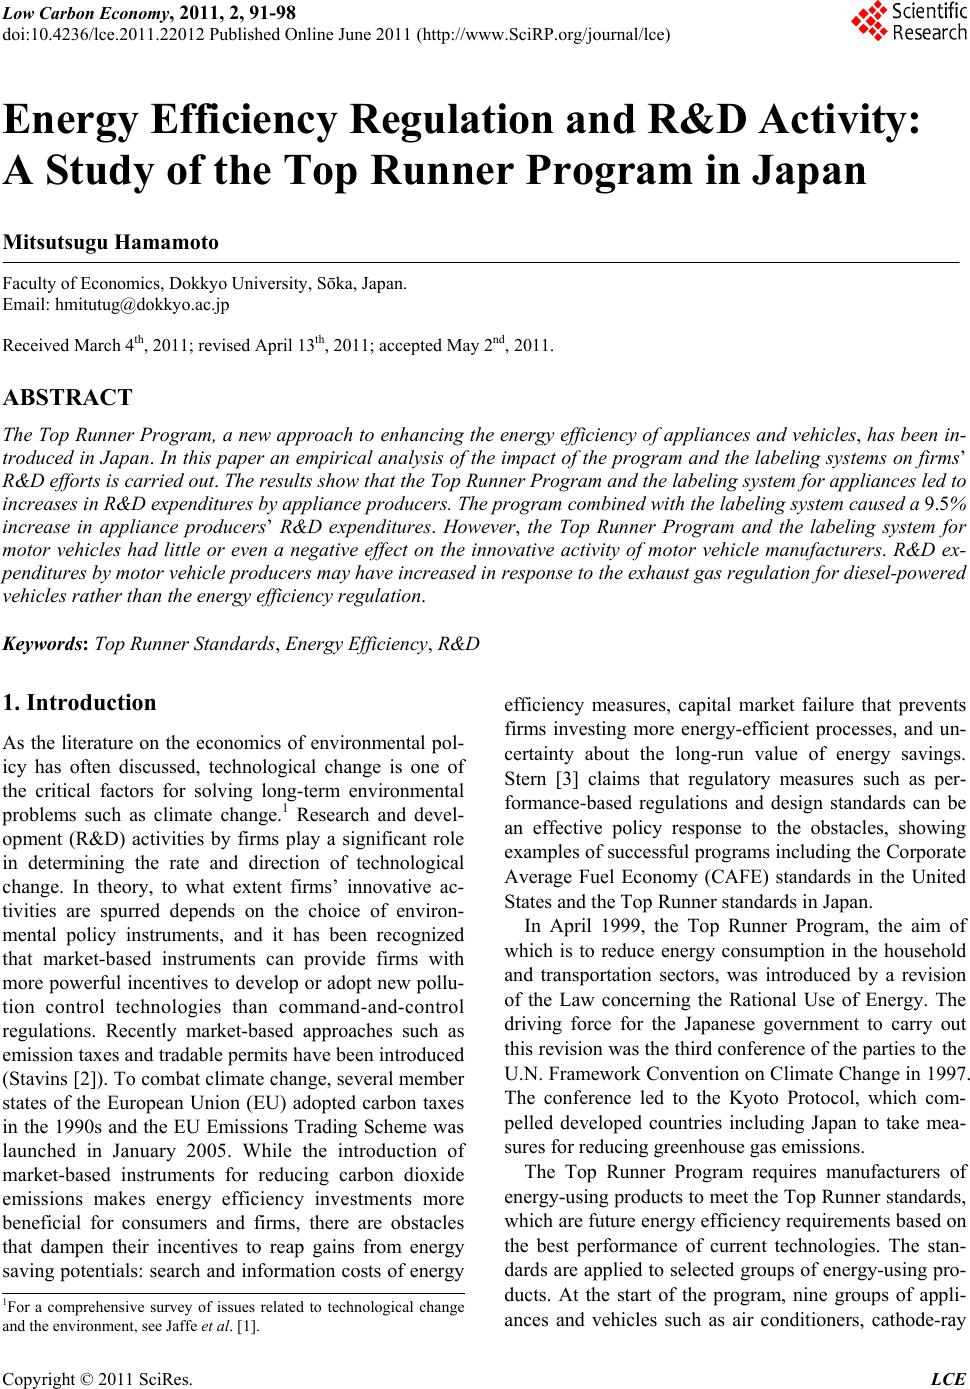
|