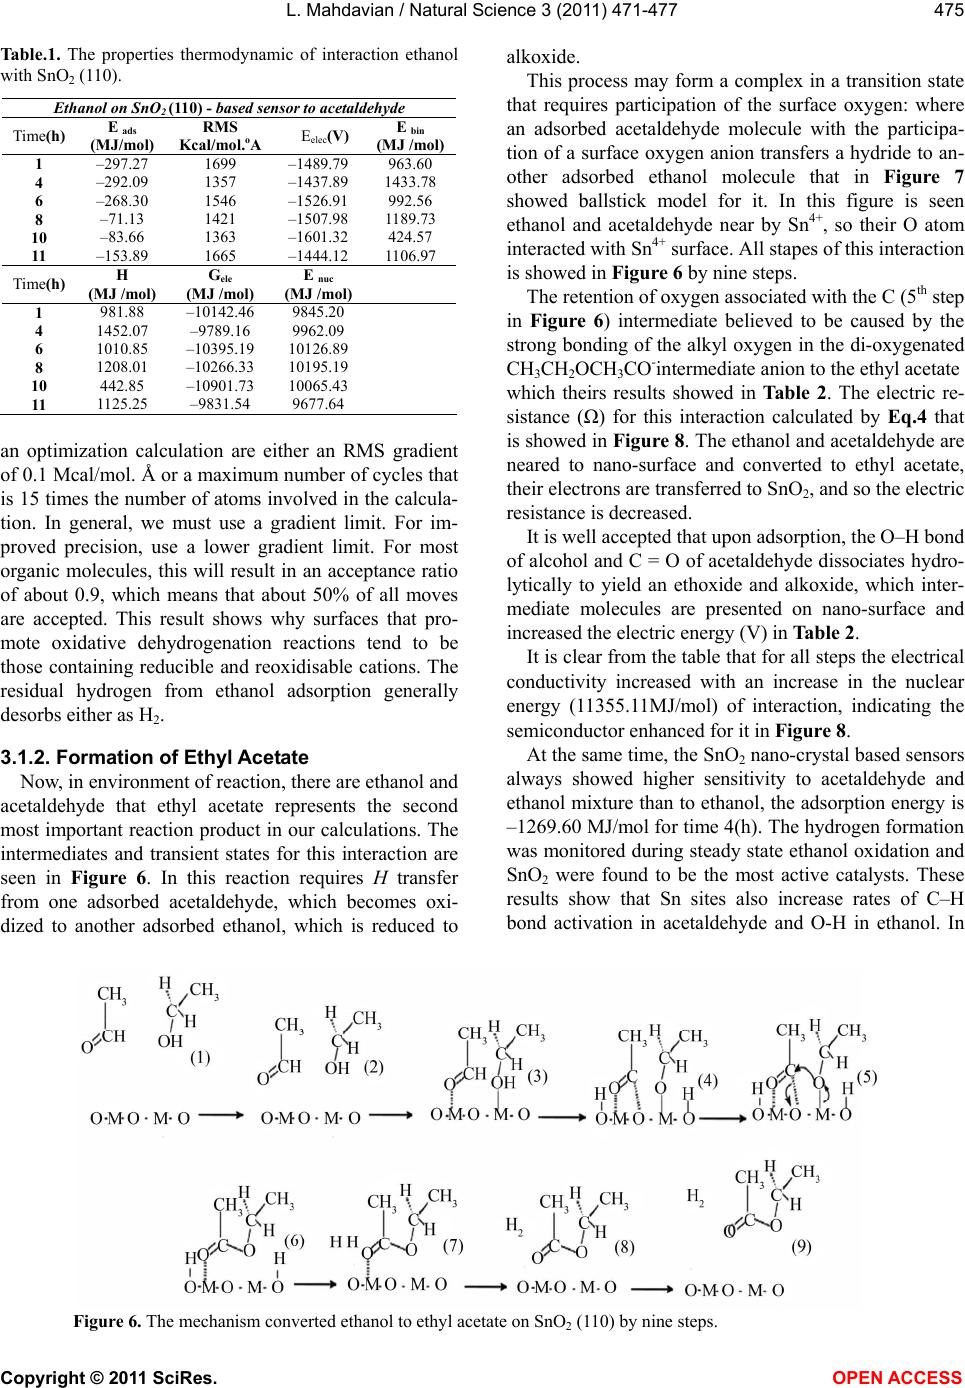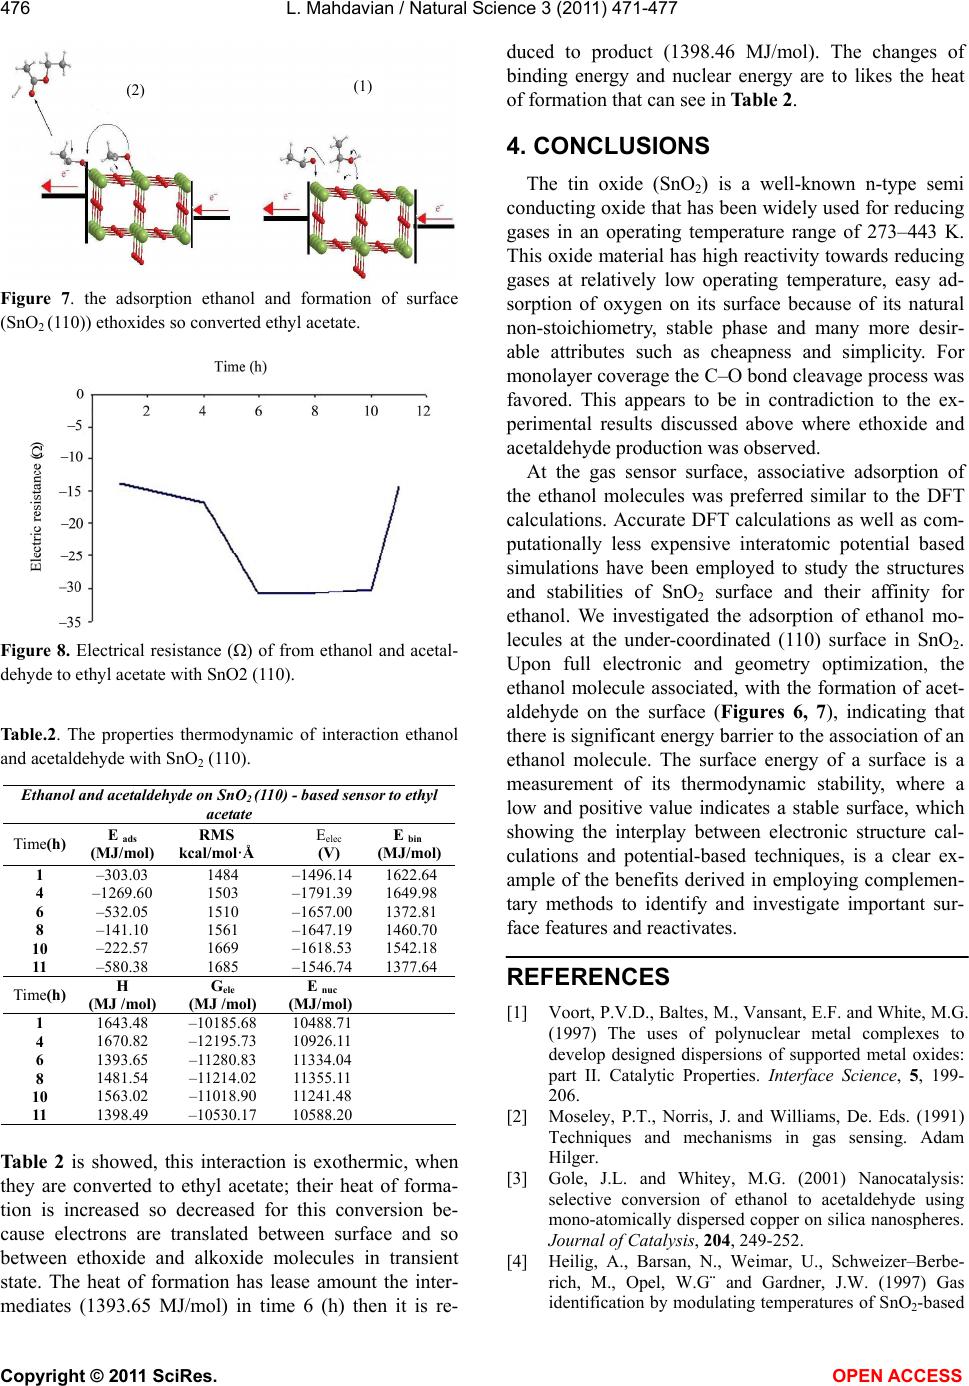
L. Mahdavian / Natural Science 3 (2011) 471-477
Copyright © 2011 SciRes. OPEN ACCESS
477
thick film sensors. Sensors and Actuators B: Chemical,
43, 45-51. doi:10.1016/S0925-4005(97)00096-8
[5] Jaegle, M., ollenstein, J.W¨., Meisinger, T., B¨ottner, H.,
M¨uller, G., Becker, Th. and Braunm¨uhl, C.B.V. (1999)
Micromachined thin film gas sensors in temperature
pulsed operation mode. Sensors and Actuators B: Chemi-
cal, 57, 130-134. doi:10.1016/S0925-4005(99)00074-X
[6] Faglia, G. (1998) Michromachined gas sensors operated
by fast pulsed temperature mode for environmental
pollutants. Proceedings 6th Micro Systems Technologies,
VDE-Verlag, Berlin, pp. S703-S705.
[7] Hellmich, W., M¨uller, G., Braunm¨uhl, Ch.B.V., Doll, T.
and Eisele, I. (1997) Field effect-induced gas sensitivity
changes in metal oxides. Sensors and Actuators B:
Chemical, 43, 132-139.
doi:10.1016/S0925-4005(97)00195-0
[8] Idriss, H. (2004) Ethanol Reactions over the Surfaces of
Noble Metal/Cerium Oxide Catalysts. Platinum Metals
Rev, 48,105-115. doi:10.1595/147106704X1603
[9] DMol3 and CASTEP. Molecular Simulations, San Diego.
1998.
[10] Rantala, T.T., Rantalab, T.S. and Lantto, V. (2000)
Electronic structure of SnO2 (110) surface. Materials
Science in Semiconductor Processing, 3, 103-107.
doi:10.1016/S1369-8001(00)00021-4
[11] Gobernado-Mitre, I., Klassen, B., Aroca, R and DeSaja, J.
A. (2005) Vibrational spectra and structure of perchlori-
nated metal-free phthalocyanine and lutetium bisphthalo-
cyanine. Journal of Raman Spectroscopy, 24, 903-908.
[12] Zverev, V.V., Islamov, R.G., Islamova, F.K. and Vakar,
V.M. (1989) Photoelectron spectrum and quantum-
chemical structural analysis of N-methyl-N-methoxydia-
zene-N-oxide. Journal of Structural Chemistry, 30, 228-
233.
[13] Tiana, G., Sutto, L and Broglia, R.A. (2007) Statistical
mechanics and its applications. Physical: A, 380, 241-
251.
[14] Mahdavian, L., Monajjemi, M. and Mangkorntong, N.
(2009) Sensor response to alcohol and chemical mecha-
nism of carbon nanotube gas sensors. Fullerenes, Nano-
tubes and Carbon Nanostructures, 17, 484-495.
doi:10.1080/15363830903130044
[15] Mangkorntong, N., Mahdavian, L., Mollaamin, F. and
Monajjemi, M. (2008) Sensing of methanol and ethanol
with nano-structured SnO2 (110) in gas phase: monte
carlo simulation. Journal of Physical and Theoretical
Chemistry (IAU.Iran), 4, 197-203.
[16] Bolzan, A.A., Fong, C., Kennedy, B.J. and Howard, C.J.
(1997) Flame spray synthesis of tin dioxide nanoparticles
for gas sensing. Acta Crystallographica Section B: Struc-
tural Science, 53, 373-380.
doi:10.1107/S0108768197001468
[17] Wang, N., Lin, H., Li, J., Zhang, L., Li, X., Wu, J. and
Lin, Ch. (2003) Strong orange luminescence from a
novel hexagonal ZnO nanosheet film grown on alumi-
num substrate by a simple wet-chemical approach. Jour-
nal of the American Ceramic Society, 90, 635-637.
doi:10.1111/j.1551-2916.2006.01418.x
[18] Oviedo, J. and Gillan, M.J. (2000) Energetics and
structure of stoichiometric. SnO2 surfaces studied by
first-principles calculations. Surface Science, 463, 93-
101. doi:10.1016/S0039-6028(00)00612-9
[19] Mulheran, P.A. and Harding, J.H. (1992) The stability of
SnO2 surfaces. Modelling and Simulation in Materials
Science and Engineering, 1, 39-43.
doi:10.1088/0965-0393/1/1/004
[20] Slater, B., Catlow, C.R., Gay, D.H., Williams, D.E. and
Dusastre, V. (1999) Study of surface segregation of
antimony on SnO2 surfaces by computer simulation
tehniques. The Journal of Physical Chemistry B, 103,
10644-10650. doi:10.1021/jp9905528
[21] Li, J., Lu, Y., Ye, Q., Cinke, M., Han, J. and Yyappan,
M.Me. (2003) Carbon nanotube sensors for gas and
organic vapor detection. NanoLetters, 3, 929-933.
doi:10.1021/nl034220x
[22] Liu, M., Shi, G., Zhang, L., Zhao, G. and Jin, L. (2008)
Electrode modified with toluidine blue-doped silica na-
noparticles, and its use for enhanced amperometric
sensing of hemoglobin. Analytical Biochemistry, 391,
1951-1959.
[23] Fu, Q. and Liu, J. (2005) integrated single-walled carbon
nanotube/microfluidic devices for the study of the sens-
ing mechanism of nanotube sensors. The Journal of
Physical Chemistry B, 109, 13406-13408.
doi:10.1021/jp0525686