Paper Menu >>
Journal Menu >>
 Journal of Environmental Protection, 2011, 2, 435-444 doi: 10.4236/jep.2011.24050 Published Online June 2011 (http://www.SciRP.org/journal/jep) Copyright © 2011 SciRes. JEP 435 Ground Water in Certain Sites in Egypt and Its Treatments Using a New Modified Ion Exchange Resin —Characterization of Water and Modified Ion Exchange Nariman H. Kamel1, AlSaid M. Sayyah2, Ahmed A. Abdel-aal1 1Radiation Protection Department, Nuclear Research Center, Atomic Energy Authority, Cairo, Egypt. 2Faculty of Science at Beni-Suef University, Beni Suef, Egypt. Email: Narimankamel@hotmail.com Received January 12th, 2011; revised February 22nd, 2011; accepted March 29th, 2011. ABSTRACT The present work is a comprehensive of drinking water quality. Eleven groundwater samples were taken from various rural regions of Egypt, the groundwater samples were investigated for chemical, radiometric and heavy metals analyses, the major cations including; sodium ( N a), potassium (K ), calcium (2 Ca ) and ma gnesium () ions species, the major anions of chloride ( 2 Mg Cl ), sulphate (2 4 SO ), nitrite (2 NO ), phosphate (3 4 PO ). Radiometric analyses in water expressed as the gross alpha and beta activity concentrations, heavy metals analyses including arsenic (3 As ), lead (), cobalt (), manganese (), iron ( 2 Pb 2 Co 2 Mn 3 Fe ) and cadmium (2 Cd ) ions. The groundwater samples were found to contain high concentrations of heavy metals than the limited values of the world health organization (WHO). Heavy metals speciation were performed using MinteqA2 geochemical code. A modified exchange resin was prepared by polymerization of the condensed dioxalayl p-sulphanilamide with phenol, this ion exchange resin was examined by the different techniques such as; x-ray diffraction, infra red spectra (IR), and electronic microscopic, it was found a good adsor bent material th at used for the reductio n of heavy metals fro m contaminated groundwat er s am pl es . Keywords: Ion Exchange, Groundwater, Heavy Metals, Sorpt i on 1. Introduction Heavy metals and radionuclides can enter into surface and groundwater from a variety sources, Water pollution is thus a consumpolitan problem that need urgent atten- tion [1-4]. large amount of heavy metals and radionu- clides can introduced into water body through untreated and treated liquid wastes. The origin of heavy metals contamination in drinking water lies in the illegal dis- posal of industrial effluents, which eventually find their way into underground aquifers. It is expected that con- centration of heavy metals in drinking water will increase and their removal will be needed a great effort in future. Various treatment have been employed to reduce heavy metals from aqueous solutions. Conventional techniques usually involve application of various process such as precipitation, filtration solvent extraction and ion ex- change [5]. Cation exchange resin is to be useful for the removal small concentrations of heavy metals from aqueous solutions. A number of investigators have been used ion exchange materials for the removal of inorganic metal ions such as Pb, Cu, Zn, Cd and Ni from aqueous solutions [5-8]. The purpose of the present study is to give characterization of groundwater samples at certain region in Egypt, and to clean up these contaminated groundwater samples that may be used for human con- sumer by using a synthetic ion exchange resin. 2. Materials and Methods 2.1. Chemicals and Apparatus All chemical reagents are used in the experimental work are analytical grade. Inductive couple plasma, atomic emission spectrometry (ICP-AES) apparatus (France) is installed at the chemical laboratory, Second Research Reactor, Atomic Energy Authority, Egypt. Low back- 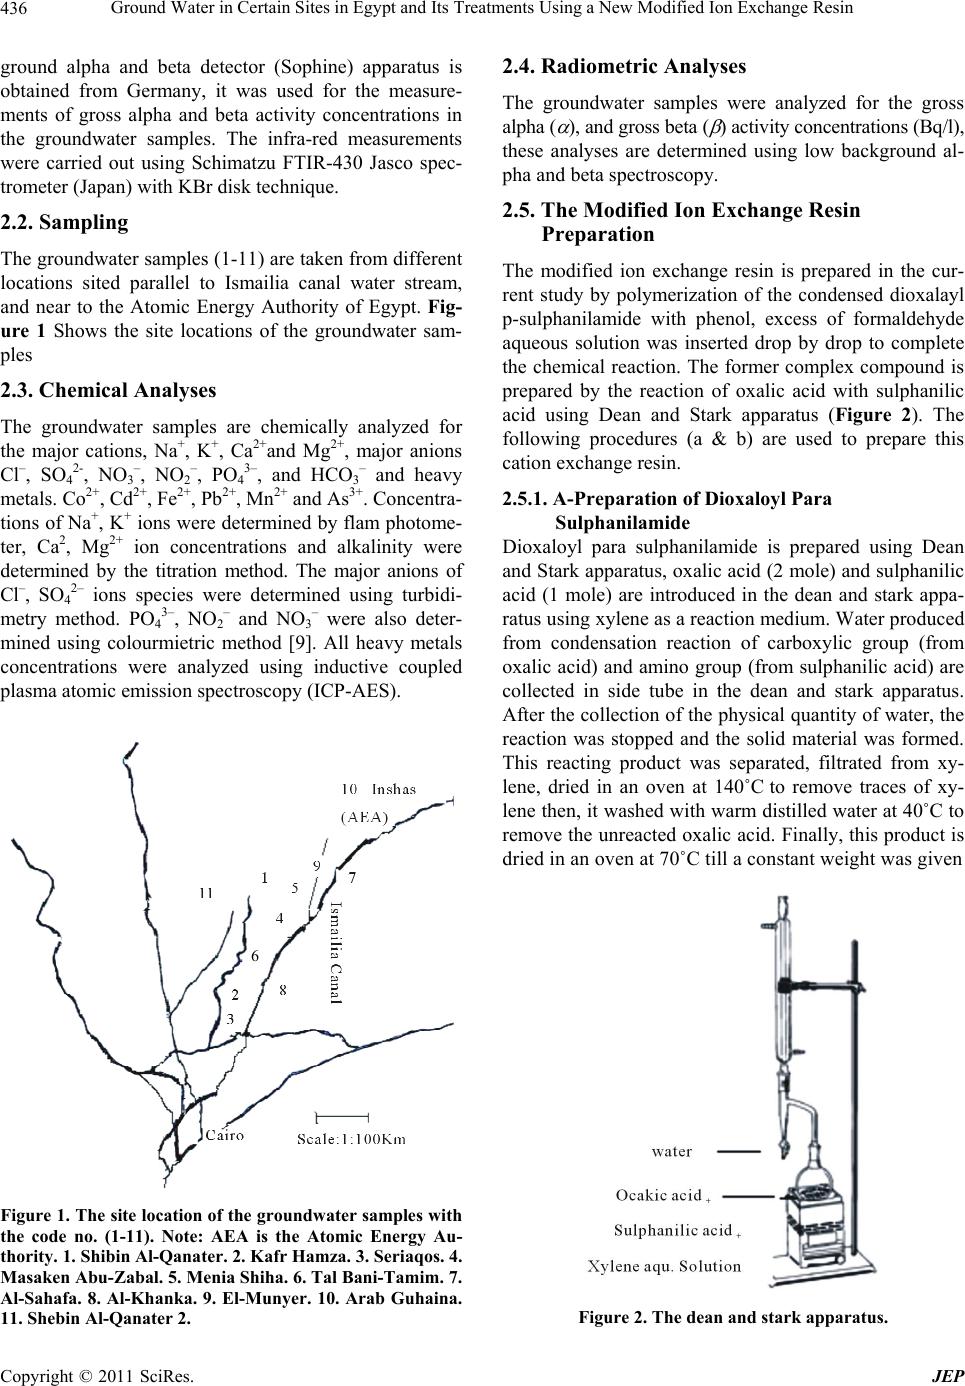 Ground Water in Certain Sites in Egypt and Its Treatments Using a New Modified Ion Exchange Resin 436 ground alpha and beta detector (Sophine) apparatus is obtained from Germany, it was used for the measure- ments of gross alpha and beta activity concentrations in the groundwater samples. The infra-red measurements were carried out using Schimatzu FTIR-430 Jasco spec- trometer (Japan) with KBr disk technique. 2.2. Sampling The groundwater samples (1-11) are taken from different locations sited parallel to Ismailia canal water stream, and near to the Atomic Energy Authority of Egypt. Fig- ure 1 Shows the site locations of the groundwater sam- ples 2.3. Chemical Analyses The groundwater samples are chemically analyzed for the major cations, Na+, K+, Ca2+and Mg2+, major anions Cl–, SO42-, NO3–, NO2–, PO43–, and HCO3– and heavy metals. Co2+, Cd2+, Fe2+, Pb2+, Mn2+ and As3+. Concentra- tions of Na+, K+ ions were determined by flam photome- ter, Ca2, Mg2+ ion concentrations and alkalinity were determined by the titration method. The major anions of Cl–, SO42– ions species were determined using turbidi- metry method. PO43–, NO2– and NO3– were also deter- mined using colourmietric method [9]. All heavy metals concentrations were analyzed using inductive coupled plasma atomic emission spectroscopy (ICP-AES). 6 Figure 1. The site location of the groundwater samples with the code no. (1-11). Note: AEA is the Atomic Energy Au- thority. 1. Shibin Al-Qanater. 2. Kafr Hamza. 3. Seriaqos. 4. Masaken Abu-Zabal. 5. Menia Shiha. 6. Tal Bani-Tamim. 7. Al-Sahafa. 8. Al-Khanka. 9. El-Munyer. 10. Arab Guhaina. 11. Shebin Al-Qanater 2. 2.4. Radiometric Analyses The groundwater samples were analyzed for the gross alpha ( ), and gross beta ( ) activity concentrations (Bq/l), these analyses are determined using low background al- pha and beta spectroscopy. 2.5. The Modified Ion Exchange Resin Preparation The modified ion exchange resin is prepared in the cur- rent study by polymerization of the condensed dioxalayl p-sulphanilamide with phenol, excess of formaldehyde aqueous solution was inserted drop by drop to complete the chemical reaction. The former complex compound is prepared by the reaction of oxalic acid with sulphanilic acid using Dean and Stark apparatus (Figure 2). The following procedures (a & b) are used to prepare this cation exchange resin. 2.5.1. A-Preparation of Dioxaloyl Para Sulphanilamide Dioxaloyl para sulphanilamide is prepared using Dean and Stark apparatus, oxalic acid (2 mole) and sulphanilic acid (1 mole) are introduced in the dean and stark appa- ratus using xylene as a reaction medium. Water produced from condensation reaction of carboxylic group (from oxalic acid) and amino group (from sulphanilic acid) are collected in side tube in the dean and stark apparatus. After the collection of th e physical quantity of water, the reaction was stopped and the solid material was formed. This reacting product was separated, filtrated from xy- lene, dried in an oven at 140˚C to remove traces of xy- lene then, it washed with warm distilled water at 40˚C to remove the unreacted oxalic acid. Finally, this product is dried in an oven at 70˚C till a constant weight was given Figure 2. The dean and stark apparatus. Copyright © 2011 SciRes. JEP 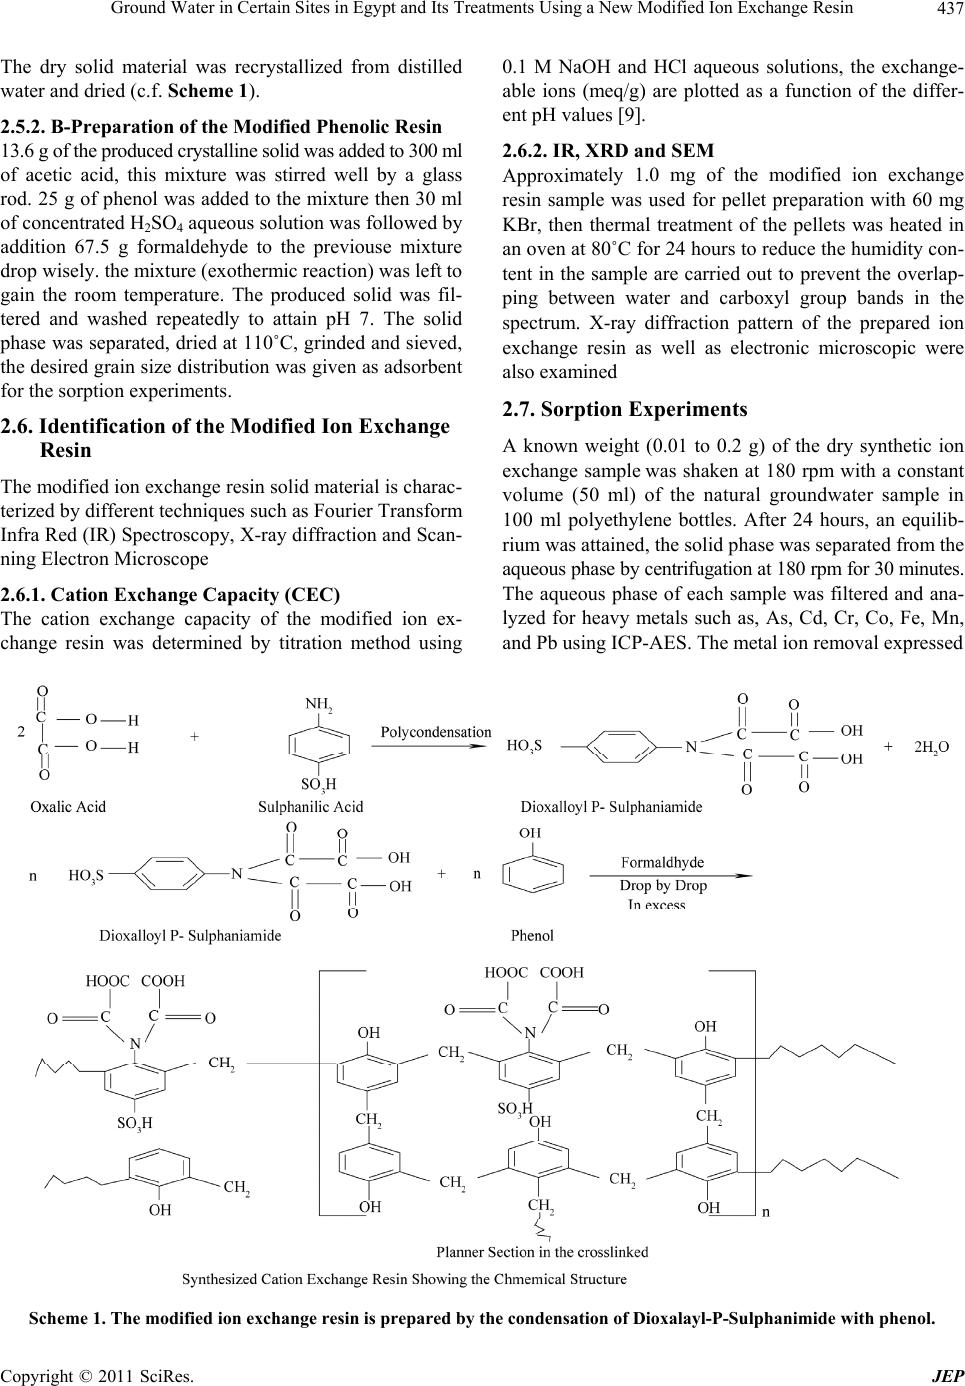 Ground Water in Certain Sites in Egypt and Its Treatments Using a New Modified Ion Exchange Resin Copyright © 2011 SciRes. JEP 437 0.1 M NaOH and HCl aqueous solutions, the exchange- able ions (meq/g) are plotted as a function of the differ- ent pH values [9]. The dry solid material was recrystallized from distilled water and dried (c.f. Scheme 1). 2.5.2. B-Preparation of the Modified Phenolic Resin 2.6.2. IR, XRD and SEM 13.6 g of the produced crystalline solid was added to 300 ml of acetic acid, this mixture was stirred well by a glass rod. 25 g of phenol was added to the mixture then 30 ml of concentrated H2SO4 aqueous solution was followed by addition 67.5 g formaldehyde to the previouse mixture drop wisely. t he mixt ur e (e xo t h er mic re ac tion) was l e f t to gain the room temperature. The produced solid was fil- tered and washed repeatedly to attain pH 7. The solid phase was separated, dried at 110˚C, grinded and sieved, the desired grain size distribution was given as adsorbent for the sorption experiments. Approximately 1.0 mg of the modified ion exchange resin sample was used for pellet preparation with 60 mg KBr, then thermal treatment of the pellets was heated in an oven at 80˚C for 24 hours to reduce the humidity con- tent in the sample are carried out to prevent the overlap- ping between water and carboxyl group bands in the spectrum. X-ray diffraction pattern of the prepared ion exchange resin as well as electronic microscopic were also examined 2.7. Sorption Experiments 2.6. Identification of the Modified Ion Exchange Resin A known weight (0.01 to 0.2 g) of the dry synthetic ion exchange sample was shaken at 180 rpm with a constant volume (50 ml) of the natural groundwater sample in 100 ml polyethylene bottles. After 24 hours, an equilib- rium was attained, the solid phase was separated from the aqueous phase by centrifugation at 180 rpm for 30 minutes. The aqueous phase of each sample was filtered and ana- lyzed for heavy metals such as, As, Cd, Cr, Co, Fe, Mn, and Pb using ICP-AES. The metal ion removal expressed The modified ion exchange resin solid material is charac- terized by different techniques such as Fourier Transform Infra Red (IR) Spectroscopy, X-ray diffraction and Scan- ning Electron Microscope 2.6.1. Cation Exchange Capacity (CEC) The cation exchange capacity of the modified ion ex- change resin was determined by titration method using Scheme 1. The modified ion exchange resin is prepared by the condensation of Dioxalayl-P-Sulphanimide with phenol. 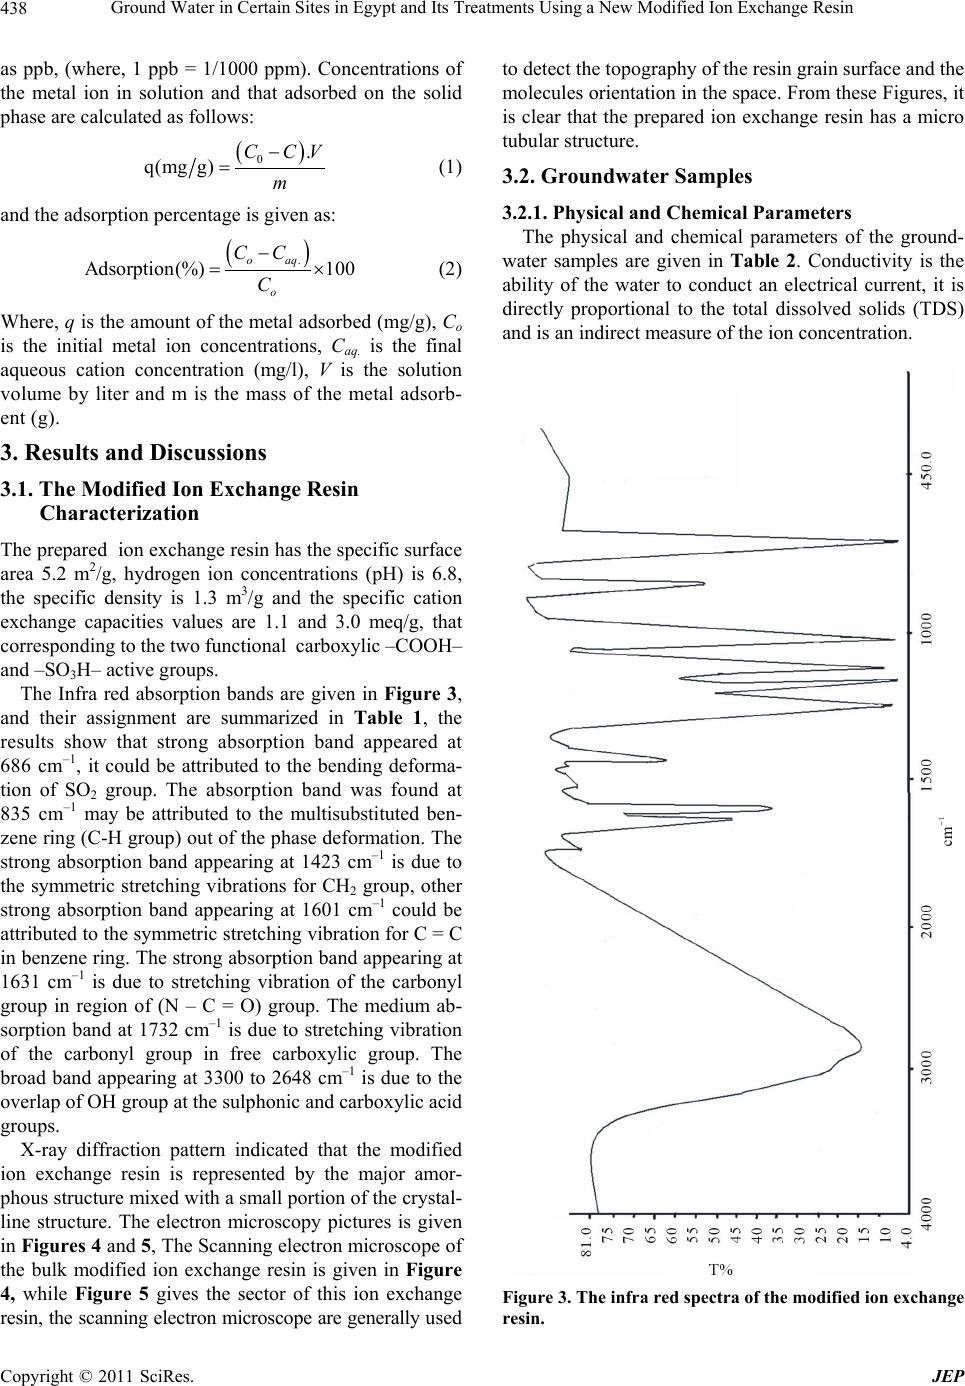 Ground Water in Certain Sites in Egypt and Its Treatments Using a New Modified Ion Exchange Resin 438 as ppb, (where, 1 ppb = 1/1000 ppm). Concentrations of the metal ion in solution and that adsorbed on the solid phase are calculated as follows: 0. q(mgg) CCV m (1) and the adsorption percentage is given as: . Adsorption(%) 100 oaq o CC C (2) Where, q is the amount of the metal adsorbed (mg/g), Co is the initial metal ion concentrations, Caq. is the final aqueous cation concentration (mg/l), V is the solution volume by liter and m is the mass of the metal adsorb- ent (g). 3. Results and Discussions 3.1. The Modified Ion Exchange Resin Characterization The prepared ion exchange resin has the specific surface area 5.2 m2/g, hydrogen ion concentrations (pH) is 6.8, the specific density is 1.3 m3/g and the specific cation exchange capacities values are 1.1 and 3.0 meq/g, that corresponding to the t wo fun cti onal carbox yl ic –COOH– and –SO3H– active groups. The Infra red absorption bands are given in Figure 3, and their assignment are summarized in Table 1, the results show that strong absorption band appeared at 686 cm–1, it could be attributed to the bending deforma- tion of SO2 group. The absorption band was found at 835 cm–1 may be attributed to the multisubstituted ben- zene ring (C-H group) out of the phase deformation. The strong absorption band appearing at 1423 cm–1 is due to the symmetric stretching vibrations for CH2 group, other strong absorption band appearing at 1601 cm–1 could be attributed to the symmetric stretching vibr ation for C = C in benzene ring. The strong absorption band appearing at 1631 cm–1 is due to stretching vibration of the carbonyl group in region of (N – C = O) group. The medium ab- sorption band at 1732 cm–1 is due to stretching vibration of the carbonyl group in free carboxylic group. The broad band appearing at 3300 to 2648 cm–1 is due to the overlap of OH group at the sulphonic and ca rb oxylic acid groups. X-ray diffraction pattern indicated that the modified ion exchange resin is represented by the major amor- phous structure mixed with a small portion of the crystal- line structure. The electron microscopy pictures is given in Figures 4 and 5, The Scanning electron microscope of the bulk modified ion exchange resin is given in Figure 4, while Figure 5 gives the sector of this ion exchange resin, the scanning electron microscope are generally use d to detect the topography of the resin grain surface and the molecules orientation in the space. From these Figures, it is clear that the prepared ion exchange resin has a micro tubular structure. 3.2. Groundwater Samples 3.2.1. Physical and Chemical Parameters The physical and chemical parameters of the ground- water samples are given in Table 2. Conductivity is the ability of the water to conduct an electrical current, it is directly proportional to the total dissolved solids (TDS) and is an indirect measure of the ion concentration. Figure 3. The infra red spectra of the modified ion exchange resin. Copyright © 2011 SciRes. JEP 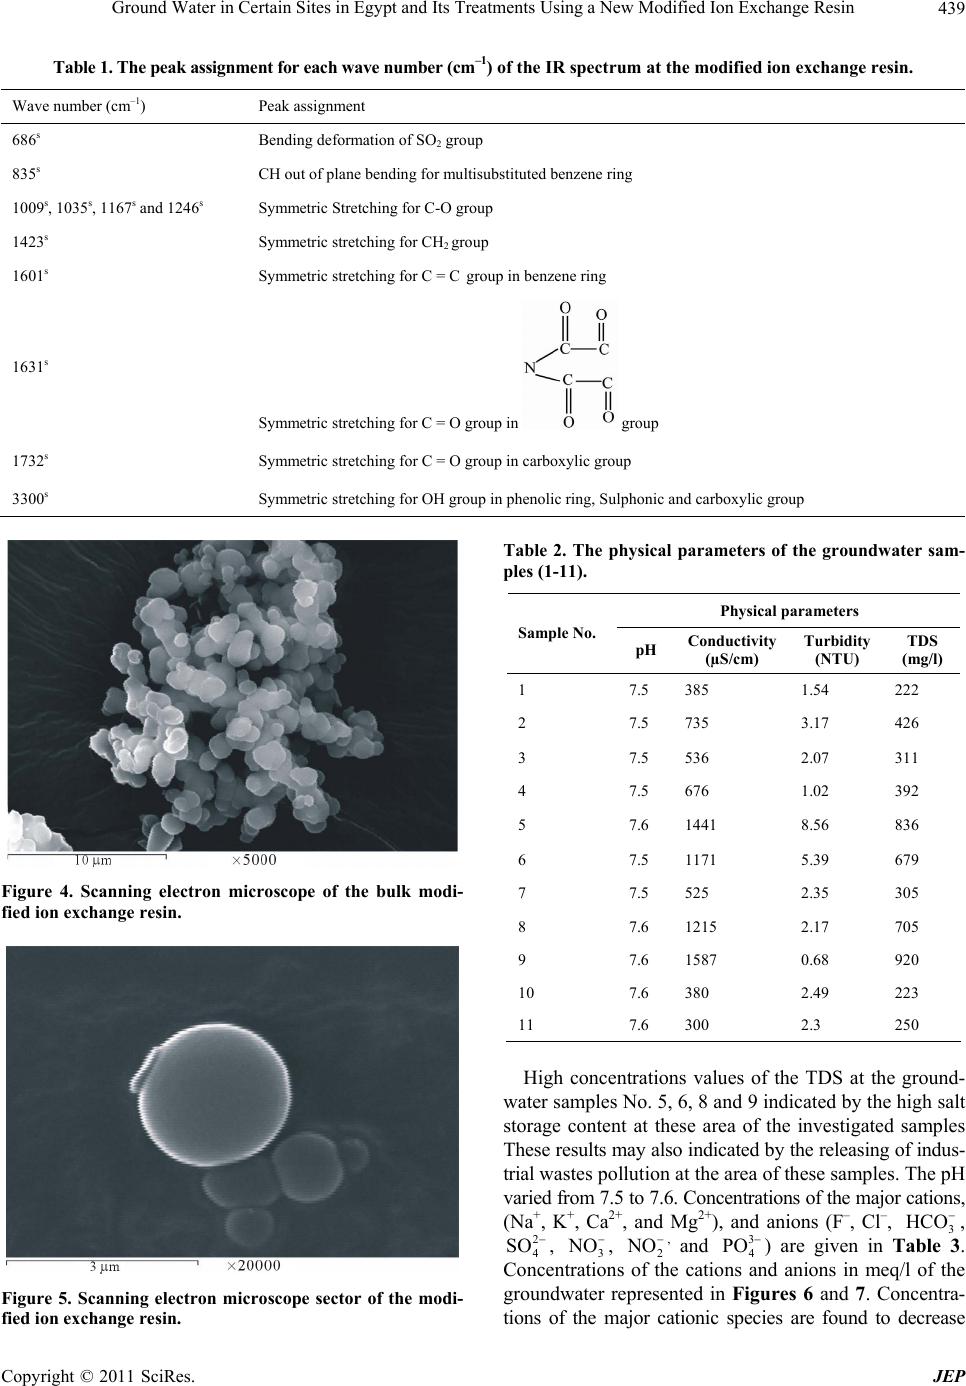 Ground Water in Certain Sites in Egypt and Its Treatments Using a New Modified Ion Exchange Resin439 Table 1. The peak assignment for each wave number (cm–1) of the IR spectrum at the modified ion exchange resin. Wave number (cm–1) Peak assignment 686s Bending deformation of SO2 group 835s CH out of plane bending for multisubstituted benzene ring 1009s, 1035s, 1167s and 1246s Symmetric Stretching for C-O group 1423s Symmetric stretching for CH2 group 1601s Symmetric stretching f or C = C group in benzene ring 1631s Symmetric stretching for C = O group in group 1732s Symmetric stretching for C = O group in carboxylic group 3300s Symmetric stretching for OH group in phenolic ring, Sulphonic and carboxylic group Figure 4. Scanning electron microscope of the bulk modi- fied ion exchange resin. Figure 5. Scanning electron microscope sector of the modi- fied ion exchange resin. Table 2. The physical parameters of the groundwater sam- ples (1-11). Physical parameters Sample No. pH Conductivity (µS/cm) Turbidity (NTU) TDS (mg/l) 1 7.5 385 1.54 222 2 7.5 735 3.17 426 3 7.5 536 2.07 311 4 7.5 676 1.02 392 5 7.6 1441 8.56 836 6 7.5 1171 5.39 679 7 7.5 525 2.35 305 8 7.6 1215 2.17 705 9 7.6 1587 0.68 920 10 7.6 380 2.49 223 11 7.6 300 2.3 250 High concentrations values of the TDS at the ground- water samples No. 5, 6, 8 and 9 indicated by the high salt storage content at these area of the investigated samples These results may also indicated by the releasing of indus- trial wastes pollution at the area of these samples. The pH varied from 7.5 to 7.6. Concentrations of the major cations, (Na+, K+, Ca2+, and Mg2+), and anions (F–, Cl–, 3 HCO , 2 4 SO , 3 NO , 2 NO , and ) are given in Table 3. Concentrations of the cations and anions in meq/l of the groundwater represented in Figures 6 and 7. Concentra- tions of the major cationic species are found to decrease 3 4 PO Copyright © 2011 SciRes. JEP 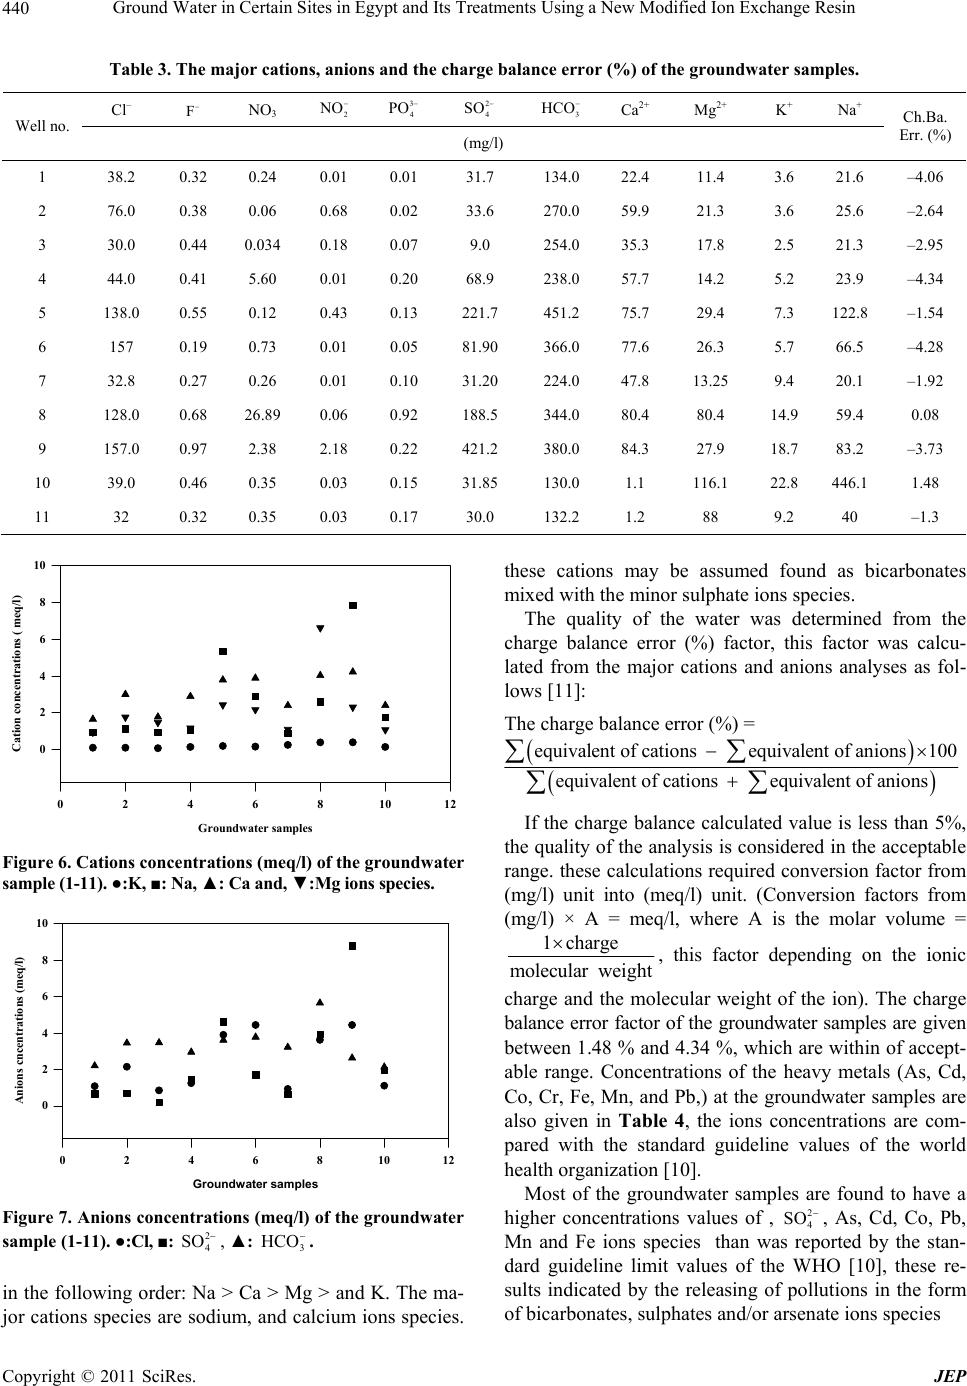 Ground Water in Certain Sites in Egypt and Its Treatments Using a New Modified Ion Exchange Resin 440 Table 3. The major cations, anions and the charge balance error (%) of the groundwater samples. Cl– F NO3 2 NO 3 4 PO 2 4 SO 3 HCO Ca2+ Mg2+ K+ Na+ Well no. (mg/l) Ch.Ba. Err. (%) 1 38.2 0.32 0.24 0.01 0.01 31.7 134.0 22.4 11.4 3.6 21.6 –4.06 2 76.0 0.38 0.06 0.68 0.02 33.6 270.0 59.9 21.3 3.6 25.6 –2.64 3 30.0 0.44 0.034 0.18 0.07 9.0 254.0 35.3 17.8 2.5 21.3 –2.95 4 44.0 0.41 5.60 0.01 0.20 68.9 238.0 57.7 14.2 5.2 23.9 –4.34 5 138.0 0.55 0.12 0.43 0.13 221.7 451.2 75.7 29.4 7.3 122.8 –1.54 6 157 0.19 0.73 0.01 0.05 81.90 366.0 77.6 26.3 5.7 66.5 –4.28 7 32.8 0.27 0.26 0.01 0.10 31.20 224.0 47.8 13.25 9.4 20.1 –1.92 8 128.0 0.68 26.89 0.06 0.92 188.5 344.0 80.4 80.4 14.9 59.4 0.08 9 157.0 0.97 2.38 2.18 0.22 421.2 380.0 84.3 27.9 18.7 83.2 –3.73 10 39.0 0.46 0.35 0.03 0.15 31.85 130.0 1.1 116.1 22.8 446.1 1.48 11 32 0.32 0.35 0.03 0.17 30.0 132.2 1.2 88 9.2 40 –1.3 Groundwater samples 024681012 Cation concentrations ( meq/l) 0 2 4 6 8 10 Figure 6. Cations concentrations (meq/l) of the groundwater sample (1-11). ●:K, ■: Na, ▲: Ca and, ▼:Mg ions species. Groundwater samples 024681012 Anions cncentrations (meq/l) 0 2 4 6 8 10 Figure 7. Anions concentrations (meq/l) of the groundwater sample (1-11). ●:Cl, ■: , ▲: . 2 4 SO 3 HCO in the following order: Na > Ca > Mg > and K. The ma- jor cations species are sodium, and calcium ions species. these cations may be assumed found as bicarbonates mixed with the minor sulphate ions species. The quality of the water was determined from the charge balance error (%) factor, this factor was calcu- lated from the major cations and anions analyses as fol- lows [11]: The charge balance error (%) = equivalent of cations equivalent of anions100 equival ent of cations equivalent of anions If the charge balance calculated value is less than 5%, the quality of the analysis is considered in the acceptable range. these calculations required conversion factor from (mg/l) unit into (meq/l) unit. (Conversion factors from (mg/l) × A = meq/l, where A is the molar volume = 1charge molecular weight , this factor depending on the ionic charge and the molecular weight of the ion). The charge balance error factor of the groundwater samples are given between 1.48 % and 4.34 %, which are with in of accept- able range. Concentrations of the heavy metals (As, Cd, Co, Cr, Fe, Mn, and Pb,) at the groundwater samples are also given in Table 4, the ions concentrations are com- pared with the standard guideline values of the world health organizati on [10]. Most of the groundwater samples are found to have a higher concentrations values of , , As, Cd, Co, Pb, Mn and Fe ions species than was reported by the stan- dard guideline limit values of the WHO [10], these re- sults indicated by the releasing of pollutions in the form of bicarbonates, sulphates and/or arsenate ions species 2 4 SO Copyright © 2011 SciRes. JEP 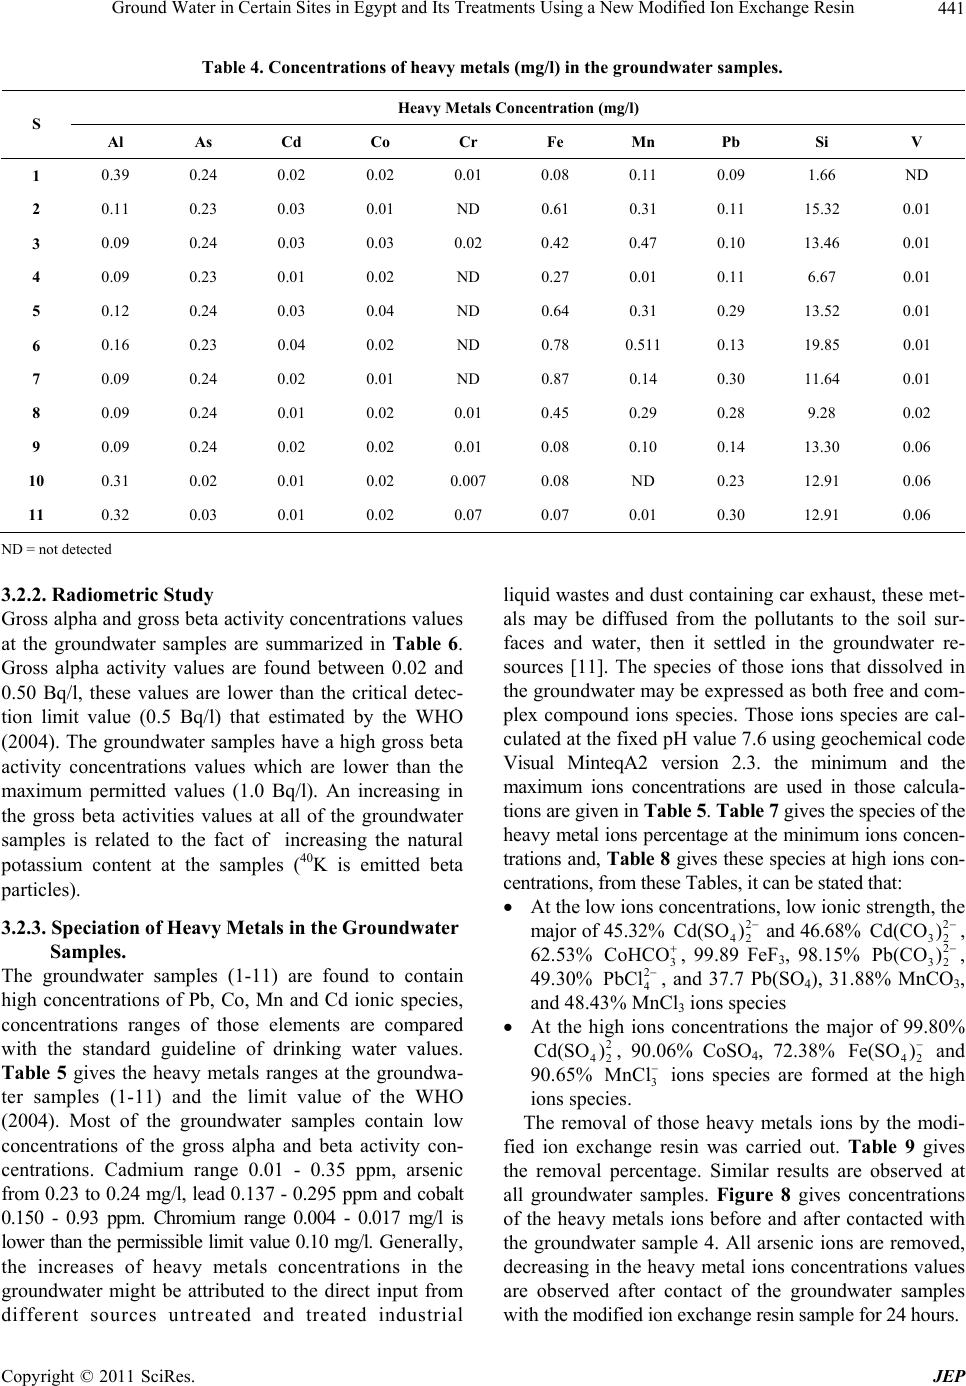 Ground Water in Certain Sites in Egypt and Its Treatments Using a New Modified Ion Exchange Resin 441 Table 4. Concentrations of heavy metals (mg/l) in the groundwater samples. Heavy Metals Concentration (mg/l) S Al As Cd Co Cr Fe Mn Pb Si V 1 0.39 0.24 0.02 0.02 0.01 0.08 0.11 0.09 1.66 ND 2 0.11 0.23 0.03 0.01 ND 0.61 0.31 0.11 15.32 0.01 3 0.09 0.24 0.03 0.03 0.02 0.42 0.47 0.10 13.46 0.01 4 0.09 0.23 0.01 0.02 ND 0.27 0.01 0.11 6.67 0.01 5 0.12 0.24 0.03 0.04 ND 0.64 0.31 0.29 13.52 0.01 6 0.16 0.23 0.04 0.02 ND 0.78 0.511 0.13 19.85 0.01 7 0.09 0.24 0.02 0.01 ND 0.87 0.14 0.30 11.64 0.01 8 0.09 0.24 0.01 0.02 0.01 0.45 0.29 0.28 9.28 0.02 9 0.09 0.24 0.02 0.02 0.01 0.08 0.10 0.14 13.30 0.06 10 0.31 0.02 0.01 0.02 0.007 0.08 ND 0.23 12.91 0.06 11 0.32 0.03 0.01 0.02 0.07 0.07 0.01 0.30 12.91 0.06 ND = not detected 3.2.2. Radiometric Study Gross alpha and gross beta activity concentrations values at the groundwater samples are summarized in Table 6. Gross alpha activity values are found between 0.02 and 0.50 Bq/l, these values are lower than the critical detec- tion limit value (0.5 Bq/l) that estimated by the WHO (2004). The groundwater samples have a high gross beta activity concentrations values which are lower than the maximum permitted values (1.0 Bq/l). An increasing in the gross beta activities values at all of the groundwater samples is related to the fact of increasing the natural potassium content at the samples (40K is emitted beta particles). 3.2.3. Speciation of Heavy Metals in the Groundwater Samples. The groundwater samples (1-11) are found to contain high concentrations of Pb, Co, Mn and Cd ionic species, concentrations ranges of those elements are compared with the standard guideline of drinking water values. Table 5 gives the heavy metals ranges at the groundwa- ter samples (1-11) and the limit value of the WHO (2004). Most of the groundwater samples contain low concentrations of the gross alpha and beta activity con- centrations. Cadmium range 0.01 - 0.35 ppm, arsenic from 0.23 to 0.24 mg/l, lead 0.137 - 0.295 ppm and cobalt 0.150 - 0.93 ppm. Chromium range 0.004 - 0.017 mg/l is lower than the permissible limit value 0.10 mg/l. Ge ne ral ly , the increases of heavy metals concentrations in the groundwater might be attributed to the direct input from different sources untreated and treated industrial liquid wastes and dust containing car exhaust, these met- als may be diffused from the pollutants to the soil sur- faces and water, then it settled in the groundwater re- sources [11]. The species of those ions that dissolved in the groundwater may be expressed as both free and com- plex compound ions species. Those ions species are cal- culated at the fixed pH value 7.6 using geochemical code Visual MinteqA2 version 2.3. the minimum and the maximum ions concentrations are used in those calcula- tions are given in Table 5. Table 7 gives the species of the heavy metal ions percentage at the minimum ions concen- trations and, Table 8 gives these species at high ions con- centrations, from these Tables, it can be stated that: At the low ions concentrations, low ionic strength, the major of 45.32% 2 42 Cd(SO) and 46.68% 2 32 Cd(CO) , 62.53% 3 CoHCO , 99.89 FeF3, 98.15% 2 32 Pb(CO ) , 49.30% 2 4 PbCl , and 37.7 Pb(SO4), 31.88% MnCO3, and 48.43% MnCl3 ions species At the high ions concentrations the major of 99.80% 2 42 Cd(SO ), 90.06% CoSO4, 72.38% 42 Fe(SO ) and 90.65% 3 MnCl ions species are formed at the high ions species. The removal of those heavy metals ions by the modi- fied ion exchange resin was carried out. Table 9 gives the removal percentage. Similar results are observed at all groundwater samples. Figure 8 gives concentrations of the heavy metals ions before and after contacted with the groundwater sample 4. All arsenic ions are removed, decreasing in the heavy metal ions concentrations values are observed after contact of the groundwater samples with the modifi ed ion exchange resin sample for 24 hours. Copyright © 2011 SciRes. JEP 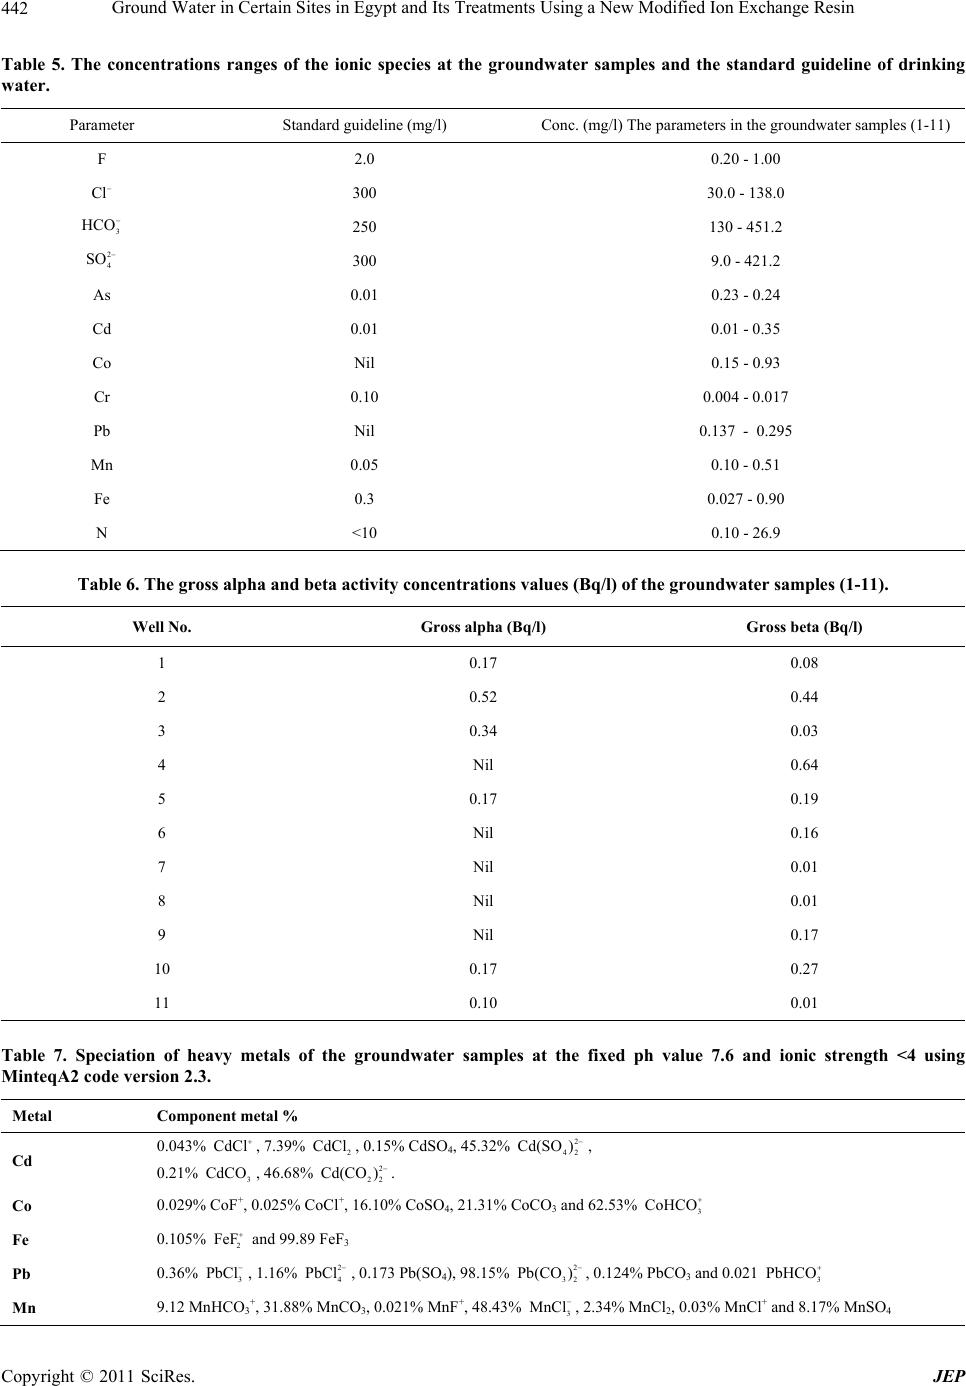 Ground Water in Certain Sites in Egypt and Its Treatments Using a New Modified Ion Exchange Resin 442 Table 5. The concentrations ranges of the ionic species at the groundwater samples and the standard guideline of drinking water. Parameter Standard guideline (mg/l) Conc. (mg/l) The parameters in the groundwater samples (1- 11) F 2.0 0.20 - 1.00 Cl 300 30.0 - 138.0 3 HCO 250 130 - 451.2 2 4 SO 300 9.0 - 421.2 As 0.01 0.23 - 0.24 Cd 0.01 0.01 - 0.35 Co Nil 0.15 - 0.93 Cr 0.10 0.004 - 0.017 Pb Nil 0.137 - 0.295 Mn 0.05 0.10 - 0.51 Fe 0.3 0.027 - 0.90 N <10 0.10 - 26.9 Table 6. The gross alpha and beta activity concentrations values (Bq/l) of the groundwater samples (1-11). Gross beta (Bq/l) Gross alpha (Bq/l) Well No. 0.08 0.17 1 0.44 0.52 2 0.03 0.34 3 0.64 Nil 4 0.19 0.17 5 0.16 Nil 6 0.01 Nil 7 0.01 Nil 8 0.17 Nil 9 0.27 0.17 10 0.01 0.10 11 Table 7. Speciation of heavy metals of the groundwater samples at the fixed ph value 7.6 and ionic strength <4 using MinteqA2 code version 2.3. Metal Component metal % Cd 0.043% CdCl , 7.39% , 0.15% CdSO 4, 45.32% 2 CdCl 2 42 Cd(SO ) , 0.21% , 46.68% 3 CdCO 2 22 Cd(CO) . Co 0.029% CoF+, 0.025% CoCl+, 16.10% CoSO4, 21.31% CoCO3 and 62.53% 3 CoHCO Fe 0.105% 2 FeF and 99.89 FeF3 Pb 0.36% 3 PbCl , 1.16% , 0.173 Pb(SO4), 98.15% 2 4 PbCl 2 32 Pb(CO) , 0.124% PbCO 3 and 0.021 3 PbHCO Mn 9.12 MnHCO3+, 31.88% MnCO 3, 0.021% MnF+, 48.43% 3 MnCl , 2.34% MnCl2, 0.03% MnCl+ and 8.17% MnSO4 Copyright © 2011 SciRes. JEP 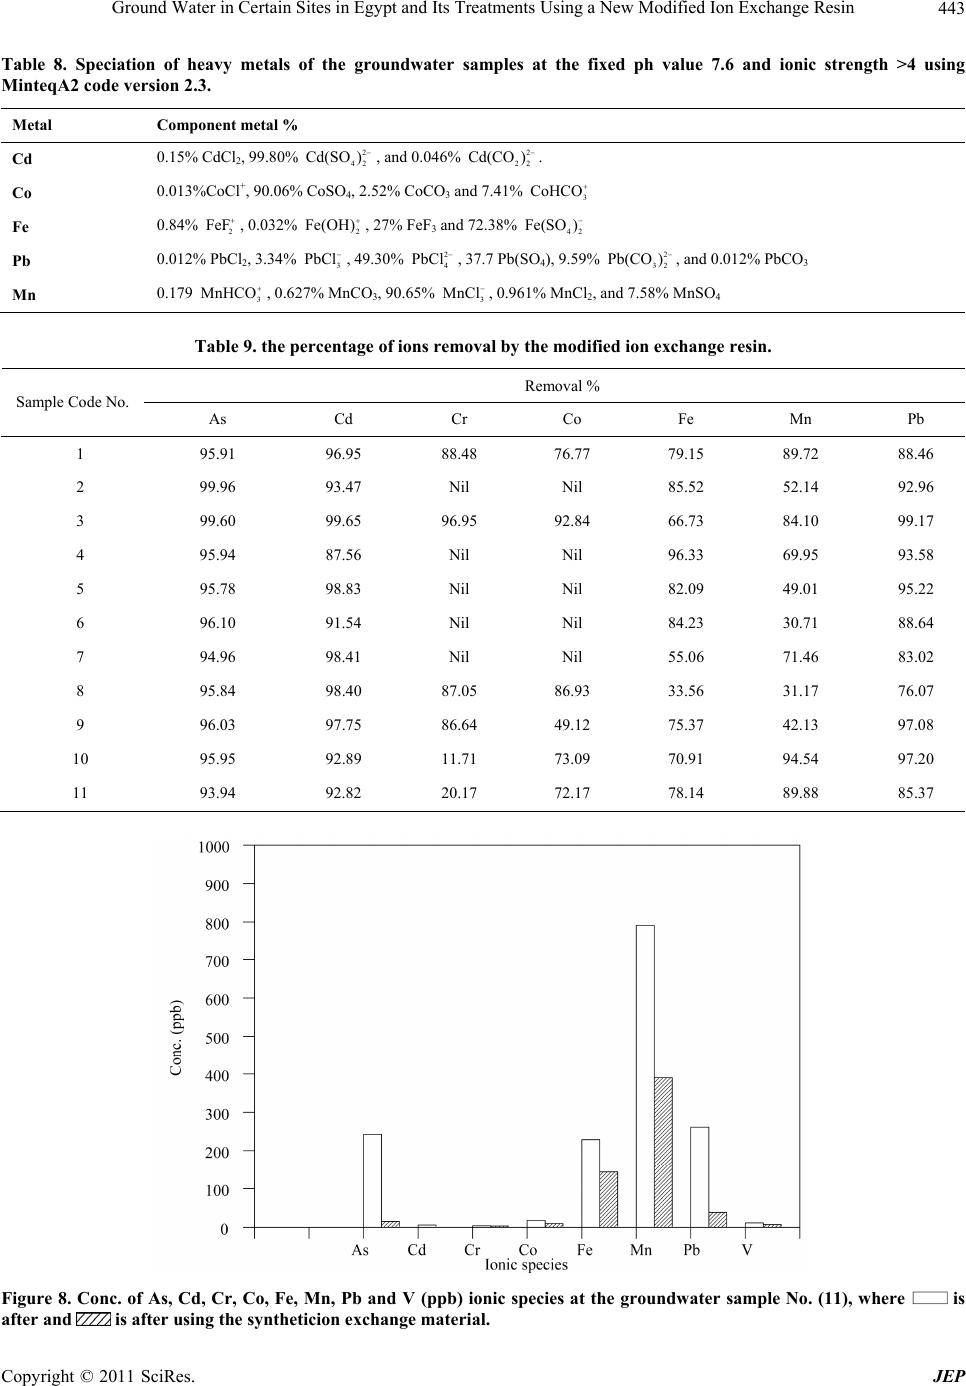 Ground Water in Certain Sites in Egypt and Its Treatments Using a New Modified Ion Exchange Resin443 Table 8. Speciation of heavy metals of the groundwater samples at the fixed ph value 7.6 and ionic strength >4 using MinteqA2 code version 2.3. Metal Component metal % Cd 0.15% CdCl2, 99.80% , and 0.046% 2 42 Cd(SO) 2 22 Cd(CO ) . Co 0.013%CoCl+, 90 .06% CoSO4, 2.52% CoCO3 and 7.41% 3 CoHCO Fe 0.84% , 0.032% , 27% FeF3 and 72.38% 2 FeF 2 Fe( OH ) 42 Fe(SO ) Pb 0.012% PbCl2, 3.34% , 49.30% 3 PbCl2 4 PbCl , 37.7 Pb(SO4), 9.59% 2 32 Pb(CO) , and 0.012% Pb CO3 Mn 0.179 , 0.627% MnCO3, 90.65% 3 MnHCO 3 MnCl , 0.961% MnCl2, and 7.58% MnSO4 Table 9. the percentage of ions removal by the modified ion exchange resin. Removal % Sample Code No. As Cd Cr Co Fe Mn Pb 1 95.91 96.95 88.48 76.77 79.15 89.72 88.46 2 99.96 93.47 Nil Nil 85.52 52.14 92.96 3 99.60 99.65 96.95 92.84 66.73 84.10 99.17 4 95.94 87.56 Nil Nil 96.33 69.95 93.58 5 95.78 98.83 Nil Nil 82.09 49.01 95.22 6 96.10 91.54 Nil Nil 84.23 30.71 88.64 7 94.96 98.41 Nil Nil 55.06 71.46 83.02 8 95.84 98.40 87.05 86.93 33.56 31.17 76.07 9 96.03 97.75 86.64 49.12 75.37 42.13 97.08 10 95.95 92.89 11.71 73.09 70.91 94.54 97.20 11 93.94 92.82 20.17 72.17 78.14 89.88 85.37 Figure 8. Conc. of As, Cd, Cr, Co, Fe, Mn, Pb and V (ppb) ionic species at the groundwater sample No. (11), where is after and is after using the syntheticion exchange material. Copyright © 2011 SciRes. JEP  Ground Water in Certain Sites in Egypt and Its Treatments Using a New Modified Ion Exchange Resin Copyright © 2011 SciRes. JEP 444 Concentrations o f the metal ions are not decreased by the same rate, it depend on many factors such as selectivity and the different in electro-negative charges of the at- tracting forces between the ions species that dissolved in water and the surface of the solid content of ion ex- change resin. The results are with an agreement of other investigations [12,13], many factors are affecting the metal removal percentage by the ion exchange resin, these in- cluding: Competing ions, the removal of heavy metals de- creased by increasing of competing ions in the ground- water samples. The ion exchange resin is preferred to the cation has a high valance state, arsenate ions species are com- pletely removed from all groundwater. Among ions having the same charge, sorption process is preferred for the ions have the smallest hydrated diameter such as lead ions Therefore, the removal of heavy metals decreased by the following order: Pb2+ > Cd2+ > Co2+ > Fe2+ > and Mn2+ The results are with an agreement of that reported [14]. 4. Conclusions This research is concerning with the water quality, a modified dioxaloyl-para-sulphanilamide ion exchange resin was prepared in the laboratory is characterized by the, infra red spectra, x-ray diffraction and electronic microscopic, the cation exchange capacity and specific surface area are also performed. Speciation of heavy metals such as ; Cr, Cd, Co, As, Mn, Fe and Pb in ground- water samples were performed using visual MinteqA2 geochemical code version 2.3. This modified ion ex- change resin was found to be a good adsorbent that used for heavy metal removal from groundwater samples. REFERENCES [1] M. Ali and M. Soltan, “The Impact of Three Industrial Effluents on Submerged Aquatic Plants in the River Nile, Egypt,” Hydrobiology, Vol. 340, No. 1-3, 1996, pp. 77-83. doi:10.1007/BF00012737 [2] R. Handy, “Intermitted Exposure to Aquatic Pollutants Assessment, Toxicity and Sub-Lethal Responses in Fish and Invertebrates,” Comparative Biochemistry and Physi- ology C-Pharmacology Toxicology & Endocrinology, Vol. 107, No. 2, 1994, pp. 171-184. [3] A. G. M. Osman and W. Kloas, “Water Quality and Hea- vy Metal Monitoring in Water, Sediments and Tissues of the African Catfish Clarias Gariepinus (Burchell, 1822) from the River Nile, Egypt,” Journal of Environmental Protection, Vol. 1, No. 4, 2010, pp. 389-400. doi:10.4236/jep.2010.14045 [4] K. Y. Jang-Soon, Y. Seong-Taek, L. Jong-Hwa, K. Soon- Oh and J. Ho-Young, “Removal of Divalent Heavy Met- als (Cd, Cu, Pb, And Zn) and Arsenic (III) from Aqueous Solutions Using Scoria: Kinetics And Equilibrium Of Sorption,” Journal of Hazardous Materials, Vol. 174, No. 1-3, 2010, pp. 307-313. doi:10.1016/j.jhazmat.2009.09.052 [5] U. Wingenfelder, C. Hansen, G. Furrer and R. Schulin, “Removal of Heavy Metals from Mine Waters by Natural Zeolites,” Environmental Science and Technology, Vol. 39, No. 12, 2005, pp. 4606-4613. doi:10.1021/es048482s [6] I. J. Alinnor, “Adsorption of Heavy Metal Ions from Aqueous Solution by Fly Ash,” Fuel, Vol. 86, No. 5-6, 2007, pp. 835-246. doi:10.1016/j.fuel.2006.08.019 [7] K. D. Maria. “Removal of Mn2+ Ions from Drinking Wa- ter Using Clinptilolite-Fe Oxide System,” Water Re- search, Vol. 40, No. 17, 2006, pp. 3167-3176. doi:10.1016/j.watres.2006.07.013 [8] International Atomic Energy Agency (IAEA), “Applica- tion of Ion Exchange Processes for the Treatment of Ra- dioactive Waste and Management of Spent Ion Exchang- ers,” Technical Report Series (TR), No. 408, 2002. [9] B. Black, “Methods of Soil Analyses,” Mcgraw Hill, Inc., New York, 1972. [10] The World Health Organization (WHO), “The Guidelines of Drinking Water,” Vienna, 2004. [11] R. A. Freeze and H. Cherry, “Groundwater,” Prentice- Hall, New Jersey, 1979. [12] S. J. Allen and P. A. Brown, “Isotherm Analyses for Sin- gle Component and Multicomponent Metal Sorption onto Lignite,” Journal of Chemical Technology and Biotech- noloy, Vol. 62, No. 1, 1995, pp. 17-24. doi:10.1002/jctb.280620103 [13] A. Seco, P. Marzal and C. Gabaldon, “Adsorption of Heavy Metals from Aquoues Solutions onto Activated Carbon in Single Cu and Ni Systems and in Binary Cu-Ni, Cu-Cd and Cu-Zn Systems,” Journal of Chemical Tech- nology and Biotechnoloy, Vol. 68, No. 1, 1997, pp. 23-30. doi:10.1002/(SICI)1097-4660(199701)68:1<23::AID-JCT B595>3.0.CO;2-NU [14] International Atomic Energy Agency, “Waste Treatment and Immobilization Techniques Involving Inorganic Sor- bents,” IAEA-TECDOC-947, Vienna, 1997. |