 Journal of Applied Mathematics and Physics, 2014, 2, 1130-1138 Published Online November 2014 in SciRes. http://www.scirp.org/journal/jamp http://dx.doi.org/10.4236/jamp.2014.212132 How to cite this paper: Ali, E. and Wu, G. (2014) Selection of Influential Microfabric Properties of Anisotropic Amphibolite Rocks on Its Uniaxial Compressive Strength (UCS): A Comprehensive Statistical Study. Journal of Applied Mathematics and Physics, 2, 1130-1138. http://dx.doi.org/10.4236/jamp.2014.212132 Selection of Influential Microfabric Properties of Anisotropic Amphibolite Rocks on Its Uniaxial Compressive Strength (UCS): A Comprehensive Statistical Study Esamaldeen Ali1, Guang Wu2 1Faculty of Petroleum and Minerals, Al Neelain University, Khartoum, Sudan 2Faculty of Geosciences and Environmental Engineering, Southwest Jiaotong University, Chengdu, China Email: esameldeen77@yahoo.com Received June 2014 Abstract Occasionally, in complex inherent characteristics of certain rocks, especially anisotropic rocks it may be difficult to measure the uniaxial compressive strength UCS. However, the use of empirical relationships to evaluate the UCS of rock can be more practical and economical. Consequently, this study carried out to predict UCS from microfabrics properties of banded amphibolite rocks using multiple regression analysis. Based on statistical results, rock microfabric parameters, which adequately represent the UCS of a given rock type have been selected. The results show that grain size, shape factor and quartz content have high significant correlation with UCS at 95% confidence level. From multiple regression model, approximately 84% of the variance of the UCS can be esti- mated by the linear combination of these three parameters. However, according to model perfor- mance criteria: correlation coefficient (R = 0.919), variance account for (VAF = 97%) and root mean square error (RMSE = 4.16) the study clearly indicates that the developed model is reliable to predict the UCS. Finally, this approach can be easily extended to the modeling of rock strength in the absence of adequate geological information or abundant data. Keywords Anisotropic Rocks, Microfabric, UCS, Multiple Regressions, Banded Amph ibol ite 1. Introduction Uniaxial compressive strength (UCS) of rocks is one of the most important intact rock parameters, that it is commonly used for a variety of engineering designing surface and underground rock structures [1]. However, there are two methods for assessing the UCS of rocks. One, known as the direct method where both the  E. Ali, G. Wu American Society for Testing and Materials (ASTM) and the International Society for Rock Mechanics (ISRM) have standardized the testing procedure of this rock strength. Although, the method is relatively sim- ple, sometimes due to complex inherent characteristics of certain rocks, carrying out uniaxial compressive strength test in laboratory becomes not easy particularly from weak, stratified, highly fractured and weathered rocks. In order to overcome this difficulty, several researchers have proposed indirect methods considering simple index parameters such as Schmidt hammer, point load index, block punch and petrographical proper- ties [2]-[7]. Although often neglected, microstructures characteristic of rocks are of great significance for the failure of rocks, especially when intense deformation is present [8]. Geometrical parameters of rock-forming minerals (microstructures), known to affect mechanical properties of rocks include mineral composition, grain size, grain shape and spatial arrangement of minerals visible in micro-scale [9]. However, quantitative microfabrics study can provide initial estimate of rock properties required at the feasibility and initial design stage [10]. In fact, one obvious reason for this is the complexity of rock materials and the variation in quantitative relationships be- tween different rock types. In the last few years, several scholars have used different techniques such as statistical regression and compu- tational intelligent techniques to establish predictive models for predicting UCS from texture characteristics of rocks [11]-[15]. However, one of the main disadvantages of previous models is that they use less effective input parameters for predicting rock strength such as grain area weighting as well as the secondary mineral contents (e.g. [11]). Hence, choosing a relatively smaller number of variables, but more influential which adequately represent the strength properties of a given rock type is necessary. Thus, cont ra r y to previous UCS models from textural characteristics-this study carried out with aim of select relatively smaller number of rock microfabrics but more influential ones, which adequately represent the UCS of a given rock type. This can reduce popularity of this technique for evaluating mechanical properties of rock from textural characteristics. This effort is a complementary contribution to the studies presented herein using comprehensive statistical analysis technique. For this purpose banded amphibolite rocks were collected from va- ried rock slopes along Chengdu-wenchuan highway in Sichuan province, china. These rocks were selected due to their high rock-fabric complexity and their high significance impact in rock engineering design. However, in reviewing the literature, no data was found focusing on this type of metamorphic rocks. 2. Database 2.1. Sample Preparation and Experiments Keeping the objectives in view representative block samples of banded amphibolite were collected for laborato- ry experiments. Macroscopically, the rocks exhibit a distinct planar syn-metamorphic fabric that characterized wit h near perfect tectonic metamorphic layering and mineral alignment (schistosity). For uniaxial compressive strength (UCS), cylindrical specimens of length to diameter ration equal to 2 were cored using conventional la- boratory drilling machine as required as per the ASTM [16] specification. The test was conducted on core sam- ples according to ASTM [17] standard. At least 3 to 5 core samples were tested and the average strength was recorded in the database. The UCS employed in the present study is considered as the dependent variable. For microfabrics characterization, thin sections across, along the schistosity were prepared from each core speci- mens. The mineral composition of subtype samples of amphibolite rocks were determined by X-ray diffraction method (XRD). 2.2. Petrographic Description of Studied Rocks In order to evaluate the petro-fabric of the studied rocks, thin sections across and along the schistosity were pre- pared and observed under a high power polarized microscope. The mineral assemblage and texture characteris- tics of the typical rocks may vary within the meter scale. Based on XRD analysis the predominant mineralogical composition is almost quartz, hornblende, actinolite, orthoclase, plagioclase, rare pyroxene, and minor amounts of calcite, dolomite, epidote and chlorite. Apatite, sphene and iron oxide are accessory minerals. Microscopical- ly, thin sections show that the rocks contain varying proportions of xenoblastic hornblende set in a fine-to me- dium-grained quartz-plagioclase mosaic. Aligned hornblende crystals form the bulk of the rock that average is 0.1 mm, although large crystals reach 0.25 mm and they usually contain numerous small inclusions of quartz 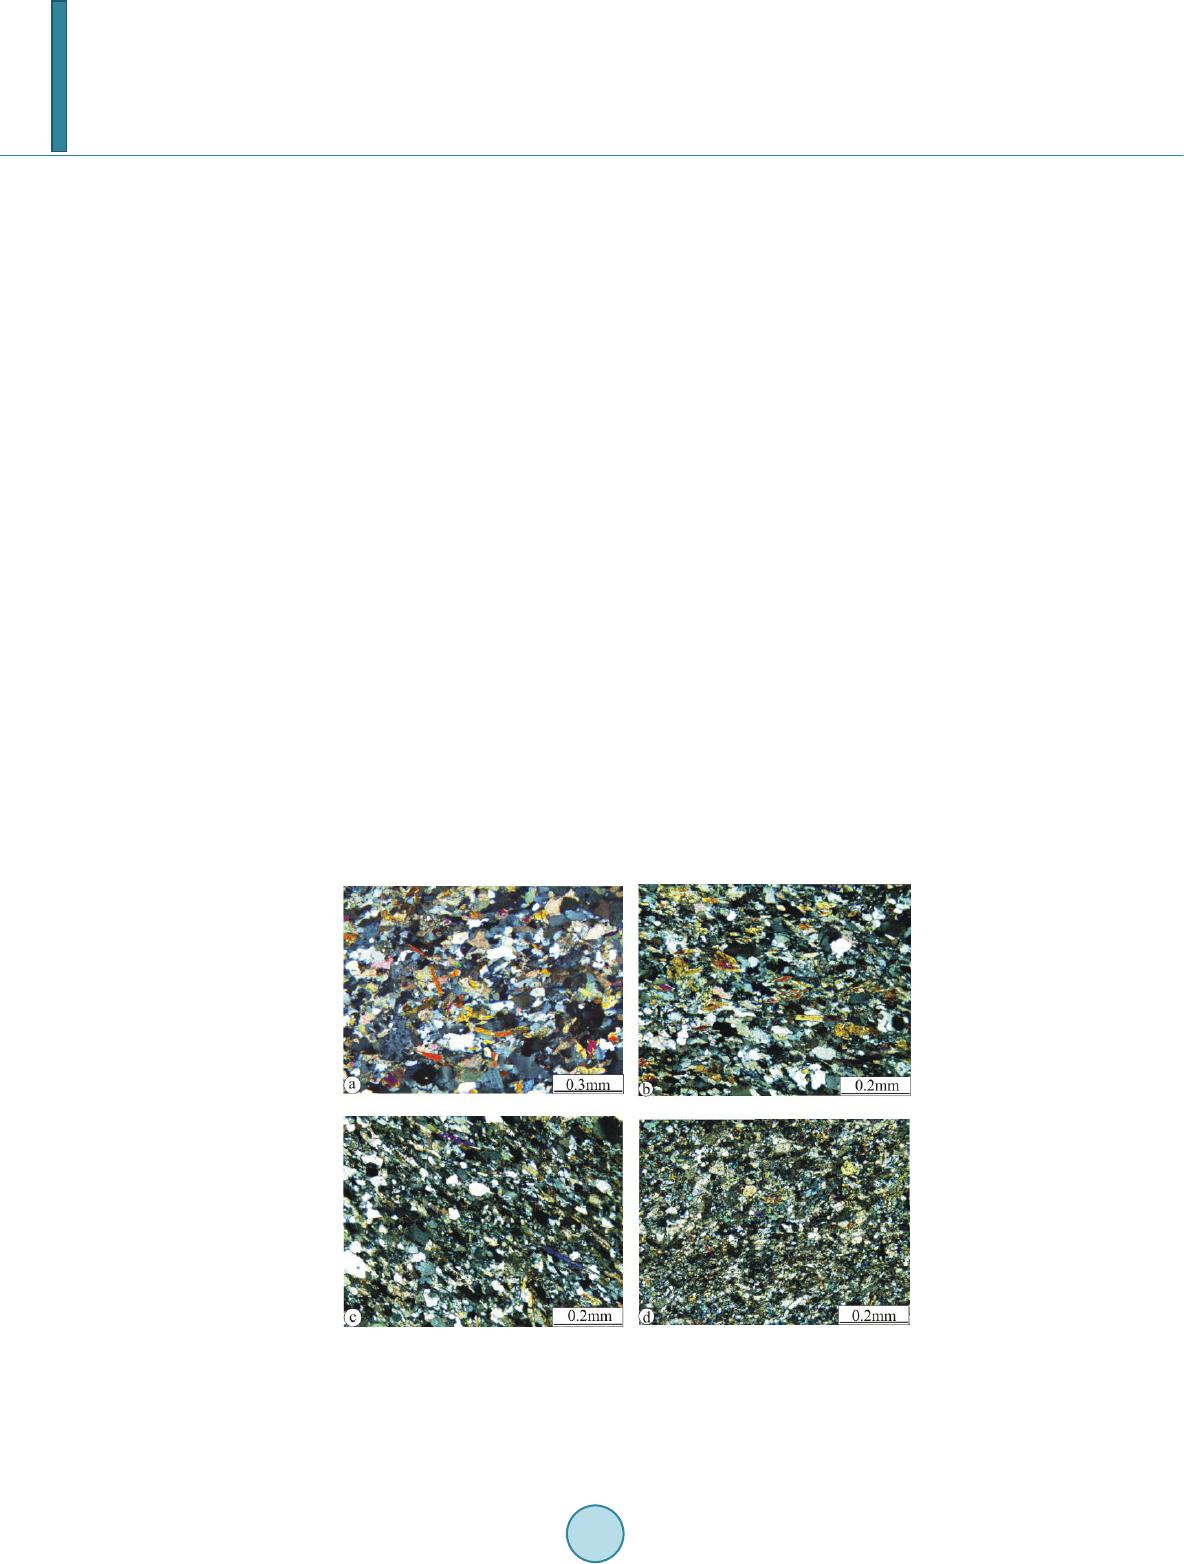 E. Ali, G. Wu (Figure 1(a) and Figure 1(b)). The main microstructure of these rocks is well-developed layered lattice struc- ture that defined by strong crystallographic preferred orientation of hornblende and elongated quartz grains in quartz rich zone (Figure 1(b) and Figure 1(c)). This well-defined layering in microscopic scale indicates that these rocks characterized with higher degree of texture anisotropy. In some thin sections, numerous porphyrob- lasts of quarts and plagioclase considerably deflect the schistosity plane (Figure 1(c)), which may cause some variation in strength measurements. Some parts of fine-grained amphibolite composed almost entire of small granular epidote crystals and the hornblende has altered to aggregates of epidote and fibrous actinolite and chlo- rite (Fig ure 1(c) and F igure 1(d)). The presence of slight amount of high pressure/low temperature mineral as- semblage (e.g. chlorite and epidote) along with the aforementioned mineral indicate that these rocks subjected to retrograded regional metamorphism from medium to low-grade. 2.3. Quantitative Microfabrics Measurements In fact, up to date there is a full agreement on that quantitative petrographic image analysis (PIA) is an efficient technique for the numerical description of rock microfabric [10]. However, the correct interpretation of rock strength variation is mainly influenced by precise determination of microstructures properties. Therefore, in this study, semi-automated petrographic analysis, which is performed by means of standard po- larizing microscope employing specialized polarized software [1 8]. The whole process of semi-automatic image analysis which consists of the following stages: 1) Image acquisition refers to the selection of a measured area of the thin section is photographed using a dig- ital camera attached to the optical microscope. The dimension of each image is 1.15 mm height and 1.4 mm length with special resolution 1024 × 768 pixels. A total of 25 - 36 images were captured from each thin section and then mosaicked to represent the completely thin section. The average grain size in rock is the controlling factor for the size of the analyzed area; at least 200 - 300 grains are measured. 2) Image digitizing focus on the drawing outlines of grain boundaries and preparation of a map of mineral grains from the thin sections, which forms the base for the computer analysis of selected geometrical parameters (Figure 2). 3) Image measurement and the data analysis: The image analysis TIGER 3000P software offers fea- ture-specific measurement during which each grain is measured independently. Figure 1. Microstructural characteristics of amphibolite rocks, (a) Quartz rich medium-grained amphibolite, (b) Xenoblastic hornblende set in medium- grained quartz-plagioclase mosaic, (c) Porphyroblasts of quarts and plagio- clase and rod-shaped hornblende defines the lineation within the foliation plane, (d) Fine-grained epidote amphibolite schist. 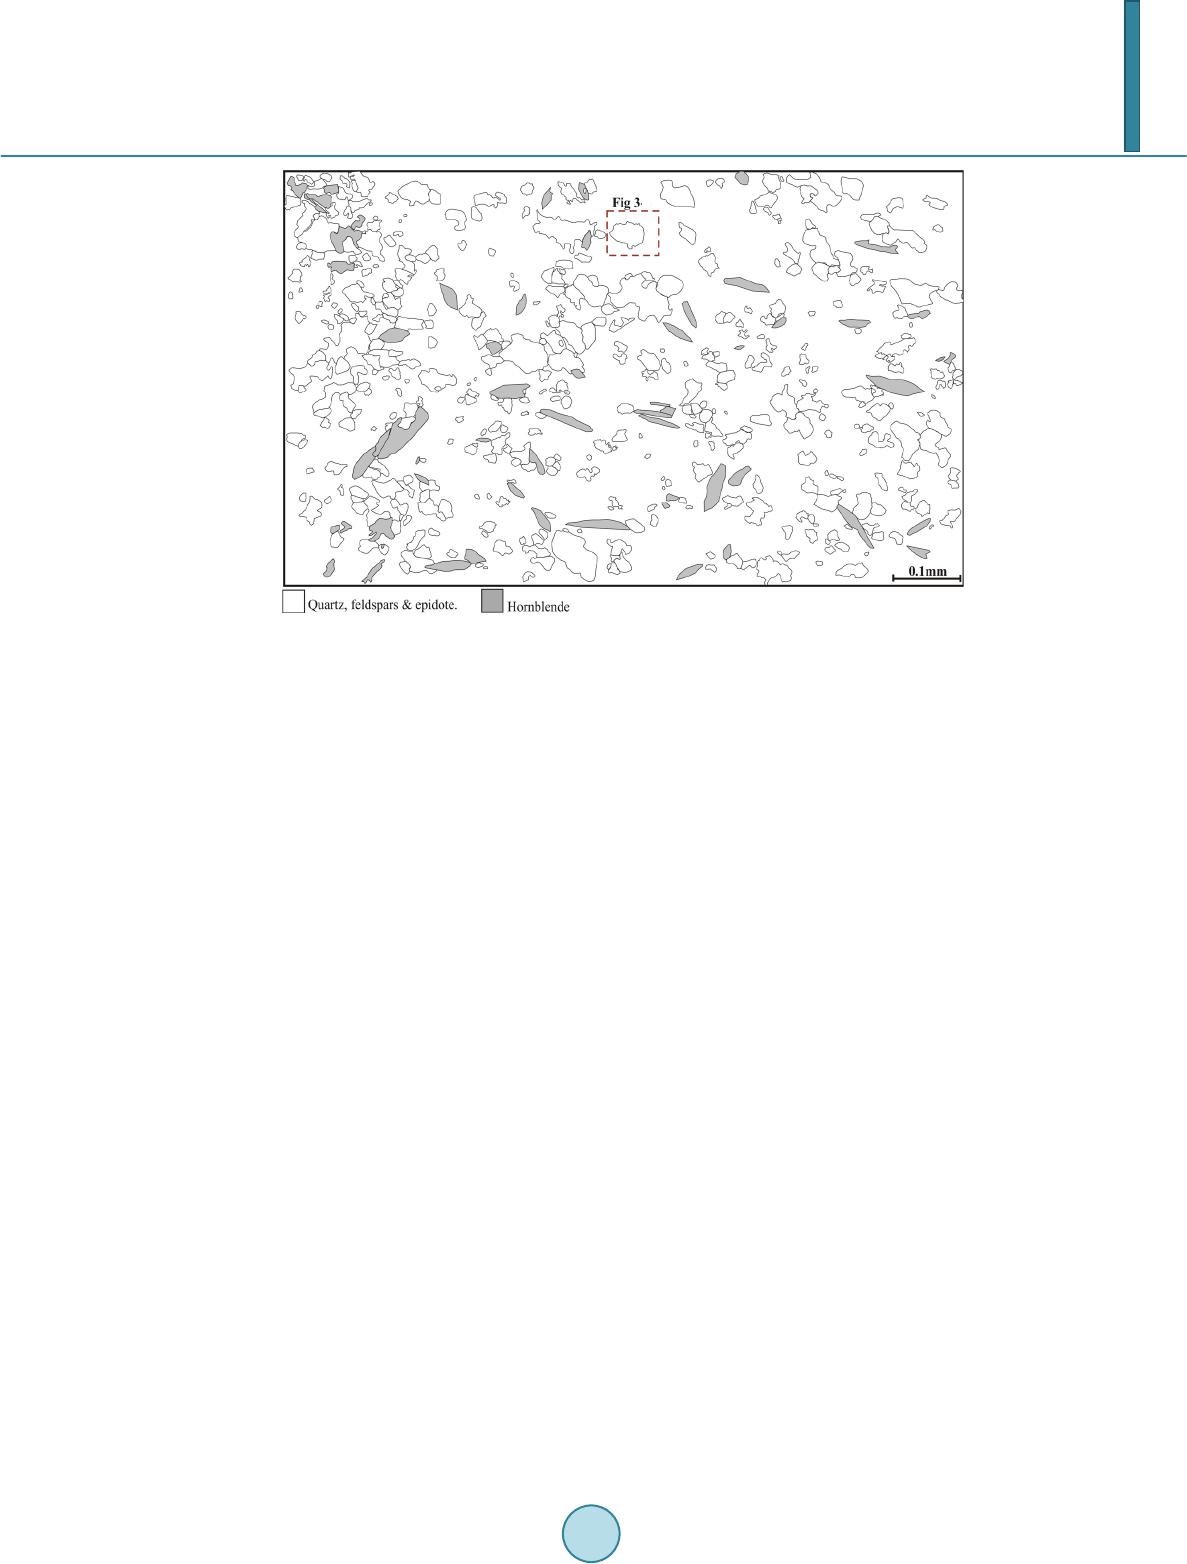 E. Ali, G. Wu Figure 2. Grain boundaries and preparation of a map of mineral grains from the thin sections. The following geometric parameters were evaluated using image analysis: Grain Size (GS), Grain Area (GA), Aspect Ratio (AR) and Shape Factor (SF) (Fig ure 3). Where, Aspect Ratio (AR) represents the ratio between the minor and major axis lengths and Shape factor (SF = 4× π × A/L P2) is a measure of the grain’s deviation from circularity, where ideal circle shows a shape parameter 1, objects with elongated or irregular shape show a shape factor close to 0 [2]. Due to the high degree of metamorphism and schistose texture of amphibolites, the study concerned on more resistant minerals which includes quartz, feldspars and plagioclase grains. Edges that do not form closed boundaries are not considered valid and are neglected. 3. Statistical Analyses on the Experimental Data 3.1. Basic Descriptive and Correlation Analysi s In line with the purpose of this study, data obtained from quantitative petrographic analysis and rock uniaxial compressive strength were subjected to a series of comprehensive statistical analyses using SPSS V.19.0. Origi- nal data set consist of eight independent variables including grain size, grain area, shape factor, aspect ratio, and quartz and hornblende contents, whereas UCS set as predictive (dependent) variable. The characteristics with the most significant influence upon others were considered useful indicators for predicting UCS. The descriptive statistics, displayed in Table 1, provide the minimum, maximum, median, means and standard deviations for each variables used in the current study. In order to visualize relationship between USC and each measured microfabrics characteristics original data set was subjected to bivariate correlation and curve fitting analyses (Figure 4). To see whether a trend is suffi- ciently correlated, Pearson's correlation coefficients (r) were investigated. Results from this linear correlation revealed that five of the eight predictive variables were exhibit statistically significant correlations with UCS at the 95% confidence level, which include grain size, grain area, shape factor, quartz and hornblende. Grain size is the most significant petrographical property affecting rock strength with negative r-value of 0.85 for UCS, which being in line with the previous studies by Přikryl [10] and Raisänen [19]. Similarly, strength of rocks tested decreases as the grain area increases with r-value of 0.86. Unlike UCS shows positive correlation with shape factor (r = 0.75). Other parameters of microfabrics are poorly correlated with UCS, aspect ratio (r = 0.13) as well as contents of Feldspar (r = 0.27) and plagioclase (r = 0.30) were weakly related with UCS at 95% safety. There found to be moderate correlation between quartz content of these amphibolite rocks and UCS with corre- lation coefficient of 0.52% at 95% confidence level. Essentially, previous studies about the relationship between quartz content and rock strength in sandstone rocks came up with a little pit similar results [20]. They reported that quartz shows a weak positive correlation with the strength. 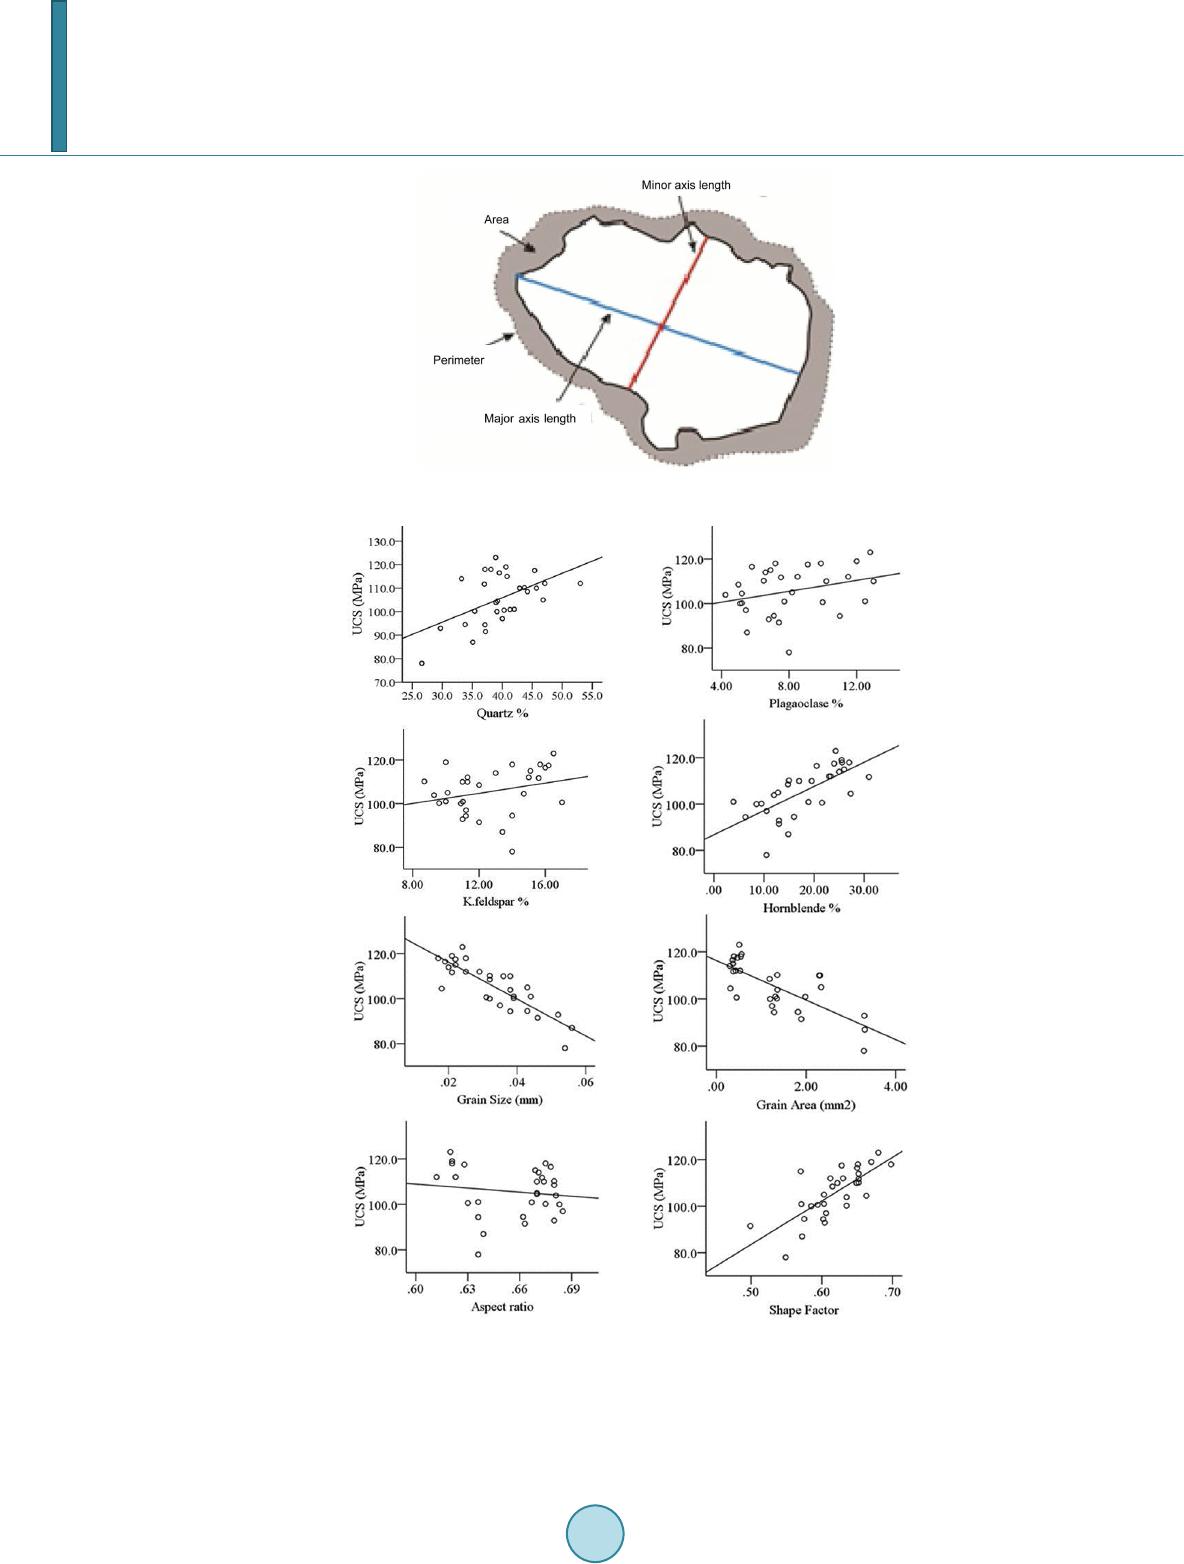 E. Ali, G. Wu Figure 3. Geo metric parameters measured by petrographic image analysis. Figure 4. Bivariate linear regression analyses of UCS against the microfabric characteristics of amphibolites. correlation coefficient (r): (Quartz = 0.52a; Hornblende = 0.69a; Plagioclase = 0.3; K.feldspar = 0.27; Grain Size = 0.85a; Grain Area = 0.84a; Aspect Ratior = 0.13; Shape Factorr = 0.75a). aVariable has significant relation in 95% confidence level.  E. Ali, G. Wu Table 1. Basic descriptive statistics for the original data set. Variables Min Max Mean Median Std. deviation Variance Quartz% 26.6 53. 0 39.66 39.35 5.34 28.54 Plagioclase% 4.23 13.00 8.06 7.46 2.58 6.66 K.feldspar% 8.70 17.01 12.69 12.00 2.45 6.00 Hornblende% 3.89 30.96 18.00 1 7.93 7.12 50.71 Grain Size (mm) 0.017 0.056 0.033 0.032 0.011 0.000 Grain Area (mm2) 226.9 2462 962.5 1.221 619.3 383558 Aspect Ratio 0.612 0.685 0.657 0.670 0.024 0.001 Shape Factor 0.499 0.698 0.618 0.620 0.043 0.002 UCS (MPa) 78.0 123.0 105.56 106.75 1 0.70 114.49 3.2. Development of Simple Regression Models To identify the proper regression model different empirical equations were tested to establish bivariate regres- sion models for UCS using each independent variable. Logarithmic (y = a + lnx), power (y = axb) and exponen- tial (y = aex) along with the linear (y = ax + b) curve fitting approximations were executed to fit the data. The results revealed that linear and exponential curve relations were fitted to the experimental data with higher cor- relations coefficients (R2) than the other models. When comparing these two functions, linear functions yielded correlation coefficients higher than those of exponential functions did. Thus, linear regressions model were pre- ferred in this study for predicting UCS and will be further employed in multivariate regression analysis. 3.3. Development of Multivariate Regression Models In fact, most of the problems in geology involve complex and interacting forces, which is impossible to isolate and study individually [21]. Thus, the multivariate regression (MR) technique is used to construct such complex prediction models. An important step in a multiple regression is to ensure that the assumption of no multicolli- nearity has been met. Since, multicollinearity is a statistical phenomenon in which two or more predictor va- riables in a multiple regression model are highly correlated. Therefore, MR aimed to make a choice among the existing independent variables in order to obtain the most appropriate model equation that clarifies the depen- dent variable according to the aim of usage [22]. For this purpose, stepwise regression method was applied, which usually furnishes indications that suggest further investigations. Multivariable regression function was assumed linear based on the results of simple regression analysis. Thus, the equation representing this model can be written as the following form: 01 1i22inki YXX. X ββ ββ =+++… + (1) where Y is the predicted value corresponding to the response, X1, X2, and Xn are the predictors and β1, β2, and βn are the regression coefficients of X1, X2, and Xn, The parametr β0 is constant representing the value of y when all the independent variables are zero. The strategy of the stepwise regression method is to select a subset of variables entirely by statistical criteria. The method combines forward selection and backward elimination. In this study, forward method is used. However five independent variables have been selected that include grain size, grain area, shape factor, quartz and hornblende content. The selection starts with the independent variable that is the best predictor of the de- pendent variable and checks that the coefficient is significantly different from zero, at the 5% level. The predic- tor variable that contributes the most to the prediction equation in terms of increasing the multiple’s correlation coefficient (R2) is entered first. Therefore, as mentioned above, grain size was the best predictor of UCS and was entered first. Then grain area was entered, and neither was removed. By using this stepwise regression, four pre- diction models that emerged from multiple regression analysis are worth noting: Model 1: UCS = 126.405 – 416.308*GS-0.007*GA; R2 = 0.73 Model 2: UCS = 76.75 – 6160803*GS + 79-643*SF; R2 = 0.78 Model 3: UCS = 52.214 – 527.77 *GS + 80.86*SF + 0.526*Q tz; R2 = 0.84 Model 4: UCS = 43.1 – 399.08*GS + 78.84*SF + 0.552*Qtz + 0.28*Hb; R2 = 0.86  E. Ali, G. Wu Table 2. Statistical summary and hypothesis tests of the multiple regression models. Model R2 Max Mean t Sig. F Sig. 1 0.73 37.02 0.000 GS −0.762 0.452 GA −0.751 0.459 2 Cons tant 0.78 3.573 0.001 48.64 0.000 GS −5.322 0.000 SF 2.628 0.014 3 Cons tant 0.84 2.597 0.015 46.76 0.000 GS −50.73 0.000 SF 3.086 0.005 Qtz 3.181 0.004 4 Cons tant 0.86 2.145 0.042 37.48 0.000 GS −3.194 0.004 SF 3.118 0.005 Qtz 3.45 0.002 Hb 1.726 0.097 4. Results and Discussion The statistical summary of the multivariate models are given in Table 2. Under the model summary table, one can see that the value of R2 always increases with the inclusion of additional predictor variables. Thus, this sta- tistic is intended not allow comparison between different sets of data, and may not be useful as indicator for this purpose. In fact, the effect of any given explanatory variable depends on which other variables have been in- cluded in the regression model; this situation indicates multicollinearity in the multivariate regression. Thus, two values F ratio and t-ratio tell us respectively whether there is a linear relationship between the response and ex- planatory variables taken together, and whether any given explanatory variable has an influence on the response variable over and above that of the other explanatory variables. From Table 2, it seen that the four models can be used for the prediction of UCS as they are statistically significant at 95% confidence limits depending on the F test. In despite of F statistic results, when considering the t-test, the study revealed that grain area (GA) and/or Hornblende (Hb) variables when included in the model are insignificant at 95% confidence level based on t-test due to the multicollinearity problem as shown in model 1 and 4. Similarly, when tested model 2, it seems un- likely that shape factor SF will be useful predictor of UCS at 95% confidence level, nevertheless, it turns out that, in the presence of grain size (GS), it does make an insignificant contribution to predicting UCS (Ta ble 2). From this, we can conclude that model 3 is good among these four models for the predicting UCS for the am- phibolite rocks. However, approximately 84% of the variance of the UCS can be estimated by the linear combi- nation of grain size, shape factor and quartz content. However, higher value on grain size predict lower value on uniaxial compressive strength (the coefficient is negative), but higher scores on the other two variables predict higher value on uniaxial compressive strength. To assess the model performances, some performance indices ([23]) such as correlation coefficient (r), va- riance account for (VAF) (Equation (2)) and root mean square error (RMSE) (Equation (3)) were calculated. ( ) ( ) ' var 1 100 var yy VAF y − =−× (2) (3) where y and y` are the measured and the predicted values, respectively, N is the number of data and var is the variance. 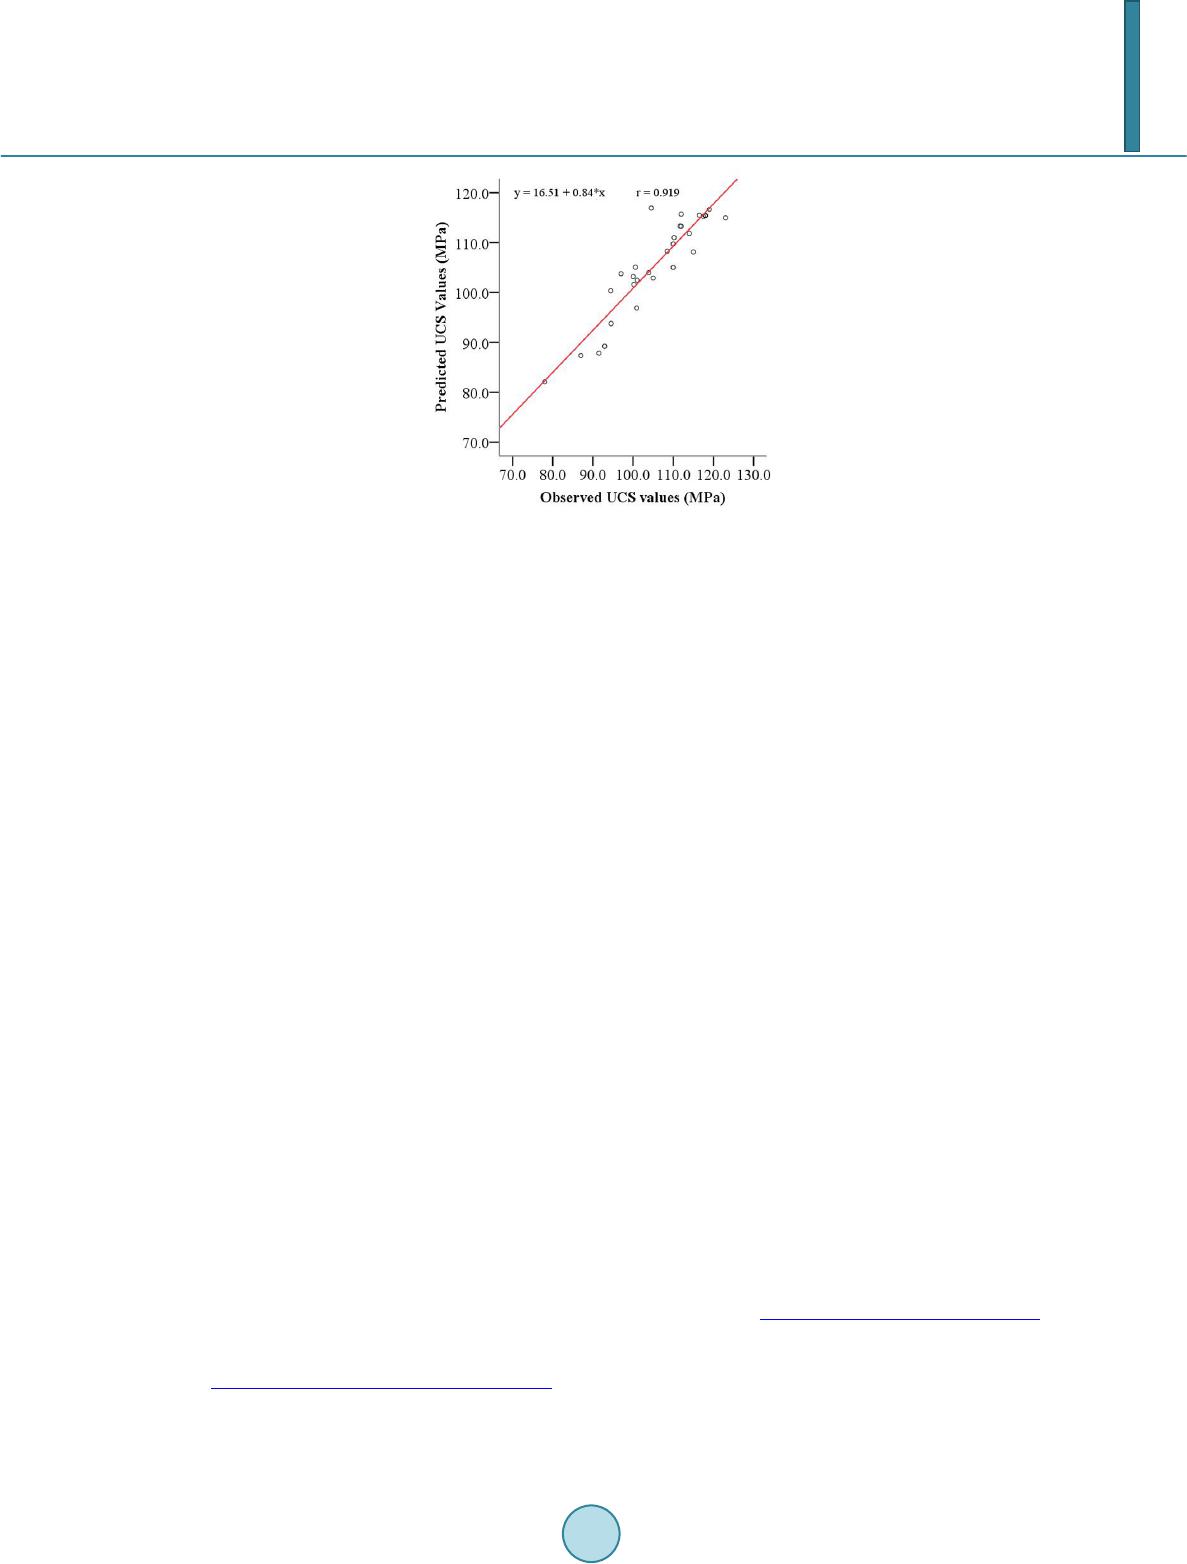 E. Ali, G. Wu Figure 5. Scatterplots of the values predicted by multiple linear regression models by those observed for UCS. By adopting the above equations, VAF is 97% and RMSE is 4.16. Accordingly, the high value of VAF and low value of RMSE indicating perfect model performs. In addition, scatterplot of the fitted UCS values against those observed for the multiple linear regression model is given in Figure 5 with correlation coefficient r = 0.919 that is statistically significant at 95% level. However, the results clearly indicate that the proposed multi- variate regression model is observed to be quite accurate in predicting the UCS in the experimental data set, which may serve microfabrics characterization approach to be widely used in geological engineering applica- tions. 5. Conclusions This study was established to formulate uniaxial compressive strength of selected banded amphibolite rocks as a function of microfabrics properties using multivariate regression based model. For this purpose, data obtained from quantitative petrographic analysis and rock uniaxial compressive strength (UCS) were subjected to a series of comprehensive statistical analyses using SPSS software version 19.0. Based on statistical analysis, more in- fluential microfabrics parameters that affect the UCS more the other do have been selected to predict UCS, which include grain size, shape factor and quartz content, which may use as predictor parameters in the absence of adequate geological information or abundant data, especially in anisotropic rocks of the same geological cha- racteristics. The following linear multiple regression model is obtained with high prediction performances (R = 0.919, VAF = 97%, RMSE = 4.16) UCS=52.214-527.77*GS+80.86*SF+0.526*Qtz Contr ar y to previous UCS models from textural characteristics, which they use less effective input parameters, this study employ a relatively smaller number of variables but more influential ones, which adequately represent the UCS of a given rock type. Further research is necessary to improve the reliability of the concluded equations on the amphibolite rocks. References [1] Jumikis, A.R. (1992) Rock Mechanics. Trans. Tech. Publications, Clausthal. [2] H o wa r t h, D.F. and Rowlands, J.C. (1987) Quantitative Assessment of Rock Texture and Correlation with Drillability and Strength Properties. Rock Mechanics and Rock Engineering, 20, 57-85. http://dx.doi.org/10.1007/BF01019511 [3] Basu , A. and Kamran, M. (2010) Point Load Test on Schistose Rocks and Its Applicability in Predicting Uniaxial Compressive Strength. International Journal of Rock Mechanics & Mining Sciences, 47, 823-828 . http://dx.doi.org/10.1016/j.ijrmms.2010.04.006 [4] Bruno, G., Vessia, G. and Bobbo , L. (2012) Statistical Method for Assessing the Uniaxial Compressive Strength of Carbonate Rock by Schmidt Hammer Tests Performed on Core Samples. Rock Mechanics and Rock Engineering, 46,  E. Ali, G. Wu 199-206. http://dx.doi.org/10.1007/s00603-012-0230-5 [5] Si ngh , T.N., Kainthola, A. and Venkatesh, A. (2012) A Correlation between Point Load Index and Uniaxial Compres- sive Strength for Different Rock Types. Rock Mechanics and Rock Engineering, 45, 259 -264. http://dx.doi.org/10.1007/s00603-011-0192-z [6] Khan del wal, M. (2013) Correlating P-Wave Velocity with the Physi co-Mechanical Properties of Different Rocks. Pure and Applied Geophysics, 170, 507-514. http://dx.doi.org/10.1007/s00024-012-0556-7 [7] Abdolazim, A. and Rassoul, A. (2013) An Empirical Correlation of Uniaxial Compressive Strength with P-Wave Ve- locity and Point Load Strength Index on Marly Rocks Using Statistical Method. Geotechnical and Geological Engi- neerin g, 32, 205-214. http://dx.doi.org/10.1007/s10706-013-9703 -x [8] Seo , Y.S., Jeong, G.C., Kim, J.S. and Ichikawa, Y. (2002) Microscopic Observation and Contact Stress Analysis of Granite under Compression. Engineering Geology, 63, 259-275 . http://dx.doi.org/10.1016/S0013-7952(01 )00 086 -2 [9] V erno n, R.H. (2004) A Practical Guide to Rock Microstructure. Cambridge University Press, Cambridge. http://dx.doi.org/10.1017/CBO9780511807206 [10] Přikryl, R. (2006) Assessment of Rock Geomechanical Quality by Quantitative Rock Fabric Coefficients: Limitations and Possible Source of Misinterpretations. Engineering Geology, 87, 149-16 2 . http://dx.doi.org/10.1016/j.enggeo.2006.05.011 [11] Sin gh , V.K., Singh, D. and Si ngh, T.N. (2001) Prediction of Strength Properties of Some Schistose Rocks from P etro- graphic Properties Using Artificial Neural Netwo r ks . International Journal of Rock Mechanics & Mining Sciences, 38, 269-284. http://dx.doi.org/10.1016/S1365-1609(00 )00 078 -2 [12] Gokc eogl u, C., Sonmez, H. and Zorlu, K. (2009) Estimating the Uniaxial Compressive Strength of Some Clay Bearing Rocks Selected from Turkey by Nonlinear Multivariable Regression and Rule-Based Fuzzy Models. Expert Systems, 26, 176-190. http://dx.doi.org/10.1111/j.1468-0394.2009.00475.x [13] Zorlu, K., Gokceoglu, C., Ocakoglu, F., Nefeslioglu, H.A. and Acikalin, S. (2008) Prediction of Uniaxial Compressive Strength of Sandstones Using Petrography Based Models. Engineering Geology, 96, 141-158. http://dx.doi.org/10.1016/j.enggeo.2007.10.009 [14] Yesiloglu-Gultekin, N., Sezer, E.A., Gokceoglu, C. and Bayh an , H. (2013) An Application of Adaptive Neuro Fuzzy Inference System for Estimating the Uniaxial Compressive Strength of Certain Granitic Rocks from Their Mineral Contents. Expert Systems with Applications, 40, 921-92 8 . http://dx.doi.org/10.1016/j.eswa.2012.05.048 [15] Jeng, F.S., Weng, M.C., Lin, M.L. and Huang, T.H. (2004) Influence of Petrographic Parameters on Geotechnical Properties of Tertiary Sandstones from Taiwan. Engineering Geology, 73, 71-91. http://dx.doi.org/10.1016/j.enggeo.2003.12.001 [16] ASTM (2001) Standard Practice for Preparing Rock Core Specimens and Determining Dimensional and Shape Toler- ances. Am Soc Test Mater D4543. [17] ASTM (2010) ASTM D7012-10, Standard Test Method for Compressive Strength and Elastic Moduli of Intact Rock Core Specimens under Varying States of Stress and Temperatu res. [18] TIGER 3000P Polarized Software TC-M013, Version (2012) Chongqing Science and Technology Company. [19] Raisän en, M. (2004) Relationships between Texture and Mechanical Properties of Hybrid Rocks from the Jaal-Iitti Complex, Southeastern Finland. Engineering Geology, 74, 197-211 . http://dx.doi.org/10.1016/j.enggeo.2004.03.009 [20] Shakoor, A. and Bonelli, R.E. (1991) Relationship between Petrographic Characteristics, Engineering Properties, and Mechanical Properties of Selected Sandstones. Bulletin of the International Association of Engineering Geology, 26, 55-71. [21] Davis , J.C. (1973) Statistics and Data Analysis in Geology. Wiley, New York, 550 p. [22] Harrell , F.E. (2001) Regression Modeling Strategies: With Applications to Linear Models, Logistic Regression, and Survival Analysis. Springer-Verlag, New York. http://dx.doi.org/10.1007/978-1-4757-3462-1 [23] Fin ol , J., Guo, Y.K. and Jing, X.D. (2001) A Rule Based Fuzzy Model for the Prediction of Petrophysical Rock Para- meters. Journal of Petroleum Science and Engineering, 29, 97-113 . http://dx.doi.org/10.1016/S0920-4105(00)00096-6
|