103
Leading Indicators of Heating Coal Pricing in Turkey: A Coal Pricing Model (2003-2009)
namely, producer price index, producer price index for
mining and stone quarrying industry, consumer price
index, and consumer price index for electricity, gas and
other fuels. Base year of the price indexes is 2003. Data
were taken from the electronic data delivery system of
Central Bank of the Republic of Turkey (CBRT). Index
of Wages per Production Hour Worked in Manufacturing
of Cook and Refined Petroleum, whose base year is 1997,
is used as a proxy for the unit labour costs. Monthly data
are obtained through an interpolation by linear method as
the wage index is available only at a quarterly frequency
in the CBRT Electronic Data Delivery System. The elec-
tricity price is used as a proxy variable to capture the
effect of prices of other cost inputs on coal price levels.
The data were taken from the Turkish Statistics Institu-
tion (TL per KWh, The COICOP code is 0451001).
Industrial Production Index, whose base year is 2005,
is used as a proxy to measure real income at a monthly
frequency. Data source is the Electronic Data Delivery
System of the CBRT. To account for the seasonal ef-
fects, the data are seasonally adjusted by using the
Tramo/Seats method. All data in this study are in loga-
rithmic form.
2. Methods
2.1. Granger Causality Test for the Leading Indi-
cators
Granger [2], [3], [4], proposed a time-series data based
approach in order to determine causality relationships
among variables. According to Granger [2], the defini-
tion of causality is based entirely on the predictability of
some series, say. If some other series contains informa-
tion in past terms that helps in the prediction of and if
this information is contained in no other series used in
the predictor, then is said to Granger cause. Granger
causality has been used in the context of rational expec-
tations, definition of strong exogeneity, and econometric
modelling strategy. A better term for Granger causality is
precedence [5]. Therefore, this test can be used for de-
termining leading indicators of any variable. We may
also use the results of Granger causality for evaluating
forecasting performance since it is concerned with one-
ahead forecast accuracy.
Park and Philips [6], Sims, Stock and Watson [7] and
Toda and Philips [8] have shown that the standard as-
ymptotic theory is not applicable to hypothesis testing in
level VAR model if the variables are integrated or coin-
tegrated. Therefore, the usual Wald test statistics for
Granger non-causality based on level VAR not only has
nonstandard asymptotic distribution but depends on nui-
sance parameters in general if variables are nonstation-
ary.
In this study, we examine Granger causal relationships
between Turkish coal prices and other variables using
Toda-Yamamoto [9] approach to determine the leading
indicators for Turkish coal price level. Toda-Yamamoto
procedure considers a lag augmented or modified Wald
(M-Wald) test which has conventional asymptotic chi-
square (2
) distribution when a VAR (p + dmax) is es-
timated where dmax is the maximal order of integration
suspected to occur in the system. In other words, this lag
augmentation procedure provides standard asymptotic
although the time series have integration/cointegration
properties, and therefore, can be applied without a priori
information about the presence (absence) and location of
unit roots. The results of Granger causality test based on
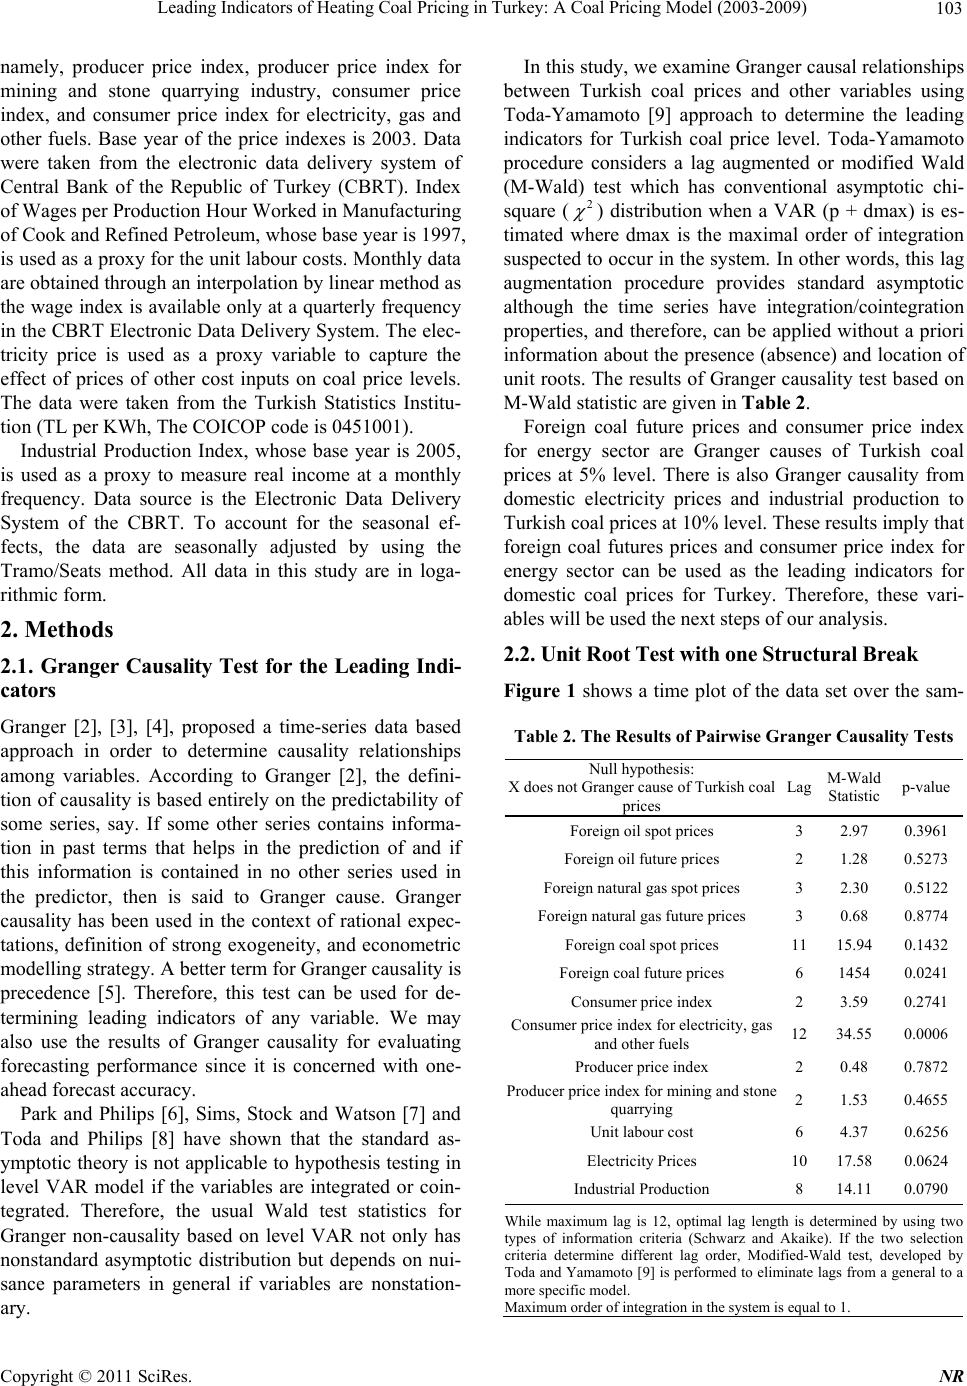
M-Wald statistic are given in Table 2.
Foreign coal future prices and consumer price index
for energy sector are Granger causes of Turkish coal
prices at 5% level. There is also Granger causality from
domestic electricity prices and industrial production to
Turkish coal prices at 10% level. These results imply that
foreign coal futures prices and consumer price index for
energy sector can be used as the leading indicators for
domestic coal prices for Turkey. Therefore, these vari-
ables will be used the next steps of our analysis.
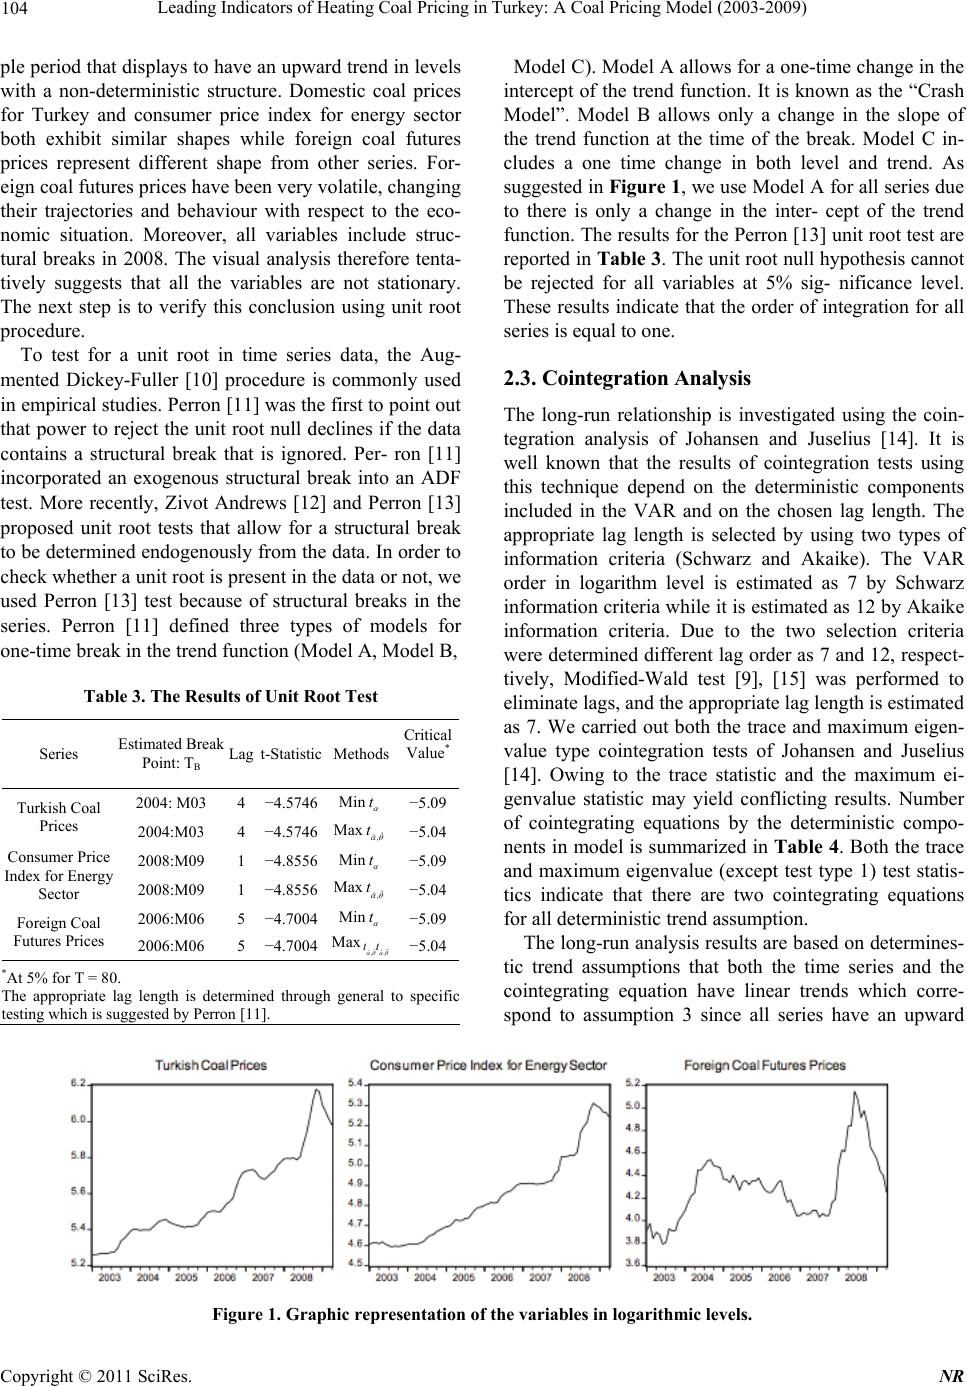
2.2. Unit Root Test with one Structural Break
Figure 1 shows a time plot of the data set over the sam-
Table 2. The Results of Pairwise Granger Causality Tests
Null hypothesis:
X does not Granger cause of Turkish coal
prices
Lag M-Wald
Statistic p-value
Foreign oil spot prices 3 2.97 0.3961
Foreign oil future prices 2 1.28 0.5273
Foreign natural gas spot prices 3 2.30 0.5122
Foreign natural gas future prices 3 0.68 0.8774
Foreign coal spot prices 11 15.94 0.1432
Foreign coal future prices 6 1454 0.0241
Consumer price index 2 3.59 0.2741
Consumer price index for electricity, gas
and other fuels 12 34.55 0.0006
Producer price index 2 0.48 0.7872
Producer price index for mining and stone
quarrying 2 1.53 0.4655
Unit labour cost 6 4.37 0.6256
Electricity Prices 10 17.58 0.0624
Industrial Production 8 14.11 0.0790
While maximum lag is 12, optimal lag length is determined by using two
types of information criteria (Schwarz and Akaike). If the two selection
criteria determine different lag order, Modified-Wald test, developed by
Toda and Yamamoto [9] is performed to eliminate lags from a general to
more specific model.
Maximum order of integration in the system is equal to 1.
Copyright © 2011 SciRes. NR