 American Journal of Oper ations Research, 2011, 1, 25-32 doi:10.4236/ajor.2011.12004 Published Online June 2011 (http://www.SciRP.org/journal/ajor/) Copyright © 2011 SciRes. AJOR Component-Oriented Reliability Analysis Based on Hierarchical Bayesian Model for an Open Source Software Yoshinobu Tamura1, Hidemitsu Takehara2, Shigeru Yamada2 1Graduat e S chool of Sci e n ce and Enginee ring, Yamaguchi University, Ube, Japan 2Graduat e School of Engineering, Tottori University, Tottori, Japan E-mail: tamura@yamaguchi-u.ac.jp, M09T7016M@edu.tottori-u.ac.jp, yamada@sse.tottori-u.ac.jp Received March 11, 2011; revised April 10, 2011; accepted May 9, 2011 Abstract The successful experience of adopting distributed development models in such open source projects includes GNU/Linux operating system, Apache HTTP server, Android, BusyBox, and so on. The open source project contains special features so-called software composition by which several geographically-dispersed compo- nents are developed in all parts of the world. We propose a method of component-oriented reliability as- sessment based on hierarchical Bayesian model and Markov chain Monte Carlo methods. Especially, we fo- cus on the fault-detection rate for each component reported to the bug tracking system. We can assess the reliability for the whole open source software system by using the confidence interval for each component. Also, we analyze actual software fault-count data to show numerical examples of reliability assessment for OSS. Keywords: Open Source Software, Reliability, Bayesian Model, Markov Chain Monte Carlo Method 1. Introduction Software development environment has changed into new development paradigms such as concurrent distributed de- velopment environment and the so- called open source pro- ject by using network computing technologies [1]. Espe- cially, such OSS (Open Source Software) systems which serve as key components of critical infrastructures in the society are still ever-expanding now [2]. The methodology of the object-oriented design and analysis is a feature of distributed development environment and greatly success- ful in the field of programming-language, simulation, GUI (graphical user interface), and constructing on database in the software development. A general idea of the object- oriented design and analysis is developed as a technique which can easily construct and maintain the complex sys- tem. The successful experience of adopting the distributed development model in such open source projects includes GNU/Linux operating system [2]. However, the poor han- dling of the quality and customer support prohibit the pro- gress of OSS. We focus on the problems in the software quality, which prohibit the progress of OSS. Especially, many software reliability growth models (SRGM’s) [3] have been applied to assess the reliability for quality management and testing-progress control of software development. On the other hand, the effective method of dynamic testing management for a new dis- tributed development paradigm as typified by the open source project has only a few presented [4-8]. In case of considering the effect of the debugging process on entire system in the development of a method of reliability as- sessment for OSS, it is necessary to grasp the situation of registration for bug tracking system, the connection status of each component, degree of maturation of OSS, and so on [9,10]. Especially, OSS is composed of several software com- ponents as a feature of distributed development envi- ronment. In such cases, it is appropriate to apply the me- thod of component based reliability assessment rather than one of reliability assessment based on SRGM’s. Many SRGM’s are assumed to be suitable for the system testing phase of software development. On the other h and, it is difficult to apply SRGM’s to OSS, because OSS development style has not the typical software develop- ment environment, i.e., OSS development cycle has no testing phase. Moreover, OSS is developed under a com- bination of many software components. Therefore, it is important for software developers to confirm the static state of each component in OSS development phase from the standpoint of reliability assessment [6-8]. The char- 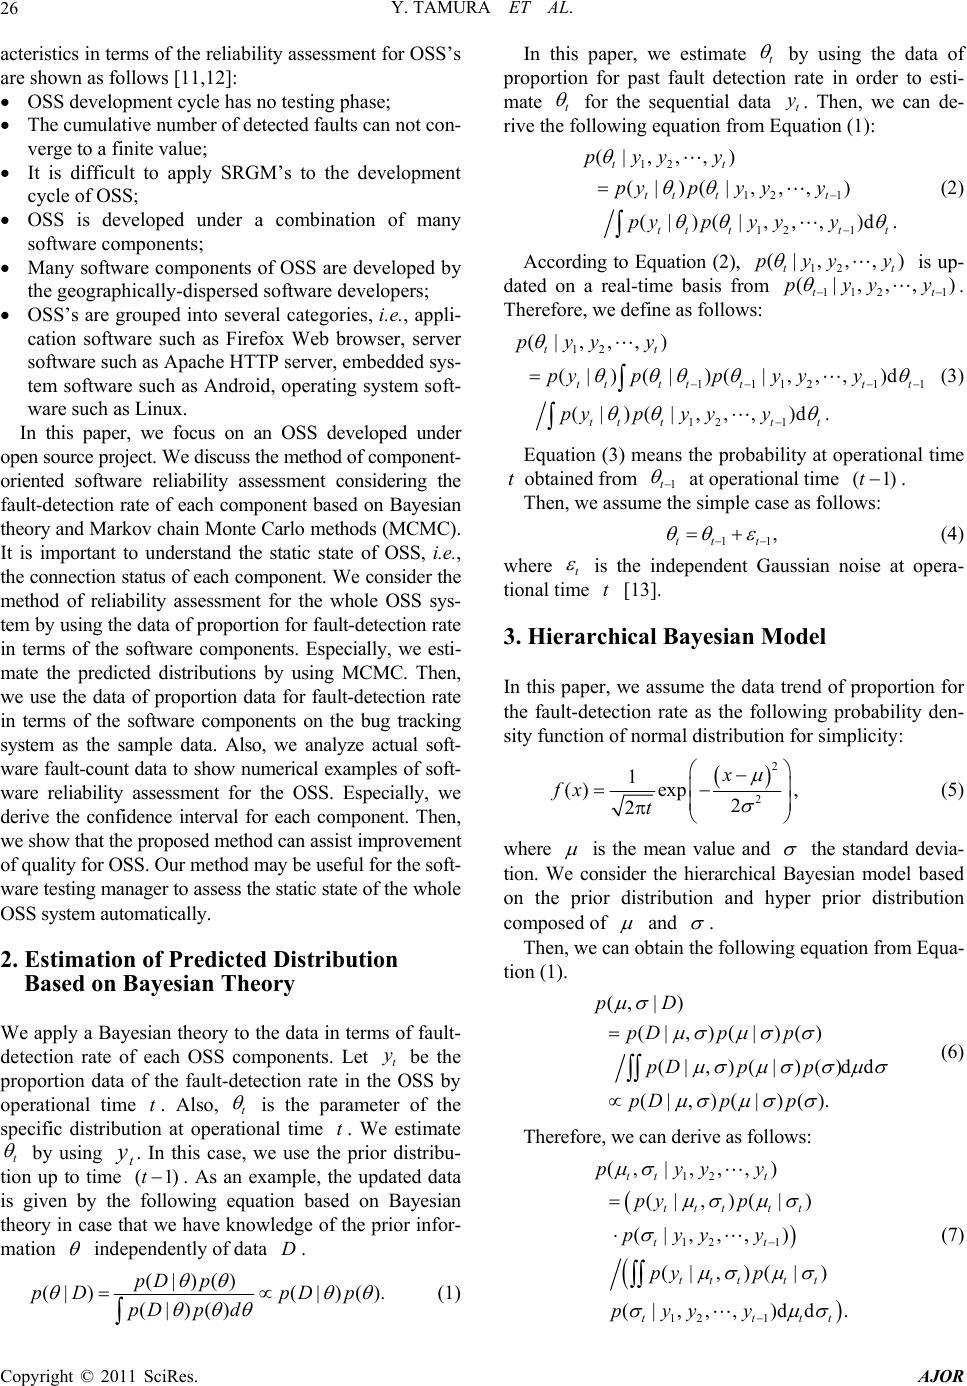 Y. TAMURA ET AL. 26 acteristics in terms of the reli ability assess ment fo r OSS ’s are shown as follows [11,12]: OSS development cycle has no testing phase; The cumulative number of detected faults can not con- verge to a finite value; It is difficult to apply SRGM’s to the development cycle of OSS; OSS is developed under a combination of many software components; Many software components of OSS are developed by the geographically-dispersed software developers; OSS’s are grouped into several categories, i.e., appli- cation software such as Firefox Web browser, server software such as Apache HTTP server, embedded sys- tem software such as Android, operating system soft- ware s uch as Linux. In this paper, we focus on an OSS developed under open source project. We discuss the method of component- oriented software reliability assessment considering the fault-detection rate of each component based on Bayesian theory and Markov chain Monte Carlo methods (MCMC). It is important to understand the static state of OSS, i.e., the connection status of each component. We consider the method of reliability assessment for the whole OSS sys- tem by using the data of proportion for fault-detection rate in terms of the software components. Especially, we esti- mate the predicted distributions by using MCMC. Then, we use the data of proportion data for fault-detection rate in terms of the software components on the bug tracking system as the sample data. Also, we analyze actual soft- ware fault-count data to show numerical examples of soft- ware reliability assessment for the OSS. Especially, we derive the confidence interval for each component. Then, we show that the proposed m e t hod can assi st improvement of quality for OSS. Our method may be useful for the soft- ware testing manager to assess the static state of the whole OSS system automatically. 2. Estimation of Predicted Distribution Based on Bayesian Theory We apply a Bayesian theory to the data in terms of fault- detection rate of each OSS components. Let t be the proportion data of the fault-detection rate in the OSS by operational time y . Also, t is the parameter of the specific distribution at operational time . We estimate t by using y . In this case, we use the prior distribu- tion up to time . As an example, the updated data is given by the following equation based on Bayesian theory in case that we hav e knowledge of the prior infor- mation (t1) independently of data . D (|)() (| )( |)(). (|)() pD p pD pDp pDp d (1) In this paper, we estimate t by using the data of proportion for past fault detection rate in order to esti- mate t for the sequential data . Then, we can de- rive the following equation from Equation (1): t y 12 12 1 12 1 (|, , , ) (|)(|, , , ) (|)(|, , , )d. tt tt tt tt ttt pyy y pypy yy pypy yy (2) According to Equation (2), 12 (|, , , ) tt pyy y 112 (|, , pyy is up- dated on a real-time basis from 1 , ) tt y . Therefore, we define as follows: 12 1112 1 12 1 (|, , , ) (|)(|)(|, , , )d (|)(|, , , )d. tt tttttt t tt ttt pyy y pyppy yy pypy yy 1 (3) Equation (3) means the probab ility at operational time obtained from t1t at operational time . (1)t Then, we assume the simple case as follows: 11 , tt t (4) where t is the independent Gaussian noise at opera- tional time [13]. 3. Hierarchical Bayesian Model In this paper, we assume the data trend of proportion for the fault-detection rate as the following probability den- sity function of normal distribution for simplicity: 2 2 1 () exp, 2 2 x fx t (5) where is the mean value and the standard devia- tion. We consider the hierarchical Bayesian model based on the prior distribution and hyper prior distribution composed of and . Then, we can obtain the following equation from Equa- tion (1). (, |) (|, )(|)() (|, )(|)()dd (|, )(|)(). pD pDp p pDp p pDp p (6) Therefore, we can derive as follows: 12 12 1 12 1 (, |, , , ) (|, )(|) (|, , , ) (|, )(|) (|, , , )dd. tt t ttt tt tt ttt tt ttt pyyy py p pyy y py p pyy yt (7) Copyright © 2011 SciRes. AJOR 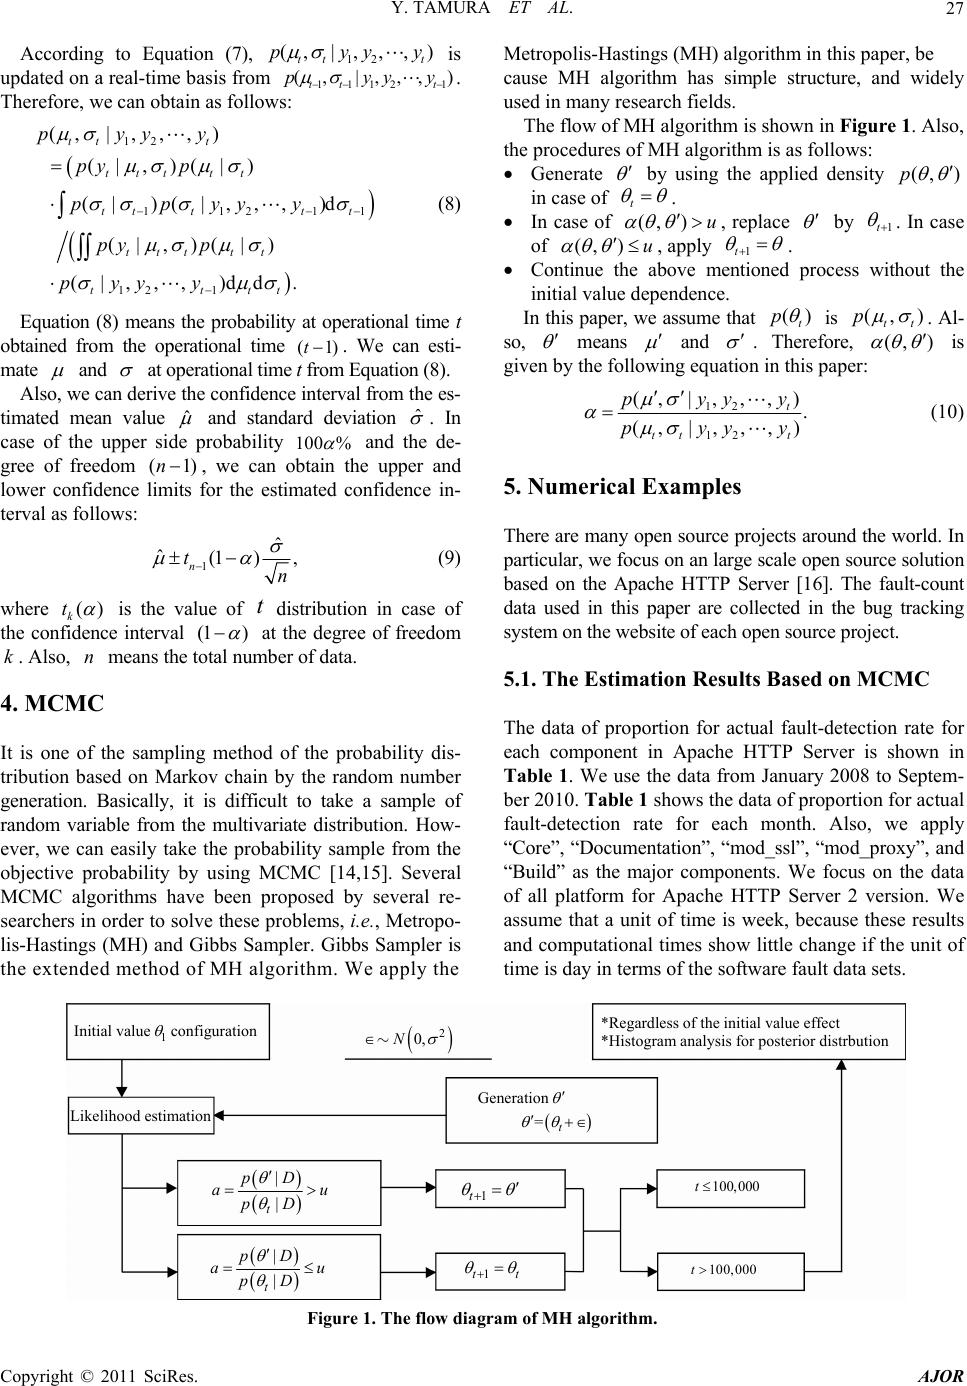 Y. TAMURA ET AL. Copyright © 2011 SciRes. AJOR 27 y According to Equation (7), 12 (, | , , , ) tt t pyy 1112 (, |, , , tt Metropolis-Hastings (MH) algorithm in this paper, be is updated on a real-time basis from 1 ) t yy y . Therefore, we can obtain as follows: cause MH algorithm has simple structure, and widely used in many research fields. The flow of MH algorithm is shown in Figure 1. Also, the procedures of MH algorithm is as follows: 12 1121 12 1 (, | , , , ) (|, )(|) (|)(|, , , )d (|, )(|) (|, , , )dd. tt t ttt tt tttt t ttt tt tttt pyyy py p ppyyy py p pyy y 1 (8) Generate by using the applied density (,p ) in case of t . In case of (, )u , replace by 1t . In case of (, )u , apply 1t . Continue the above mentioned process without the initial value dependence. In this paper, we assu me that () t p is (, ) tt p . Al- so, means and . Therefore, (, ) is given by the following equation in this paper: Equation (8) means the probability at operational time t obtained from the operational time . We can esti- mate (1)t and at operational time t from Equation (8). Also, we can derive the confidence interval from the es- timated mean value ˆ and standard deviation ˆ. In case of the upper side probability 100 % and the de- gree of freedom (, we can obtain the upper and lower confidence limits for the estimated confidence in- terval as follows: 1)n 12 12 (, |, , , ). (, | , , , ) t tt t pyyy pyyy (10) 5. Numerical Examples There are many open source projects around the world. In particular, we focus on an large scale open source solution based on the Apache HTTP Server [16]. The fault-count data used in this paper are collected in the bug tracking system on the website of each open source pr oject. 1ˆ ˆ(1 ), n tn (9) where k()t is the value of distribution in case of the confidence interval t (1 ) at the degree of freedom . Also, means the total number of data. kn 5.1. The Estimation Results Based on MCMC 4. MCMC The data of proportion for actual fault-detection rate for each component in Apache HTTP Server is shown in Table 1. We use the data from January 2008 to Septem- ber 2010. Table 1 shows the data of proportion for actual fault-detection rate for each month. Also, we apply “Core”, “Documentation”, “mod_ssl”, “mod_proxy”, and “Build” as the major components. We focus on the data of all platform for Apache HTTP Server 2 version. We assume that a unit of time is week, because these results and computation al times show little chan ge if the unit of time is day in terms of the software fault data sets. It is one of the sampling method of the probability dis- tribution based on Markov chain by the random number generation. Basically, it is difficult to take a sample of random variable from the multivariate distribution. How- ever, we can easily take the probability sample from the objective probability by using MCMC [14,15]. Several MCMC algorithms have been proposed by several re- searchers in order to solve these problems, i.e., Metropo- lis-Hastings (MH) and Gibbs Sampler. Gibbs Sampler is the extended method of MH algorith m. We apply the | | t pD au pD | | t pD au pD 1tt 1t 100,0 00t 100,000t *Regardless of the initial value effect *Histogram analysis for posterior distrbut ion Generation =t 2 0,N Likelihood estimation Initial value1 configuration Figure 1. The flow diagram of MH algorithm. 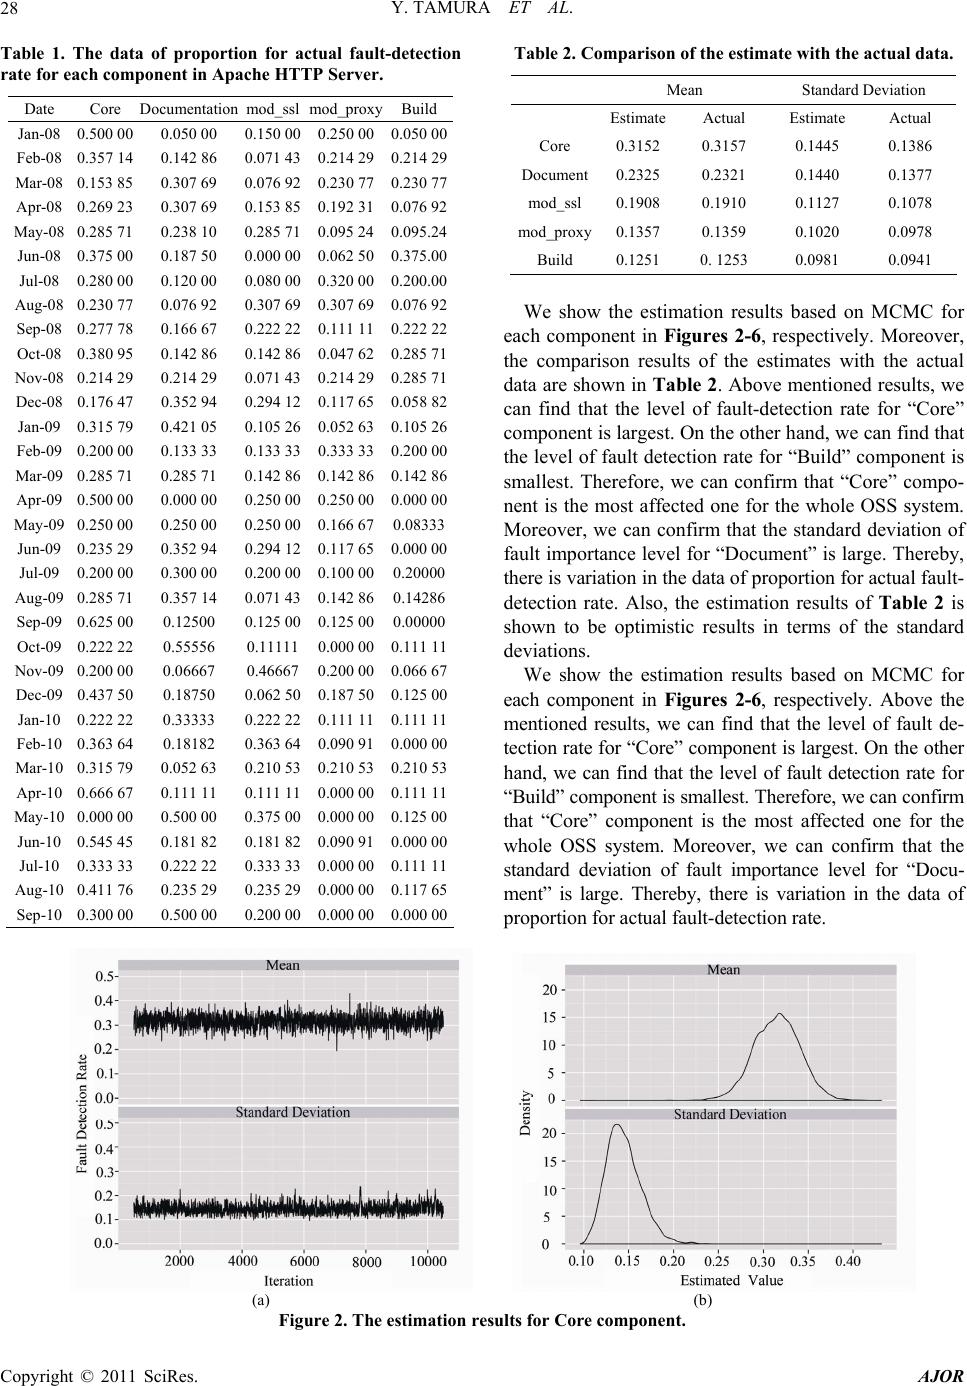 Y. TAMURA ET AL. Copyright © 2011 SciRes. AJOR 28 Table 1. The data of proportion for actual fault-detection rate for each component in Apache HTTP Server. Date Core Documentationmod_ssl mod_proxyBuild Jan-08 0.500 00 0.050 00 0.150 00 0.250 00 0.050 00 Feb-08 0.357 14 0.142 86 0.071 43 0.214 29 0.214 29 Mar-08 0.153 85 0.307 69 0.076 92 0.230 77 0.230 77 Apr-08 0.269 23 0.307 69 0.153 85 0.192 31 0.076 92 May-08 0.285 71 0.238 10 0.285 71 0.095 24 0.095.24 Jun-08 0.375 00 0.187 50 0.000 00 0.062 50 0.375.00 Jul-08 0.280 00 0.120 0 0 0.080 00 0.320 00 0.200.00 Aug-08 0.230 77 0.076 92 0.307 69 0.307 69 0.076 92 Sep-08 0.277 78 0.166 67 0.222 22 0.111 11 0.222 22 Oct-08 0.380 95 0.142 86 0.142 86 0.047 62 0.285 71 Nov-08 0.214 29 0.214 29 0.071 43 0.214 29 0.285 71 Dec-08 0.176 47 0.352 94 0.294 12 0.117 65 0.058 82 Jan-09 0.315 79 0.421 05 0.105 26 0.052 63 0.105 26 Feb-09 0.200 00 0.133 33 0.133 33 0.333 33 0.200 00 Mar-09 0.285 71 0.285 71 0.142 86 0.142 86 0.142 86 Apr-09 0.500 00 0.000 00 0.250 00 0.250 00 0.000 00 May-09 0.250 00 0.250 00 0.250 00 0.166 67 0.08333 Jun-09 0.235 29 0.352 94 0.294 12 0.117 65 0.000 00 Jul-09 0.200 00 0.300 0 0 0.200 00 0.100 00 0.20000 Aug-09 0.285 71 0.357 14 0.071 43 0.142 86 0.14286 Sep-09 0.625 00 0.12500 0.125 00 0.125 00 0.00000 Oct-09 0.222 22 0.5555 6 0.11111 0.000 00 0.111 11 Nov-09 0.200 00 0.06667 0.46667 0.200 00 0.066 67 Dec-09 0.437 50 0.18750 0.062 50 0.187 50 0.125 00 Jan-10 0.222 22 0.33333 0.222 22 0.111 11 0.111 11 Feb-10 0.363 64 0.18182 0.363 64 0.090 91 0.000 00 Mar-10 0.315 79 0.052 63 0.210 53 0.210 53 0.210 53 Apr-10 0.666 67 0.111 11 0.111 11 0.000 00 0.111 11 May-10 0.000 00 0.500 00 0.375 00 0.000 00 0.125 00 Jun-10 0.545 45 0.181 82 0.181 82 0.090 91 0.000 00 Jul-10 0.333 33 0.222 2 2 0.333 33 0.000 00 0.111 11 Aug-10 0.411 76 0.235 29 0.235 29 0.000 00 0.117 65 Sep-10 0.300 00 0.500 00 0.200 00 0.000 00 0.000 00 Table 2. Comparison of the estimate with the actual data. Mean Standard Deviation EstimateActual Estimate Actual Core 0.3152 0.3157 0.1445 0.1386 Document0.2325 0.2321 0.1440 0.1377 mod_ssl 0.1908 0.1910 0.1127 0.1078 mod_proxy0.1357 0.1359 0.1020 0.0978 Build 0.1251 0. 1253 0.0981 0.0941 We show the estimation results based on MCMC for each component in Figures 2-6, respectively. Moreover, the comparison results of the estimates with the actual data are shown in Table 2. Above mentioned results, we can find that the level of fault-detection rate for “Core” component is largest. On the other hand, we can find that the level of fault detection rate for “Build” component is smallest. Therefore, we can confirm that “Core” compo- nent is the most affected one for the whole OSS system. Moreover, we can confirm that the standard deviation of fault importance level for “Do cument” is large. Thereby, there is variation in th e data of propo rtion fo r actual f au lt- detection rate. Also, the estimation results of Table 2 is shown to be optimistic results in terms of the standard deviations. We show the estimation results based on MCMC for each component in Figures 2-6, respectively. Above the mentioned results, we can find that the level of fault de- tection rate for “Core” component is largest. On the other hand, we can find that the level of fault detection rate for “Build” component is smallest. Therefore, we can conf ir m that “Core” component is the most affected one for the whole OSS system. Moreover, we can confirm that the standard deviation of fault importance level for “Docu- ment” is large. Thereby, there is variation in the data of proportion for act ual fault -detect i on rat e. (a) (b) Figure 2. The estimation results for Core component. 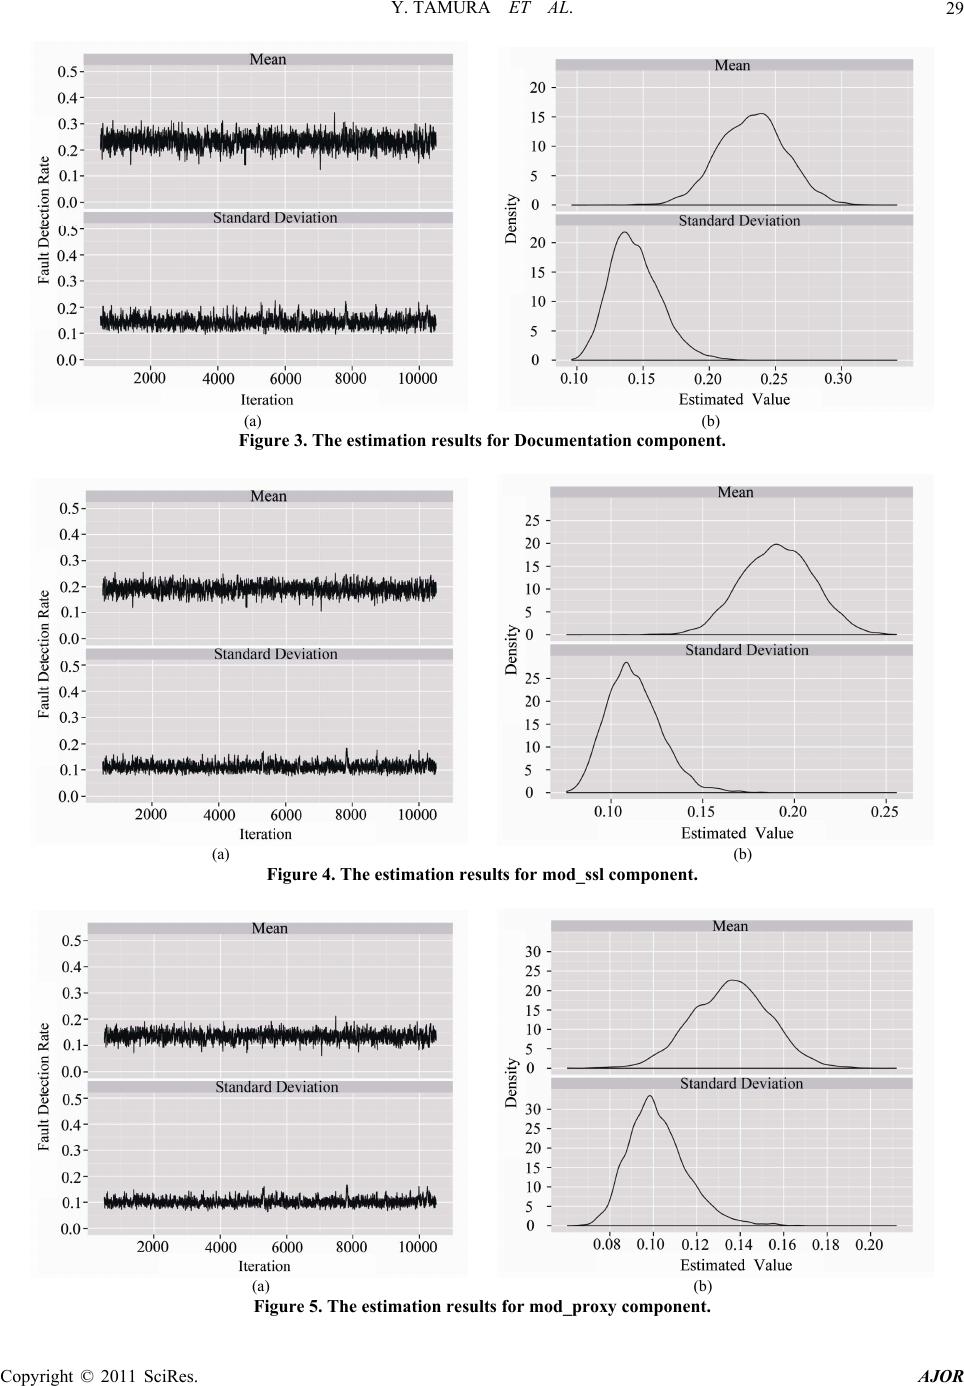 Y. TAMURA ET AL.29 (a) (b) Figure 3. The estimation results for Documentation component. (a) (b) Figure 4. The estimation results for mod_ssl component. (a) (b) Figure 5. The estimation results for mod_proxy component. Copyright © 2011 SciRes. AJOR 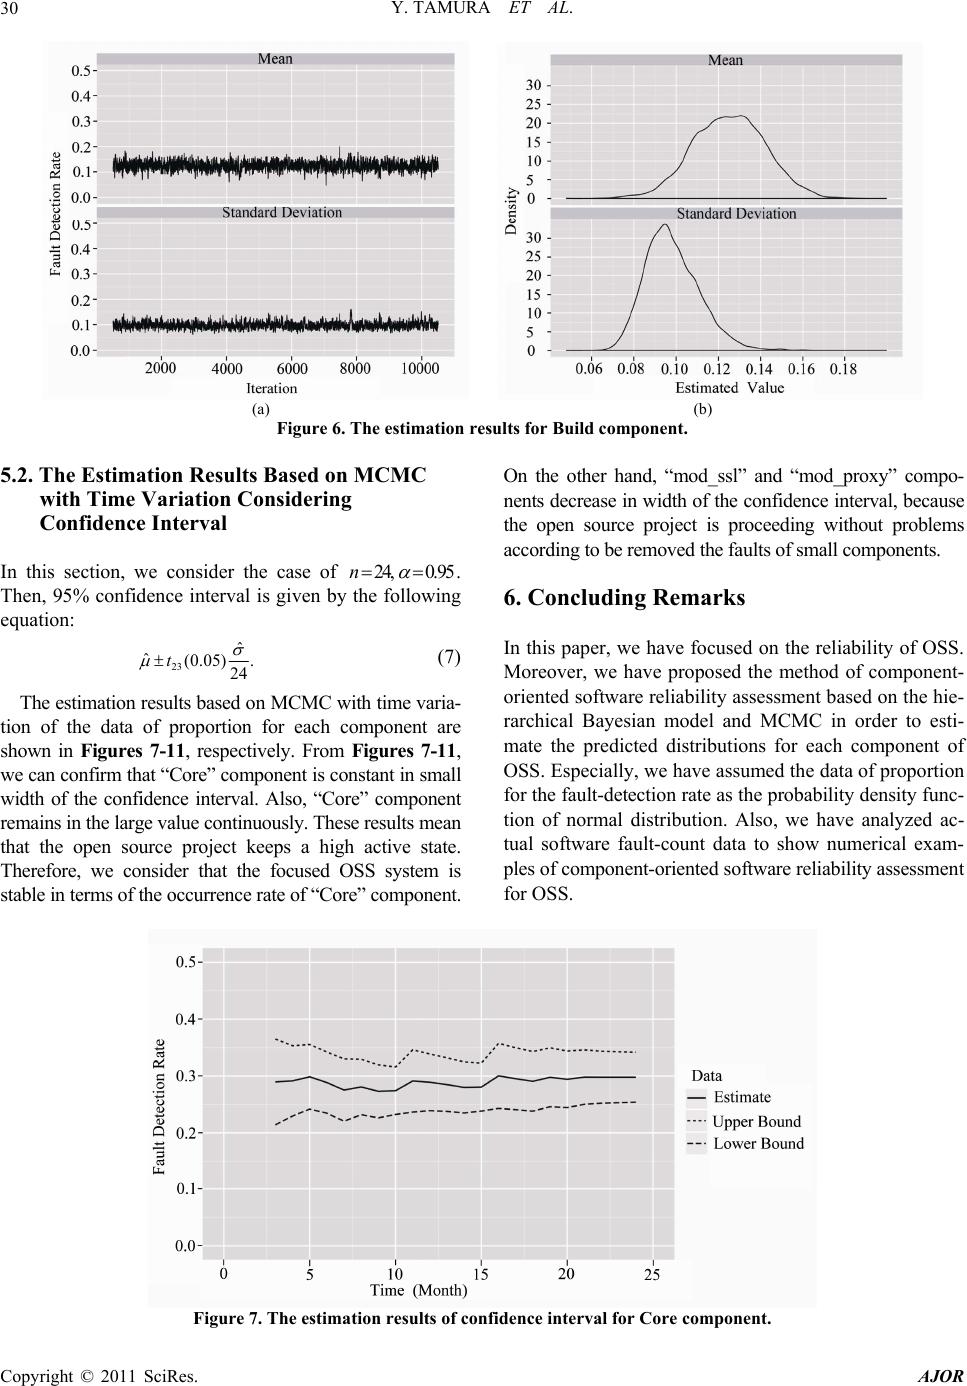 Y. TAMURA ET AL. Copyright © 2011 SciRes. AJOR 30 (a) (b) Figure 6. The estimation results for Build component. 5.2. The Estimation Results Based on MCMC On the other hand, “mod_ssl” and “mod_proxy” compo- nents decrease in width of the confidence interval, because the open source project is proceeding without problems according to be removed the faults of small components. with Time Variation Considering Confidence Interval In this section, we consider the case of 24, 0.95n . Then, 95% confidence interval is given by the following equation: 6. Concluding Remarks In this paper, we have focused on the reliability of OSS. Moreover, we have proposed the method of component- oriented software reliability assessment based on th e hie- rarchical Bayesian model and MCMC in order to esti- mate the predicted distributions for each component of OSS. Especially, we have assumed the data of proportion for the fault-detection rate as t he prob ability d ensity f u n c- tion of normal distribution. Also, we have analyzed ac- tual software fault-count data to show numerical exam- ples of component-oriented software reliability assessment for OSS. 23 ˆ ˆ(0.05) . 24 t (7) The estimation results based on MCMC with time varia- tion of the data of proportion for each component are shown in Figures 7-11, respectively. From Figures 7-11, we can confirm that “Core” component is constant in small width of the confidence interval. Also, “Core” component remains in the large value continuously. These results mean that the open source project keeps a high active state. Therefore, we consider that the focused OSS system is stable in terms of the occurrence rate of “Core” component. Figure 7. The estimation results of confidence interval for Core component. 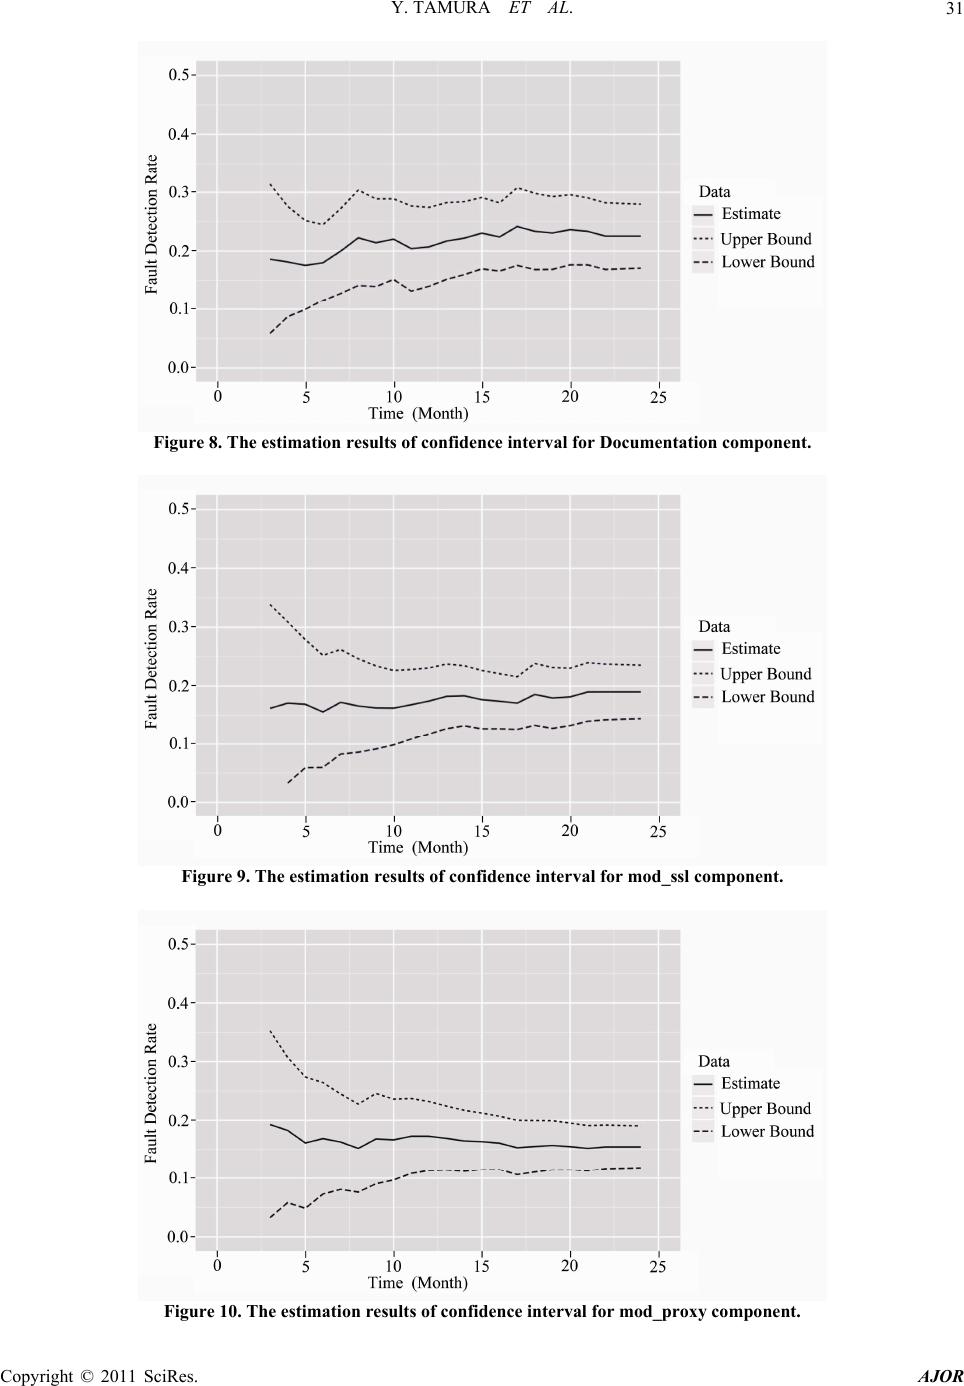 Y. TAMURA ET AL.31 Figure 8. The estimation results of confidence interval for Documentation component. Figure 9. The estimation results of confidence interval for mod_ssl component. Figure 10. The estimation results of confidence interval for mod_proxy component. Copyright © 2011 SciRes. AJOR 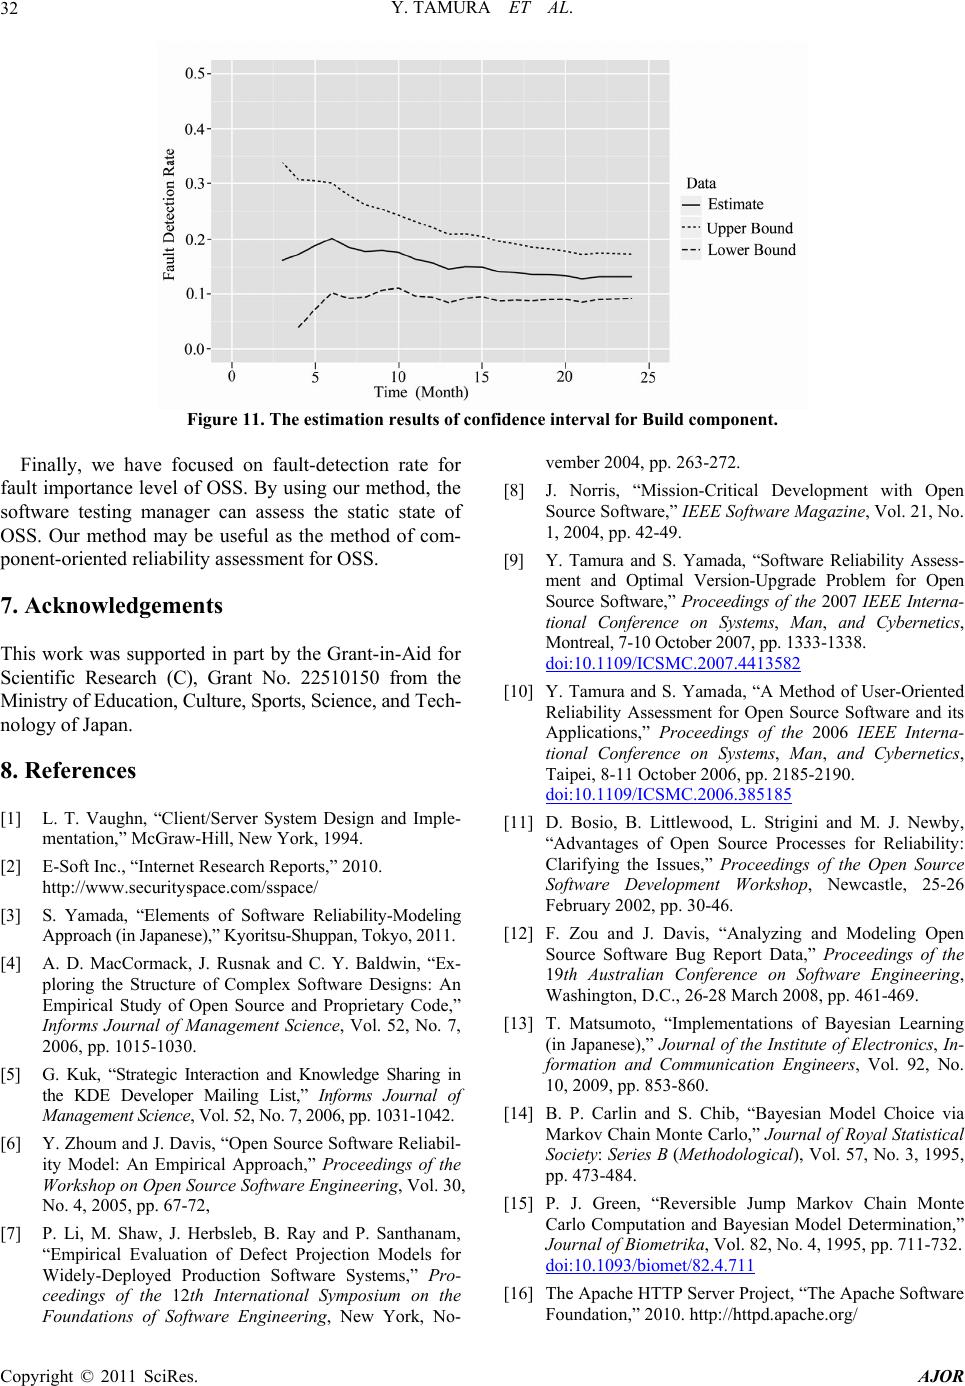 Y. TAMURA ET AL. Copyright © 2011 SciRes. AJOR 32 Figure 11. The estimation results of confidence interval for Build component. Finally, we have focused on fault-detection rate for fault importance level of OSS. By us ing our method, th e software testing manager can assess the static state of OSS. Our method may be useful as the method of com- ponent-oriented reliability assessment for OSS. 7. Acknowledgements This work was supported in part by the Grant-in-Aid for Scientific Research (C), Grant No. 22510150 from the Ministry of Education, Cul t ure, Sport s, Sci e nce, and Tech- nology o f Ja p an. 8. References [1] L. T. Vaughn, “Client/Server System Design and Imple- mentation,” McGraw-Hill, New York, 1994. [2] E-Soft Inc., “Internet Research Reports,” 2010. http://www.securityspace.com/sspace/ [3] S. Yamada, “Elements of Software Reliability-Modeling Approach (in Japanese),” Kyoritsu-Shuppan, Tokyo, 2011. [4] A. D. MacCormack, J. Rusnak and C. Y. Baldwin, “Ex- ploring the Structure of Complex Software Designs: An Empirical Study of Open Source and Proprietary Code,” Informs Journal of Management Science, Vol. 52, No. 7, 2006, pp. 1015-1030. [5] G. Kuk, “Strategic Interaction and Knowledge Sharing in the KDE Developer Mailing List,” Informs Journal of Management Science, Vol. 52, No. 7, 2006, pp. 1031-1042. [6] Y. Zhoum and J. Davis, “Open Source Software Reliabil- ity Model: An Empirical Approach,” Proceedings of the Workshop on Open Source Software Engineering, Vol. 30, No. 4, 2005, pp. 67-72, [7] P. Li, M. Shaw, J. Herbsleb, B. Ray and P. Santhanam, “Empirical Evaluation of Defect Projection Models for Widely-Deployed Production Software Systems,” Pro- ceedings of the 12th International Symposium on the Foundations of Software Engineering, New York, No- vember 2004, pp. 263-272. [8] J. Norris, “Mission-Critical Development with Open Source Software,” IEEE Software Magazine, Vol. 21, No. 1, 2004, pp. 42-49. [9] Y. Tamura and S. Yamada, “Software Reliability Assess- ment and Optimal Version-Upgrade Problem for Open Source Software,” Proceedings of the 2007 IEEE Interna- tional Conference on Systems, Man, and Cybernetics, Montreal, 7-10 October 2007, pp. 1333-1338. doi:10.1109/ICSMC.2007.4413582 [10] Y. Tamura and S. Yamada, “A Method of User-Oriented Reliability Assessment for Open Source Software and its Applications,” Proceedings of the 2006 IEEE Interna- tional Conference on Systems, Man, and Cybernetics, Taipei, 8-11 October 2006, pp. 2185-2190. doi:10.1109/ICSMC.2006.385185 [11] D. Bosio, B. Littlewood, L. Strigini and M. J. Newby, “Advantages of Open Source Processes for Reliability: Clarifying the Issues,” Proceedings of the Open Source Software Development Workshop, Newcastle, 25-26 February 2002, pp. 30-46. [12] F. Zou and J. Davis, “Analyzing and Modeling Open Source Software Bug Report Data,” Proceedings of the 19th Australian Conference on Software Engineering, Washington, D.C., 26-28 March 2008, pp. 461-469. [13] T. Matsumoto, “Implementations of Bayesian Learning (in Japanese),” Journal of the Institute of Electronics, In- formation and Communication Engineers, Vol. 92, No. 10, 2009, pp. 853-860. [14] B. P. Carlin and S. Chib, “Bayesian Model Choice via Markov Chain Monte Carlo,” Journal of Royal Statistical Society: Series B (Methodological), Vol. 57, No. 3, 1995, pp. 473-484. [15] P. J. Green, “Reversible Jump Markov Chain Monte Carlo Computation and Bayesian Model Determination,” Journal of Biometrika, Vol. 82, No. 4, 1995, pp. 711-732. doi:10.1093/biomet/82.4.711 [16] The Apache HTTP Serve r Projec t, “The Apac he Software Foundation,” 2010. http://httpd.apache.org/
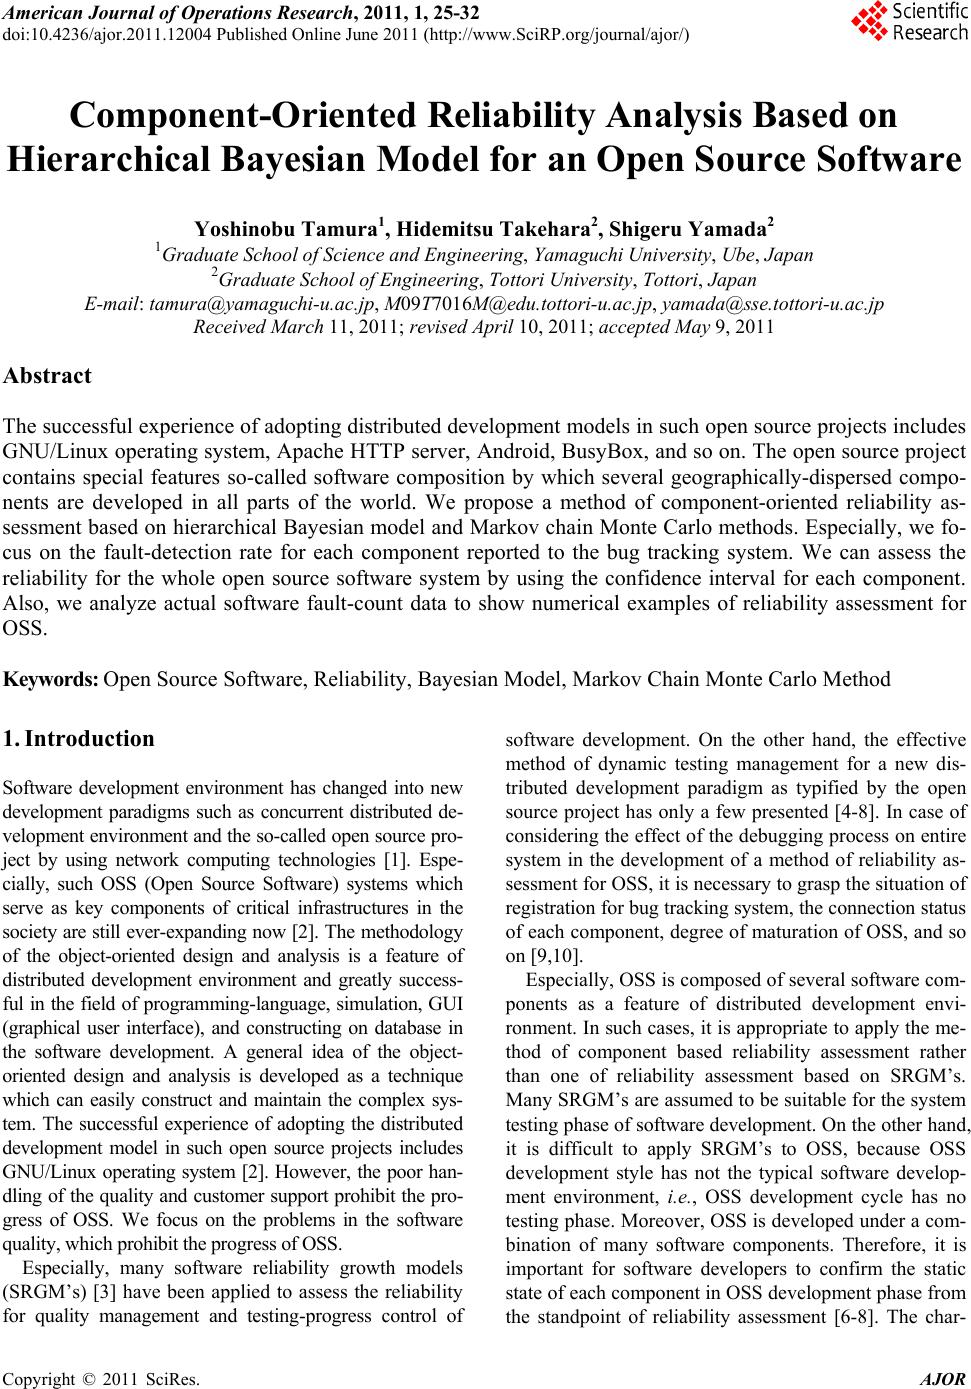
|