 Journal of Geoscience and Environment Protection, 2014, 2, 52-58 Published Online December 2014 in SciRes. http://www.scirp.org/journal/gep http://dx.doi.org/10.4236/gep.2014.25008 How to cite this paper: Huang, J., Wang, S. Z., Deng, S. Z., Yang, X. B., & Zhou, Q. (2014). Numerical Study on the Impact of GongJi Road Rain Pump on the Waterlogging in Huinan, Pudong District. Journal of Geoscience and Environment Protection, 2, 52-58. http://dx.doi.org/10.4236/gep.2014.25008 Numerical Study on the Impact of GongJi Road Rain Pump on the Waterlogging in Huinan, Pudong District Jing Huang, Shanzhu Wang, Shuzhao Deng, Xiaobin Yang, Quan Zhou Shanghai Pudong New Area Hydrology and Water Resources Administration, Shanghai, China Email: hjk1985coo l@12 6.com Received Oc tob er 2014 Abstract To study the rainstorm waterlogging disaster in Huinan, Pudong Dist rict , an urban waterlogging model coupled with the rainfall runoff sub-model, underground network sub-model and the over- land flow sub-model has been set up by MIKE FLOOD. After the validation with the actual reports of the waterlogging in Huinan on Oct. 8th, 2013, the model is adopted to simulate the overland flood before and after Gongji Road Rain Pump works to study the impact of Gongji Road Rain Pump on the waterlogging disaster. The results are analyzed and the conclusions are obtained: when Gongji Road Rain Pump runs, the total flooded area will significantly decrease to .49 km2, about 21%, meanwhile, the drowned duration will be shortened in 6 hours, ahead 10 hours. Therefore, Gongji Road Rain Pump can alleviate the waterlogging, but some other measures are still needed to be taken to solve the waterlogging disaster. Keywords Rainfall Runoff, Rainstorm Waterlogging Disaster, Overland Flood, Pump, Numerical Simulation 1. Introduction Urban areas have much of the impervious land surface with the decreased infiltration and accelerated rainfall runoff. When the rainfall exceeds the capacity of the drainage system, it is easy for the local ground to be wa- terlogged due to all the rainwater is not drained quickly, and then the urban flooding occurs with the low-lying houses got drowned, the local traffic crippled. The urban waterlogging is the disaster that has been attracted many researchers’ attentions, and a few mathe- matical models have been established to simulate the urban flooding. Werner (2001) assessed the flooding ex- tent and its depth with 1-D flow model based on GIS. Mark et al. (2004) simulated the urban flooding by 1-D hydrodynamic modeling incorporating the interaction between the buried pipe system, the streets and the areas flooded with stagnant water. Schmitt et al. (2004) used the dual drainage model to simulate the hydraulic flow routing procedures for the surface flow and pipe flow. Tan (2007) & Yao (2007) set up the storm drainage mod- el with InfoWorks CS to study the urban drainage networks respectively. Liu et al. (20 07), Barco et al. (2008), Zhao et al. (2008), Chen et al. (2009), Liu & Liu (2010) adopted Storm Water Management Model (SWMM) to 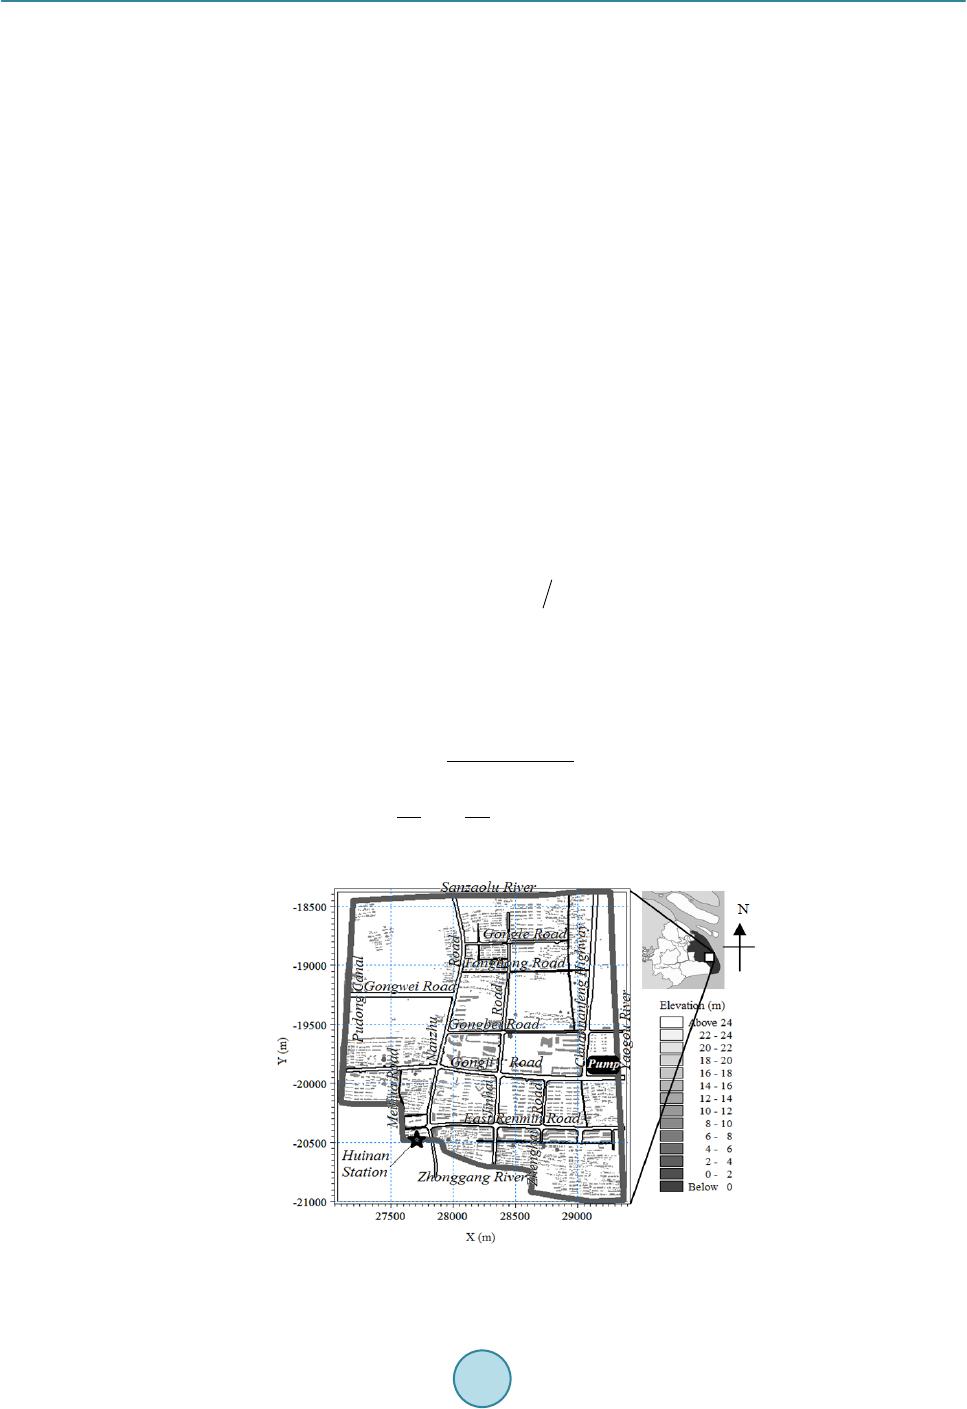 J. Huang et al. simulate the urban rainstorm waterlogging respectively. Chen et al. (2009) built a GIS-based urban flood inun- dation model with a storm-runoff model and an inundation model. Xia et al. (2011) used the numerical model to assess the degree of safety of people and vehicles during flash floods with a 2-D hydrodynamic model capable of simulating flash floods. Zhang et al. (2011) assessed the vulnerability of the eight land use types in Pudong District and made the vulnerability distribution maps under the different maximum rainfalls based on the exist- ing evaluation model of urban rainstorm waterlogging. Huinan, located in the south to central of Pudong District in Shanghai, has a tropical East Asian monsoon, and the oceanic climate with plenty of rains. And Pudong Canal, Zhonggang River, Yaogou River and Sanzaolu River flow around it (see Figure 1), with the normal water level of 2.50 - 2.80 m. At present, Huinan has the drainage system depending on the gravity flow by rainfall itself, and during the heavy rain falls, the waterlog- ging disaster often occurs with many houses, factories and croplands suffered, especially, the region, east to Yaogou River, south to Zhonggang River, west to Pudong Canal, and north to Sanzaolu River (see Figure 1). To solve the urban waterlogging disaster in Huinan, Gongji Road Rain Pump has been planned to construct in the north side of Gongji Road, south to Gongbei Road, west bank of Yaogou River. In this research, the urban waterlogging model coupled with the rainfall runoff sub-model, underground network sub-model and the over- land flow sub-model by MIKE FLOOD is established to simulate the overland flood, and analyzed the model results under the conditions of whether Gongji Road Rain Pump works or not to study the impact of Gongji Road Rain Pump on the rainstorm waterlogging. 2. Model Set Up 2.1. Control Equations The runoff in the rain inlet in Shanghai can be calculated by (Sun et al., 2013) ( ) ( ) 0.82 0.07lg 0.3 55440.4210 7lgP Q qFFPtP ψψ + = =−++ . (1) where Q is the runoff in the rain inlet; q is the designed rainfall intensity; ψ is the coefficient of the rainfall ru- noff; F is the catchment area; P is the designed reoccurrence period; t is the rainfall duration. The surface runoff can be calculated by (Yang et al., 2011) () 3 12 5/3 1/2 0 12 2 1 30 1.49 60 1 mipi i i ss c mm WWWW LH hS qtS qtSqtS n WW St ff WW = =++ − =+− + − −+ ∑ . (2) Figure 1. Diagram of the research region in Huinan, Pudong district.  J. Huang et al. where W is the surface runoff; W1 is the runoff of the impervious zone without the depression storage; W2 is the runoff of the impervious zone with the depression storage; W3 is the runoff of the pervious zone; S1 is the area of the impervious zone without the depression storage; S2 is the area of the impervious zone with the depression storage; S3 is the area of the pervious zone; Li is the hollow length; H is the total rainfall; hpi is the water depth of the hollow; Soi is the slope; n is the roughness; f0 is the initial maximum infiltration rate; fc is the minimum infil- tration rate; Ws is the soil moisture content; Wm is the soil retention. The discharge of the pipe line can be calculated by (Zhang, 2012) 3 2 2 4/ 0 0 p pp wL p Q A tx Q QgA H gnQ v Ag AAR Ah tx x ∂ ∂+= ∂∂ ∂∂∂ + ++= ∂+ ∂∂ (3) where A is the cross-sectional area of the pipe line; Qp is the discharge of the pipe; Hw is the water head; v is the velocity; R is the hydraulic radius; hL is the water head loss. The discharge of the hollow can be calculated by (Xu et al., 2003) , when the hollow has the storage function 0, when the hollow has only the connect function t t t Q h tS Q ∂= ∂ = ∑ ∑ (4) where h is the water head of the hollow; Qt is the discharge of the hollow; St is the water area of the hollow. 2.2. Boundary Conditions The research region is east to Yaogou River, south to Zhonggang River, west to Pudong Canal, and north to Sanzaolu River, about 5 km2 (see Figure 1), with 642 hollows, 22 outlets, and 619 pipes with 23.4 km of the to- tal pipe len gths. And 614 catchments in the study area has been generated with Thiessen Method with one water collection hollow in each catchment to make the rainfall runoff flow into the drainage pipes. In this study, the river open boundaries are setup with the field observed time-series water levels at Huinan Station (see Figure 1). So is the rainfall condition. Considering the subsiding of overland flood, the observed time-series water levels and rainfalls at Huinan Station from 0:00 October 8th to 0:00 October 10th in 2013 have been adopted to set up the open boundary condition and rainfall condition respectively with the time interval of 5 minutes (see Figure 2). It was raining during 3:45 and 21:20 on October 8th in 2013 and the maximum rain fall reached 40.0 mm from 8:10 to 9:10 in that day (see Figure 2). The total rainfall in 24 hours was 127.0 mm (see Figure 2). The simulated region is mainly composed of buildings, roads, green fields and water. And the different im- per vi ous rates have been used, e.g., 90% for buildings, 85% for roads, 25% for green fields, zero for water, 50% for the rest. 2.3. Model Input Parameters The mean surface flow velocity is adopted as .3 m/s, the hydraulic decay coefficient is .9, the initial abstraction is .0006 m, and the coefficient of the rainfall runoff is .6 in the rainfall runoff model. The roughness of the con- crete drainage pipe lines is used .0005 in the drainage hydrodynamic model. The manning coefficient is 32.0, and the water depth of the dry grid is below .002 m while the water depth larger than .003 m is wet in the over- land flood model. And the time step is set to 1 s. 2.4. Model Validation The simulated results are compared with the report of the storm waterlogging happened in Huinan on Oct. 8th in 2013 to validate this model. After the validation, it shows that the modeled distribution range and depth of the waterlogging are agreed with the actual situation (see Table 1), and the time to subside water costs about 16 hours from 11:40 on October 8th to 6:00 on October 9th in 2013 is also satisfied with the actual reports. So it is indicated that this model could be adopted to simulate the storm waterlogging in Huinan. 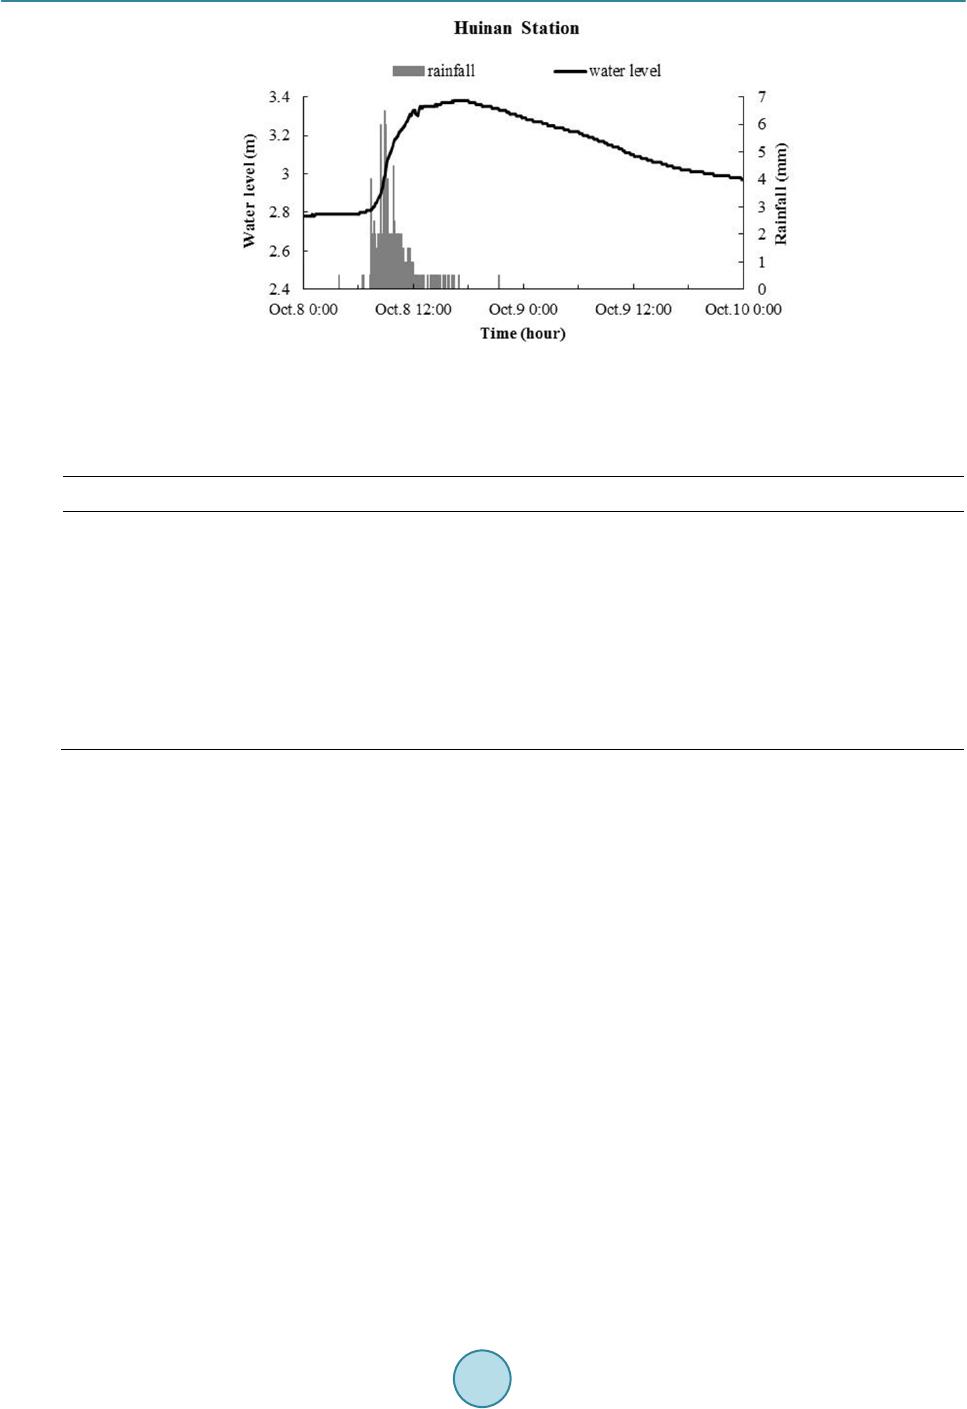 J. Huang et al. Figure 2. Graph of the observed rainfalls and water levels at Huinan Station from 8th, October to 10th, October in 2013. Table 1. Comparisons of the simulated waterlogged depths with the observed situation in Huinan, Pudong District. Locati on Actual Waterlogged Depth Si m ulat ed Waterlogged Depth Gongji Road about .10 m , and the maximum water depth of .25 m East Renmin Road (Nanzhu Road-Jinhai Road) about .15 m , and the maximum water depth of .25 Jinhai Roa d (Gongbei Road-East Renmin Road) about .20 m about .20 m Jinhai Roa d (north of Gongle Road) about .10 m about .10 m Dongchenghuayuan Second Neighborhood about .05 m about .05 m, and the maximum water depth of . 20 Jindicheng Neighborhood about .10 m bout .10 m, and the maximum water depth of .20 m 3. Simulation Results Huinan has been suffered by the urban waterlogging disasters for years. To so l ve the waterlogging, Gongji Road Rain Pump has been planned to be built with four vertical submersible axial-flow pumps for 9.0 m3/s total dis- charges, the top elevation of 5.43 m, the bottom elevation of −1.70 m, a forebay with the cross-sectional area of 53.5 m2 and the surface area of 22.5 m2. When it works, the surroundings about 112.48 hm2 will be served. In this research, the validated rainstorm waterlogging model has been adopted to study the impact of Gongji Road Rain Pump on the urban waterlogging in Huinan, Pudong District on Octorber in 2013 in this research. Before the construction of Gongji Road Rain Pump, the overland flood water depths in the roads are in the range of .10 - .20 m, and the waterlogged depths in the residential areas are below .10 m. However, when Gongji Road Rain Pump works, the range and water depth of the overland flood both reduce significantly, especially the waterlogging in the roads, e.g., the intersections of East Renmin Road and Jinghai Road, Gongji Road and Mei- hua Road, Gongji Road and Jinghai Road, Gongbei Road and Jinghai Road will be hardly ponded, but the wa- terlogged depths in the residential areas with the low terrain and small pipe-diameter will scarcely change (see Figure 3). And the drowned duration will be 6 hours, which is 10 hours ahead than that before the construction of Gongji Road Rain Pump. Figure 4 shows the changes of the total ponded areas whether Gongji Road Rain Pump works or not. Before the construction of Gongji Road Rain Pump, the maximum drowned area is about .62 km2 at 10:00 on Oct. 8th in 2013 (see Figure 3). Correspondingly, when Gongji Road Rain Pump runs, the maximum drowned area will decrease to .49 km2, about 21%, at 9:10 on Oct. 8th in 2013 (see Figure 4). Now, the local drainage system depends on the gravity flow by itself. Under this saturation, it is often easier to generate the surface runoff when the rainfall exceeds the full capacity of the drain lines or the rain arrives 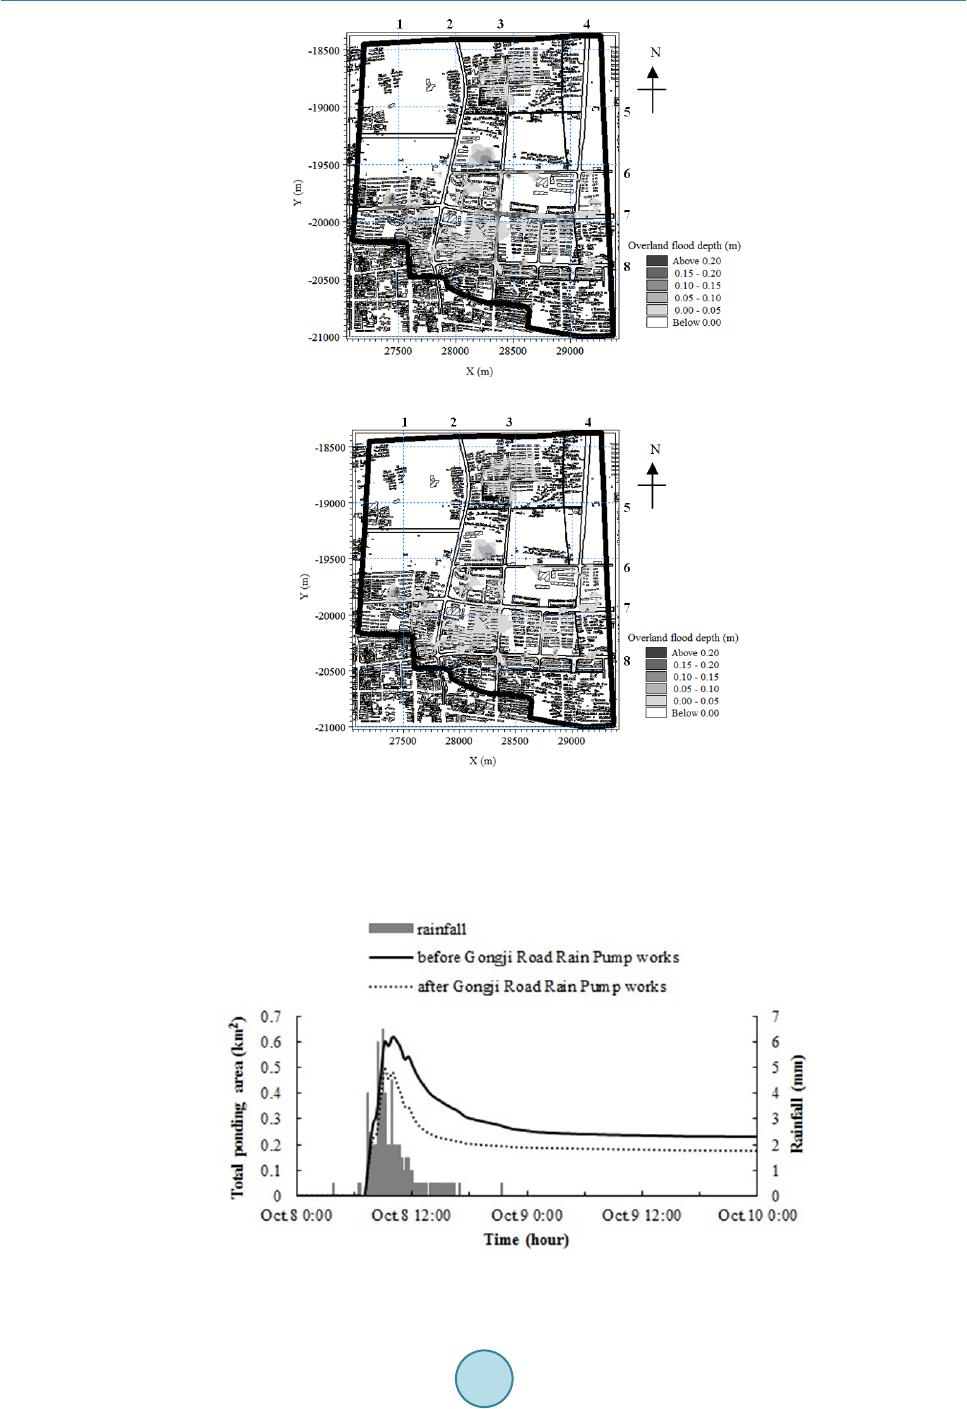 J. Huang et al. (a) (b) Figure 3. Comparisons of the simulated storm water distributions whether Gongji Road Rain Pump works or not (at 9:10 on Oct. 8th, 2013) (Numbers “1” - “8” show Meihua Road, Nanzhu Road, Jinhai Road, Chuannanfeng Road, Tanghong Road, Gongbei Road, Gongji Road and East Renmin Road). (a) before Gongji Road Rain Pump works; (b) after Gongji Road Rain Pump wo r k s . Figure 4. Changes of the total ponded areas whether Gongji Road Rain Pump works or not. 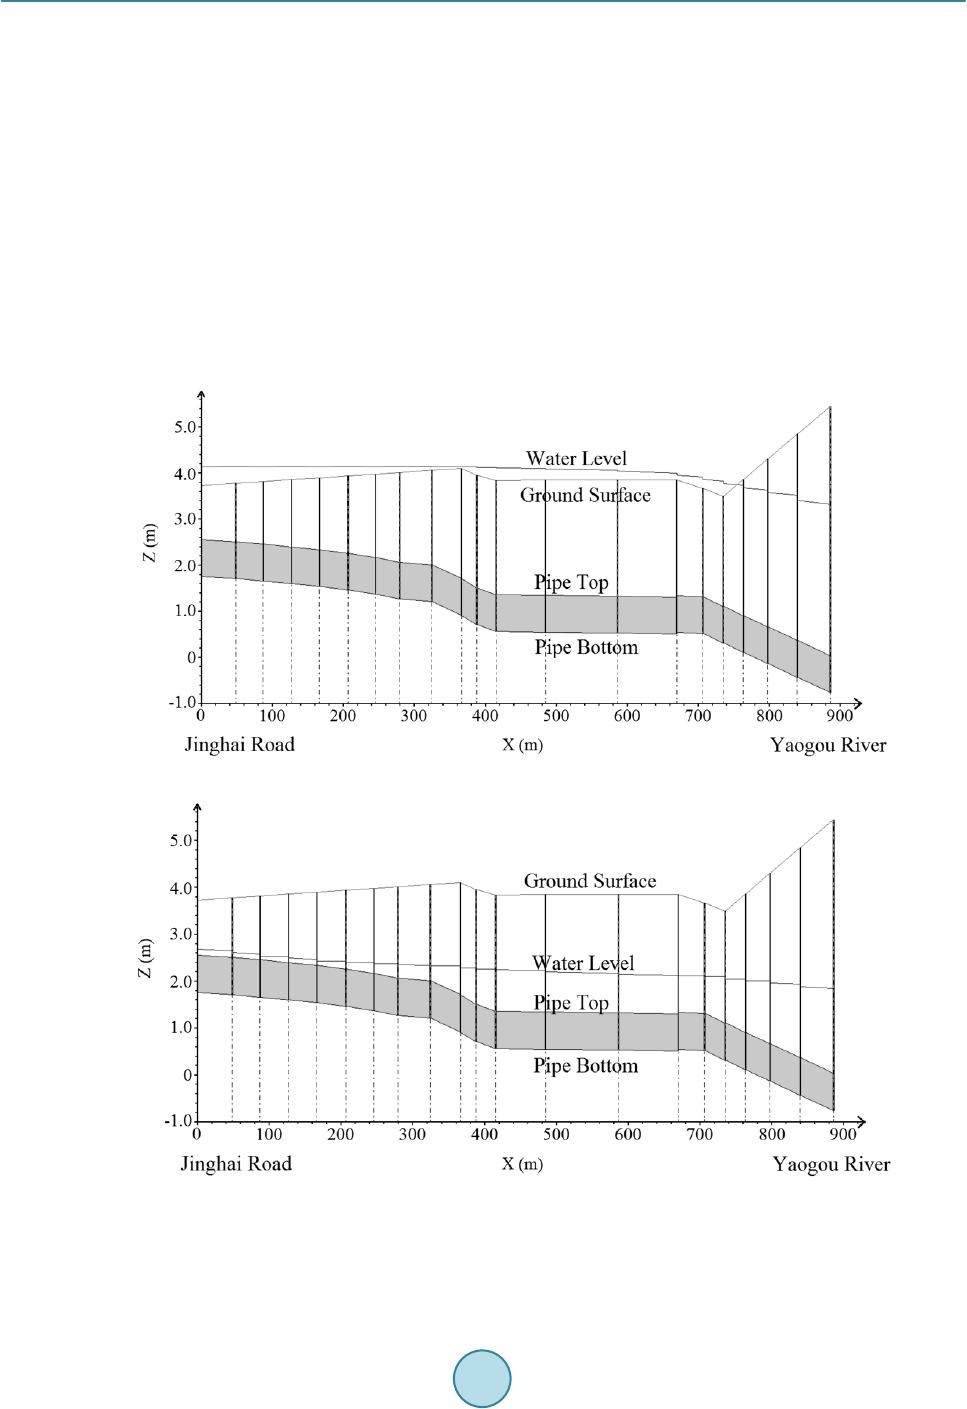 J. Huang et al. more quickly than the local pipe networks can absorb it (see Fig ure 5(a)). But when Gongji Road Rain Pump works, it will be hard for the overland flow (see Fig ure 5(b)). 4. Conclusions The validated urban waterlogging model with coupled the rainfall runoff sub-model, underground network sub- model and the overland flow sub-model by MIKE FLOOD has been established to simulate the rainstorm wa- terlogging in Huinan, Pudong District whether the planned Gongji Road Rain Pump runs or not. When Gongji Road Rain Pump runs, the total flooded area will significantly decrease to .49 km2, about 21 %, meanwhile, the drowned duration will be shortened in 6 hours, ahead 10 hours. Therefore, Gongji Road Rain Pump can alleviate the waterlogging, but some other measures are still needed to be taken to solve the waterlogging disaster. The further work would install the ultrasonic water level gauges in the typical water places for the accurate data to calibrate the model and to forecast the waterlogging combined with the numerical models. And the effect of the water level changes caused by the sluice operations on the waterlogging disaster in Huinan would also be studied. (a) (b) Figure 5. Profiles of the pipes at Gongji Road (section from Nanzhu Road to Jinghai Road) whether Gongji Road Rain Pump works or not (at 9:10 on Oct. 8th, 2013). (a) before Gongji Road Rain Pump works; (b) after Gongji Road Rain Pump wor k s .  J. Huang et al. Acknowledgem ents This work is financially supported by Shanghai Pudong New Area Environmental Protection Bureau Founda- tion. References Barco, J., Wong, K. M., & Stenstorm, M. K. (2008). Automatic Calibration of the U.S. EPA SWMM Model for a Large Urban Catchment. Journal of Hydraulic Engineering, 134, 466 -474. http://dx.doi.org/10.1061/(ASCE)0733-9429(2008)134:4(466) Chen, J., Hill, A. A., & Urbano, D. L. (2009). A GIS-Based Model for Urban Flood Inundation. Journal of Hydrology, 373, 184-192. http://dx.doi.org/10.1016/j.jhydrol.2009.04.021 Chen, X., Deng, H. P., & Ma, X. X. (2009). Study on Relationship of Urban Drainage System and Recurrence Period with SWMM. China Water and Wastewater, 35, 114-117. (In Chinese) Liu, X. P., Liu, S. Q., Li, S. P., Hu, J., & Yu, Y. P. (2007). Computer Modeling Method for Drainage Networks in Central Zone of Zhenjiang City. China Water and Wastewater, 23, 42-46. (In Chinese) Liu, X. Q., & Liu, W. (2010). Analysis and Dynamic Simulation of Urban Rainstorm Waterlogging. Geospatial Information, 4, 10-12. (in Chinese) Mark, O., Weesakul, S., Apirumanekul, C., Aroonnet, S. B., & Djordjevic, S. (2004 ). Potential and Limitations of 1D Mod- eling of Urban Flooding. Journal of Hydrology, 35, 159 -172. Schmitt, T. G., Thomas, M., & Ettrich, N. (2004). Analysis and Modeling of Flooding in Urban Drainage Systems. Journal of Hydrology, 299 , 300 -311. http://dx.doi.org/10.1016/S1464-1909(0 1)0 0043 -0 Sun, H. X., Hao, Y. Q., & Long, T. R. (2013). Appendix 3-2: Urban Storm Intensity Formula of Some Cities in China. In Drainage Engineering (Volume One) (p. 185). Beijing: China Architecture and Building Press. (In Chinese) Tan, Q. (2007). Application of Drainage Model for Urban Storm Water Quantity Management. Ph.D. Thesis, Shanghai: Tongji University. (In Chines e) Werner, M. G. F. (2001). Impact of Grid Size in GIS Based Flood Extent Mapping Using a 1D Flow Model. Physics and Chemistry of the Earth, Part B, Hydrology, Oceans and Atmosphere, 26, 517-522. http://dx.doi.org/10.1016/S1464-1909(01)00043-0 Xia, J. Q., Falconere, R. A., Lin, B. L., & Tan, G. M. (2011). Numerical Assessment of Flood Hazard Risk to People and Vehicles in Flash Floods. Environmental Modeling & Software, 1-12. Xu, X. Y., Liu , J., Hao, Q. Q., & Ding, G. C. (2003 ). Simulation of Urban Storm Water Logging. Advances in Water Science, 14, 193-196. (In Chinese) Yang, J., Huang, L. Q., Li, L. J, Ye, Y. Q., & Huang, G. Q. (2011). Impact of Urban Rainstorm Process on Design Parame- ters of Concave Herbaceous Field. Journal of China Hydrology, 31, 58-61. (In Chinese) Yao, Y. (2007). Study on the Application of Urban Drainage Networks Modeling Based on GeoDatebase. MS. Thesis, Shanghai: Tongji University. (In Chi nese) Zhang, H., Yin, Z. E., Yin, J., Hu, J., & Yu, Y. P. (2011). Vulnerability Assessment of Urban Rainstorm Water-Logging in Pudong of Shanghai in Terms of Land Use. Journal of Shanghai Normal University (Natural Sciences), 40, 4 27-434. (In Chin ese) Zhang, J. (2012 ). Research of Rainstorm Water Logging of Zhengzhou City Based on GIS and SWMM. MS. Thesis, Zheng- zhou: Zhengzhou University. (In Chinese) Zhao, D. Q., Chen, J. N., Tong, Q. Y., Wang, H. Z., Cao, S. B., & Sheng, Z. (2008). Construction of SWMM Urban Drainage Network Model Based on GIS. China Water and Wastewater, 27, 88-91. (In Chinese)
|