 Journal of Service Science and Management, 2011, 4, 227-233 doi:10.4236/jssm.2011.42027 Published Online June 2011 (http://www.SciRP.org/journal/jssm) Copyright © 2011 SciRes. JSSM 227 A Slacks-Based Measure of Efficiency of Electric Arc Furnace Activity with Undesirable Outputs Hao Zhang, Xiang Su, Shilun Ge Economics & Management School, Jiangsu University of Science and Technology, Zhenjiang, China. Email:haozh168@yahoo.com.cn Received April 26th, 2010; revised May 23rd, 2011; accepted May 27th, 2011. ABSTRACT Efficiency reflects a scenario of higher quality product with fewer resource inputs and less pollution discharge. In terms of a manufacturing firm, it means a win-win strategy in both economic and environmental categories. The paper ex- tends the Electric Arc Furnace (EAF) activity management by taking pollution discharge as undesirable outputs. After reviewing relative undesirable outputs DEA literatures and comparing their advantages and shortcomings, the current paper introduces SBM models to treat undesirable outputs and then measures the efficiency of each EAF activity. Based on resources input and activity quantity output and undesirable outputs, the DEA model can evaluate the efficiency of EAF activity. By the input-output combination, the sensitivity analysis is done. At last, the paper demonstrates the ap- plication of efficiency measurement in EAF activity of an iron & steel enterprise. The result implies objectivity, accu- racy and practicability of the activity analysis and valuation method based on SBM-Undesirable model. Keywords: Electric Arc Furnace, Slacks-based Measure, Activity Management, Undesirable Outputs 1. Introduction Nearly 50% of the steel production these days is by Elec- tric Arc Furnace (EAF) route, which uses high-current electric arcs to melt steel scrap and convert it into liquid steel of a specified chemical composition and tempera- ture. The major charge material of electric-arc steelmak- ing is scrap steel, and its availability at low cost and proper quality is essential. Moreover, the electric power used in EAF operation, however, is high, at 360 to 600 kilowatt-hours per ton of steel, and the installed power system is substantial. Activity-based costing (ABC) determines cost drivers as activity measures to allocate overhead costs more ac- curately than traditional cost systems. In contrast, activ- ity-based management is not only concerned with allo- cating overhead costs more precisely but tries also to identify and improve inefficient activities. In this sense activity-based management is the more comprehensive concept. In identifying inefficient activities it is often necessary to have reference activities for comparison. These activities may correspond to other decision making units (DMUs) such as other companies or divisions. Also, one might want to compare different observations over time corresponding to a single organizational unit. We investigate the use of data envelopment analysis (DEA) to benchmark activities. DEA provides each DMU with an efficiency score that has to be viewed as its relative efficiency in the set of all DMUs involved in the bench- marking. We identify the pros and cons of DEA as being applied to benchmark activities. In the production theory approach, pollutants (also called undesirable outputs) and desirable outputs are as- sumed to be generated in the same production process. So the paper extends the activity management by taking pollution discharge as an undesi rabl e output. The objective of this work is to provide a quantitative model for EAF activity-based management (ABM) with undesirable outputs. The model developed is based on data envelopment analysis, an established operational research technique for productivity and efficiency deter- minations. Activity centers are considered as decision- making units whose efficiencies are determined by solu- tion of the ABM/DEA model. ABM follows from activ- ity-based costing whereby ABC information is employed in improvement and cost reduction plan. A real case study of an iron and steel factory is used to illustrate the application of the model. 2. Literature Data envelopment analysis (DEA), developed by Char-  A Slacks-Based Measure of Efficiency of Electric Arc Furnace Activity with Undesirable Outputs Copyright © 2011 SciRes. JSSM 228 nes, Cooper, & Rhodes (1978), is a well-established non- parametric approach used to evaluate the relative effi- ciency of a set of comparable entities called decision making units (DMUs) with multiple inputs and outputs [1]. Numerous DEA theoretical and application studies have been reported [2,3]. Efficiency is relatively meas- ured meaning that efficiency of DMUs is subject to analysis according to each other is measured. Following the analysis, the DMU are grouped into two sets as effi- cient and inefficient. The envelop line formed by the efficient DMUs is named as efficient frontier, and it cov- ers the inefficient DMUs as what an envelopment does. Thus, this property gives the name of analysis. The effi- ciency performance of the activity management has been a critical research stream that draws considerable atten- tion [4-7]. Most studies about the application of DEA- based models to activity management performance measurement assume that the reduction of undesirable outputs (or inputs) and the increase of desirable outputs are proportional. This implies that the slacks in inputs and outputs are not accounted for when activity man- agement performance is evaluated. Although the result- ing efficiency measures have some good theoretical properties, the assumption often leads to a lot of compa- rable entities having the same efficiency scores of 1 and hence difficult in making useful comparisons. Therefore, it is meaningful to incorporate the input excesses and output shortfalls into DEA-based models in measuring activity management performance. Moreover, most studies utilized the DEA approach as a tool for evaluating accomplishments in the past. Although the evaluation results highlight the status of the operational performance and are helpful for planning future activities for improving the performance, the ex post facto evalua- tion might be a little late for an unsuccessful unit to find its weaknesses and make the appropriate amendments. There is one difficulty in doing an objective evaluation of the performance of DMUs. The difficulty is how to treat undesirable outputs jointly produced with desirable outputs. Traditional literature only values the desirable and simply ignores the undesirable. However, ignorance of the undesirable is equal to saying that they have no value in the final evaluation and may present misleading results. It is therefore necessary to credit DMUs for their provision of desirables and penalize them for their provi- sion of undesirables. In the presence of undesirable out- puts, however, technologies with more good (desirable) outputs and less bad (undesirable) outputs relative to less input resources should be recognized as efficient. In the DEA literature, several authors have proposed methods for this purpose [8-10]. In this research, we employ Slack Based Measurement (SBM) for the involved DEA models [11]. In contrast to the radial models, CCR and BCC which are based on the proportional reduction (enlargement) of input (output) vectors and which do not take account of slacks, the SBM deals directly with input excess and outp ut shortfall. SBM is non-radial and deals with input/output slacks directly. The SBM returns an efficiency measure be- tween 0 and 1 and gives unity if and only if the DMU concerned is on th e frontiers of the production possibility set with no input/ou tput slacks. In that resp ect, SBM dif- fers from traditional radial measures of efficiency that do not take account of the existence of slacks [12]. The main purpose of this paper is to propose one slacks-based efficiency measures for modeling EAF ac- tivity management performance. In this research, we evaluate the performance of the EAF activity management based on the input-output data via slacks-based DEA model. The results can be used for planning management activities in advance to enhance the activities operational efficiency and increase a high discriminating power for measuring activity management performance. The rest of this paper is organized as fol- lows: Section 2, we introduce the method of slacks-b ased efficiency measures in DEA by taking pollution dis- charge as an undesirable output, then in Section 3 we discuss the input and output factors used to measure the EAF activity efficiency. Sections 4 and 5 we utilize the case of EAF, and finally, the results are discussed and some conclusions drawn from the discussion. 3. Proposed SBM DEA Model The SBM DEA model projects each unit onto the effi- cient frontier and has many attractive features, among them, units-invariance. The original SBM DEA model computes the ratio of the average inputs reduction to the average output increase. Minimizing that ratio implies the simultaneous pursuit of improvements in both inputs and outputs. It is, therefore, a non-oriented model. It is also non-radial, i.e., it does not force the input and out- puts to be improved uniformly or equal-proportionally, letting the maximum possible improvement in each di- mension be computed by the model. In addition, the SBM efficiency score leaves no input or output slack unaccounted, i.e. all possible improvements are ex- hausted and properly taken into account in the objective function. In total, all the above explorations have effectively broadened our understanding of efficiency evaluation of DMUs. Based on the above, the model of this paper is constructed. Suppose that there are n DMUs(decision making units) each having three factors: inputs, good outputs and bad(undesirable)outputs, as represented by three vec- tors , m R 1 s R and 2bs R, respectively. We  A Slacks-Based Measure of Efficiency of Electric Arc Furnace Activity with Undesirable Outputs Copyright © 2011 SciRes. JSSM 229 define the matrices 、 Y and b Yas follows: 1,, mn n xxR ,1 1,, ggsn n YyyR , 2 1,, bbb sn n YyyR , We assume0,X 0 g Y and 0 b Y. The production possibility set (P) is defined by: ,, |,,,0 gbggbb PxyyxXyYyY Definition 1(Efficient DMU): A DMU0 ,, b oo o yy is efficient in the presence of undesirable outputs if there is no vector ,, gb yy P such that , g oo xy y and bb o y with at least one strict inequality. In accordance with this definition, we modify the SBM in Tone (2001) as follows. [SBM] 0 12 11 * 11 12 00 1 min 1 1 i i ms mx i gb ss rr gb rr rr s ss yy s.t. 0 0 gg Xs yY s 0 0,0,0, 0 bb b gb yY s sss The objective function strictly decreases with respect to ,g ir is r and b r r and the objective value satisfies * 01 .Let an optimal solution of the above program be ** ** ,,, gb ss . Then, we have: Theorem 1 The DMU0 is efficient in the presence of undesirable outputs if and only if ** 1,. .,0,ie s *0 g s and *0 b s. If the DMU0 is inefficient, i.e.,*1 , it can be im- proved and become efficient by deleting the excesses in inputs and bad outputs, and augmenting the shortfalls in good outputs via th e following SBM-projection: *** ,, ggb bb ooooo o xsyy syys . Using the transformation by Charnes and Cooper (1962), we arrive at an equivalent linear program in ,, , tSS and b S as displayed below. LP * 1 1 min m i iio S tmx Subject to 12 11 12 1 1gb ss rr gb rr ro ro o gg g o SS tss yy xt XS yt YS 0 0, 0, 0,0, 0. bb b g b yt YS SS St Let an optimal solution of [LP] be **** * ,, ,, gb tSSS . Then we have an optimal solution of [SBM] as defined by *** ** ,t ,*** , St *** , gg St***bb St. The existence of **** * ,, ,, gb tSSS with *0t is guaranteed by [LP]. 4. Analytic Procedure and Selection of Input and Output Items 4.1. Analytic Procedure The analytic procedure for SBM-DEA mainly includes three parts: first, the assessment objects should be de- fined and selected. Second, relevant and appropriate in- put, desirable and undesirable output items are deter- mined, in order to facilitate the relative efficiency evaluation for evaluation object. Third, based on the ap- plication of DEA model, the experimental results will be evaluated. Therefore this paper will take the above ana- lytic procedure as the basis for DEA analysis. 4.2. The Selection of Input and Output Items Without loss of generality, this paper will take electric arc furnace (EAF) smelting activity efficiency analysis of iron and steel enterprise as example. Solid substances used in the electric arc furnace (scrap, ferrous alloys, ir on slurry) are melted predominantly by electrical energy which is inputted via the electrodes, as well as by fossil energies in the presence of oxygen. Electric arc furnaces have currently capacity of up 200 tones; the duration of heat is in the region of 1 to 4 hours. Owing to their high energy input, modern electric furnaces produces consid- erable quantities of smoke and waste gas. EAF activity efficiency is influenced by raw materials, management, technology, operations, equipment status and other factors. So according to the applicability, simplicity and com- parability of selection index, the input and output indexes are determined. The input data should more objectively reflect the ac- tual situation of EAF operations. The most basic inputs of EAF activity are iron and steel material consumption, power consumption and energy consumption; and out- puts include desirable outputs and undesirable outputs. The desirable outputs include passing rate of molten steel, and the undesirable outputs include wastewater emis-  A Slacks-Based Measure of Efficiency of Electric Arc Furnace Activity with Undesirable Outputs Copyright © 2011 SciRes. JSSM 230 sions and dust emissions. Index calculation methods are as follows: Ferrous charges consumption: iMw Msi es In formula: Msi - ferrous charges consumption, kg/t; Mi - Pig iron consumption, kg; Mw - Scrap steel con- sumption, kg; Mes - qualified steel yield, t. Process energy consumption: Es Ep Eo Eu Mes In formula: Eu - process unit standard coal consump- tion, kgce/t; Es - fuel consumption, kgce; Ep - power consumption, kgce; Eo - Surplus energy recovery, kgce; Mes - qualified steel yield, t. General power consumption: Ecp Ec es Ecp - power consumption, kwh; Mes - qualified steel yield, t. Liquid steel qualified rate: Md Se In formula: Se - liquid steel qualified rate, %; M - raw material weight, t; Md -metal loss, t. Contaminations: Csl Cl s In formula: Cl - unit discharge amount of the main pollutant, kg/t; Csl - discharge amount of the main pol- lutant, kg; Ms - liquid steel annual yield, t. In summary, the input and output items of electric arc furnace activity are shown in Table 1. 5. Case Study 5.1. Data Collection In this paper, we analyze 15 furnace (capacity of 20 - 40 t) Table 1. The input and output items of electric arc furnace activity. Items Unit Steel scrap consumption kg/t Power consumption kWh/t Inputs Process energy consumption kgce/t Output Passing rate of molten steel % Wastewater emissions m3/t Undesirable Outputs Dust emissions kg/t in the September, 2009 in an iron & steel enterprise. The original input and output data was obtained from the pro- duction system. The main data information is shown in Table 2. 5.2. Results and Discussion According to the above model, we use the linear pro- gramming software (lingo 9.0) to calculate platform, the result is shown in Table 3. According to the SBM-DEA model (Table 3): In in- spected objects, only 4 DMU (DMU5, DMU6, DMU8, DMU13 account for 26%) are integrated effective, the synthetic validity (θ) is 0.729, it means the operation performance of the EAF activity system has already achieved certain level. Six DMUs (DMU1, DMU5, DMU6, DMU8, DMU10, DMU13 account for 40%) is technically effective and the synthetic validity (φ) is 0.776. That is to say, the technical validity is relatively high. From tab 3, 2 DMUs (DMU1, DMU10 account for 13%) are only technical validity, not integrated effective. It means these EAFs have already played its best tech- nical level. But due to lack of organization o f production and the impact of the order, these DMUS have failed to increase production scale. Other 9 DMUs have put too much resource and pro- duced much pollutants, resulting in relatively non- effective. Therefore raw materials, energy, and various cost control must be considered in the future. By using reasonable charge structure, increasing alloying elements recovery, and reducing refining time and pollutants emissions, better efficiency can be gotten to enhance the EAF activity operational performance. We applied the SBM-DEA model, with variable re- turns to scale, to evaluate the technical efficiency of each EAF activity. Also, the scale efficiency can be derived by the ratio of overall efficiency to technical efficiency. Ta- ble 3 summarizes the results. The four overall efficient EAFs have the technical efficiency and the scale effi- ciency. In particular, (DMU1, DMU10) has the technical efficiency scores equal to 1 while their scale efficiency scores are less than 1. It should adjust their scales of op- eration to improve their scale efficiencies as well as overall efficiencies. A DMU may be scale inefficient if it exceeds the most productive scale size (thus experiencing decreasing returns to scale), or if it is smaller than the most productive scale size (thus having not taken the full advantage of increasing returns to scale). Indeed, most of the inefficient EAFs present increasing returns to scale that can increase the scales to effectively improve their efficiencies. In particular, seven of the scale inefficient EAFs (i.e., DMU 2, 3, 4 7, 9, 11, 12, 14 and 15) had their scale efficiency scores higher than the technical effi- ciency scores, respectively. This implies that the overall 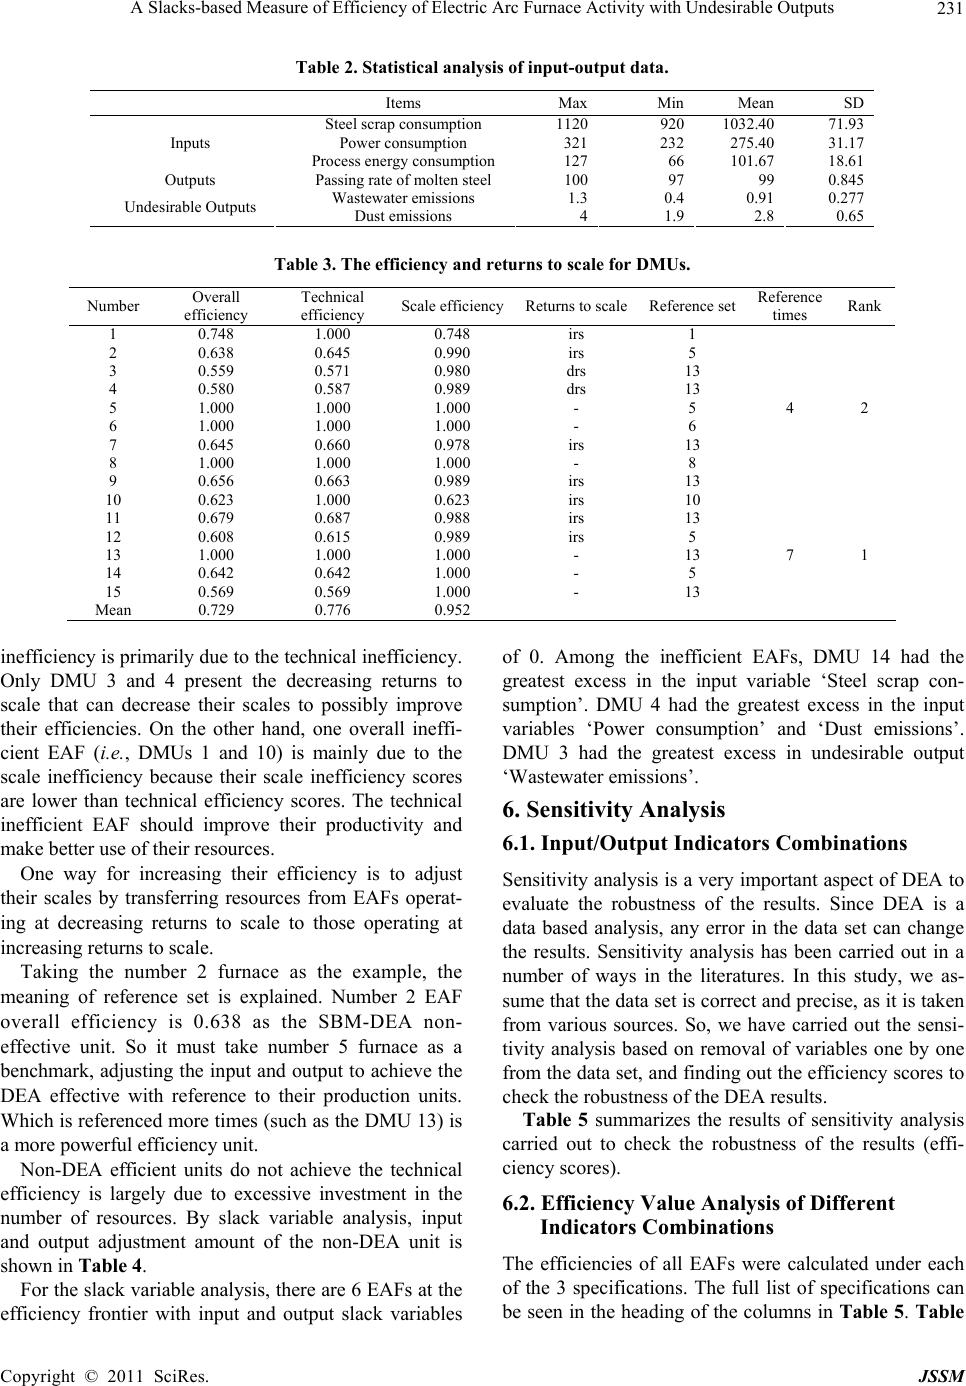 A Slacks-based Measure of Efficiency of Electric Arc Furnace Activity with Undesirable Outputs Copyright © 2011 SciRes. JSSM 231 Table 2. Statistical analysis of input-output data. Items MaxMinMean SD Steel scrap consumption 11209201032.40 71.93 Power consumption 321232275.40 31.17 Inputs Process energy consumption 12766101.67 18.61 Outputs Passing rate of molten steel 1009799 0.845 Wastewater emissions 1.30.40.91 0.277 Undesirable Outputs Dust emissions 41.92.8 0.65 Table 3. The efficiency and returns to scale for DMUs. Number Overall efficiency Technical efficiency Scale efficiencyReturns to scaleReference set Reference times Rank 1 0.748 1.000 0.748 irs 1 2 0.638 0.645 0.990 irs 5 3 0.559 0.571 0.980 drs 13 4 0.580 0.587 0.989 drs 13 5 1.000 1.000 1.000 - 5 4 2 6 1.000 1.000 1.000 - 6 7 0.645 0.660 0.978 irs 13 8 1.000 1.000 1.000 - 8 9 0.656 0.663 0.989 irs 13 10 0.623 1.000 0.623 irs 10 11 0.679 0.687 0.988 irs 13 12 0.608 0.615 0.989 irs 5 13 1.000 1.000 1.000 - 13 7 1 14 0.642 0.642 1.000 - 5 15 0.569 0.569 1.000 - 13 Mean 0.729 0.776 0.952 inefficiency is primarily due to the technical inefficiency. Only DMU 3 and 4 present the decreasing returns to scale that can decrease their scales to possibly improve their efficiencies. On the other hand, one overall ineffi- cient EAF (i.e., DMUs 1 and 10) is mainly due to the scale inefficiency because their scale inefficiency scores are lower than technical efficiency scores. The technical inefficient EAF should improve their productivity and make better use of their resources. One way for increasing their efficiency is to adjust their scales by transferring resources from EAFs operat- ing at decreasing returns to scale to those operating at increasing returns to scale. Taking the number 2 furnace as the example, the meaning of reference set is explained. Number 2 EAF overall efficiency is 0.638 as the SBM-DEA non- effective unit. So it must take number 5 furnace as a benchmark, adjusting the input and output to achieve the DEA effective with reference to their production units. Which is referenced more times (such as the DMU 13) is a more powerful efficiency unit. Non-DEA efficient units do not achieve the technical efficiency is largely due to excessive investment in the number of resources. By slack variable analysis, input and output adjustment amount of the non-DEA unit is shown in Table 4. For the slack variable analysis, there are 6 EAFs at the efficiency frontier with input and output slack variables of 0. Among the inefficient EAFs, DMU 14 had the greatest excess in the input variable ‘Steel scrap con- sumption’. DMU 4 had the greatest excess in the input variables ‘Power consumption’ and ‘Dust emissions’. DMU 3 had the greatest excess in undesirable output ‘Wastewater emissions’. 6. Sensitivity Analysis 6.1. Input/Output Indicators Combinations Sensitivity analysis is a very important aspect of DEA to evaluate the robustness of the results. Since DEA is a data based analysis, any error in the data set can change the results. Sensitivity analysis has been carried out in a number of ways in the literatures. In this study, we as- sume that the data set is correct and precise, as it is taken from various sources. So, we have carried out the sensi- tivity analysis based on removal of variables one by one from the data set, and finding out the efficiency scores to check the robustness of the DEA results. Table 5 summarizes the results of sensitivity analysis carried out to check the robustness of the results (effi- ciency scores). 6.2. Efficiency Value Analysis of Different Indicators Combinations The efficiencies of all EAFs were calculated under each of the 3 specifications. The full list of specifications can be seen in the heading of the columns in Table 5. Table 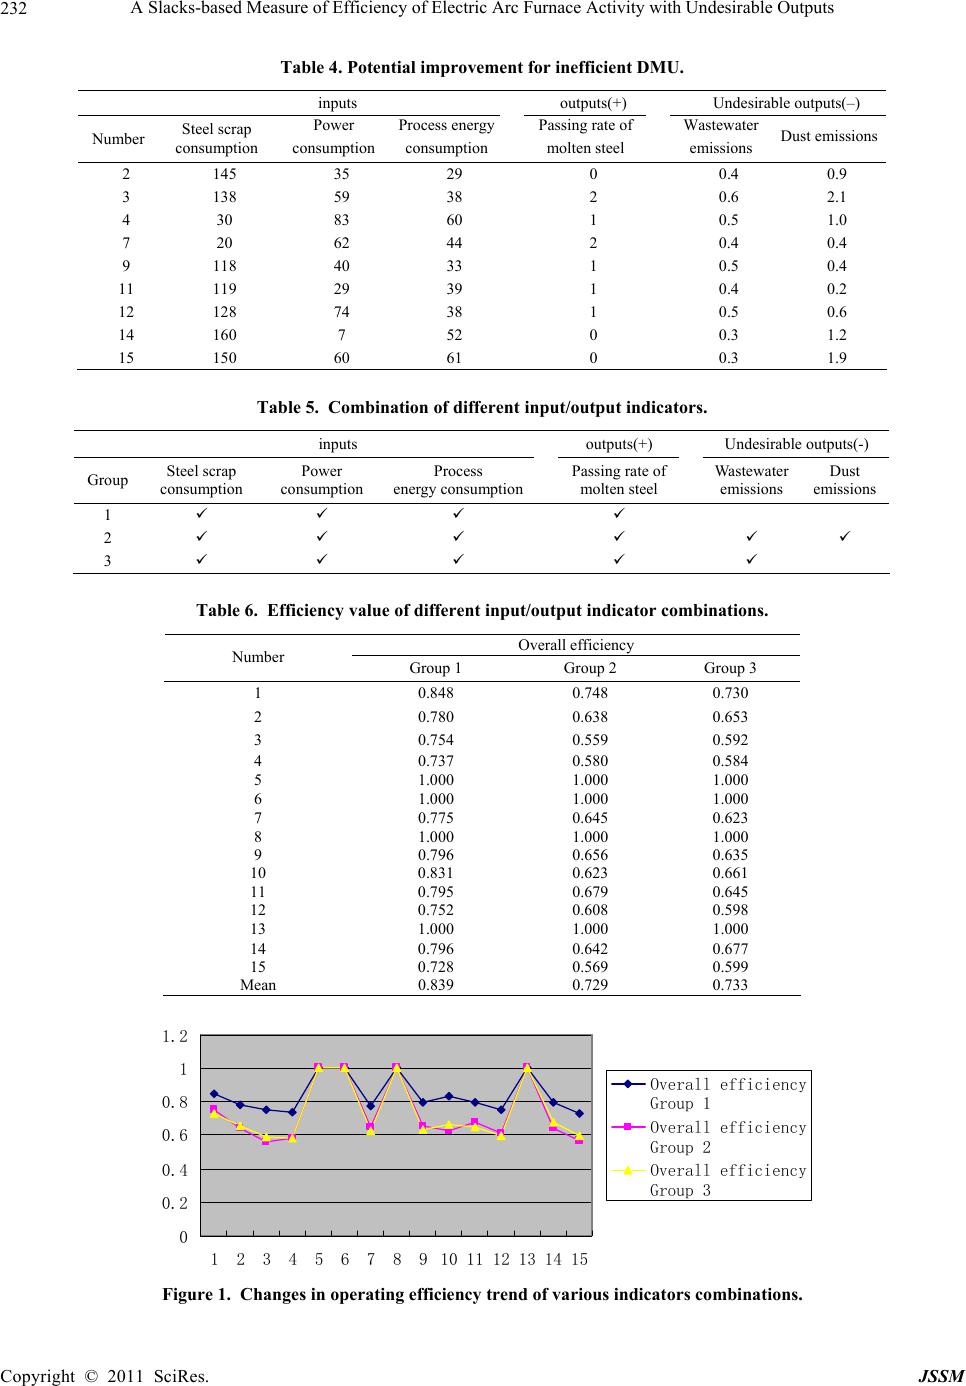 A Slacks-based Measure of Efficiency of Electric Arc Furnace Activity with Undesirable Outputs Copyright © 2011 SciRes. JSSM 232 Table 4. Potential improvement for inefficient DMU. inputs outputs(+) Undesirable outputs(–) Number Steel scrap consumption Power consumption Process energy consumption Passing rate of molten steel Wastewater emissions Dust emissions 2 145 35 29 0 0.4 0.9 3 138 59 38 2 0.6 2.1 4 30 83 60 1 0.5 1.0 7 20 62 44 2 0.4 0.4 9 118 40 33 1 0.5 0.4 11 119 29 39 1 0.4 0.2 12 128 74 38 1 0.5 0.6 14 160 7 52 0 0.3 1.2 15 150 60 61 0 0.3 1.9 Table 5. Combination of different input/output indicators. inputs outputs(+) Undesirable outputs(-) Group Steel scrap consumption Power consumption Process energy consumptionPassing rate of molten steel Wastewater emissions Dust emissions 1 2 3 Table 6. Efficiency value of different input/output indicator combinations. Overall efficiency Number Group 1 Group 2 Group 3 1 0.848 0.748 0.730 2 0.780 0.638 0.653 3 0.754 0.559 0.592 4 0.737 0.580 0.584 5 1.000 1.000 1.000 6 1.000 1.000 1.000 7 0.775 0.645 0.623 8 1.000 1.000 1.000 9 0.796 0.656 0.635 10 0.831 0.623 0.661 11 0.795 0.679 0.645 12 0.752 0.608 0.598 13 1.000 1.000 1.000 14 0.796 0.642 0.677 15 0.728 0.569 0.599 Mean 0.839 0.729 0.733 0 0.2 0.4 0.6 0.8 1 1.2 1 2 3 4 5 6 7 8 9101112131415 Overall efficiency Group 1 Overall efficiency Group 2 Overall efficiency Group 3 Figure 1. Changes in operating efficiency trend of various indicators combinations.  A Slacks-based Measure of Efficiency of Electric Arc Furnace Activity with Undesirable Outputs Copyright © 2011 SciRes. JSSM 233 6 shows, fo r each of the 15 EAFs and every specification, the efficiency score achieved. It can be observed that, given a particular EAF, effi- ciency depends on the specification estimated. Visual inspection of Table 6 reveals some interesting features. Take DMU 14 as an example, the removal of ‘dust emissions’ would drop the efficiency value from 0.677 to 0.642. This shows that ‘dust emissions’ were the more sensitive variables than ‘wastewater emissions’ for the operational performance of this EAF. DMU 11 is 0.679 efficient under the Original combination 2, but only 0.645 efficient under combination 3. It is clear that this EAF activity has a strong at dust emissions. 7. Conclusions Evaluation of the operational performance of EAFs is important for ensuring efficiency in the iron & steel in- dustry. By adopting SBM-DEA models and considering the undesirable output, iron & steel industry can accu- rately assess aspects of their own performance that re- quire improvement, and can gain an enhanced under- standing of the current EAF operational status and future improvement. Here SBM-DEA analysis has provided several useful insights. First, efficiency value analysis has established that while some major EAFs are of optimal scale, others are not. Secondly, slack variable analysis is seen as potentially providing an understanding of how EAFs can improve their operational performance by enabling managers can focus on a limited number of variables for short-term and long-term improvement. Thirdly, sensitivity analysis shows that the ‘dust emis- sions’ and the ‘Wastewater emissions’ are two undesir- able output variables that have higher sensitivity with respect to EAF efficiency. Moreover DEA can be based on non-financial evaluations, it is appropriate to compare DMUs with different cost conditions. 8. Acknowledgements This work was financially supported by National Natural Science Foundation of China (No. 70971056), and the Department of Science and Technology, Jiangsu Provin- cial People’s Government (BK2009728) of the People’s Republic of China. REFERENCES [1] A. Charnes, W. W. Cooper and E. Rhodes, “Measuring Efficiency of Decision Making Units,” European Journal of Operational Research, Vol. 2, No. 4, 1978, pp. 429-444. doi:10.1016/0377-2217(78)90138-8 [2] L. M. Seiford, “Data Envelopment Analysis: The Evolu- tion of the State of the Art (1978-1995),” Journal of Pro- ductivity Analysis, Vol. 7, No. 2-3, 1999, pp. 99-137. doi:10.1007/BF00157037 [3] W. W. Cooper, L. M. Seiford and K. Tone, “Data Envel- opment Analysis: A Comprehensive Text with Models, Applications, References, and DEA-Solver Software,” Kluwer Academic, Boston, 2000. [4] S. Mota, J. H. Benzecry and R. Y. Qassim, “A Model for the Application of Data Envelopment Analysis in Activ- ity-based Management,” International Journal of Tech- nology Management, Vol. 17, No. 7/8, 1999, pp. 862-868. doi:10.1504/IJTM.1999.002749 [5] C. Homburg, “Using Data Envelopment Analysis to Benchmark Activities,” International Journal of Produc- tion Economics, Vol. 73, No. 1, 2001, pp. 51-58. doi:10.1016/S0925-5273(01)00194-3 [6] P. Y. Ou, Y. L. Wang and P. X. Wang, “The Application of Composite DEA in Activity Analysis and Evaluation,” Systems Engineering, Vol. 24, No. 6, 2006, pp. 52-57. [7] P. Y. Ou and F. J. Wang, “The Resources Utilization Efficiency Evaluation of Activity Based on DEA,” Chi- nese Journal of Management, Vol. 6, No. 8, 2009, pp. 1061-1065. [8] R. Fare, S. Grosskopt, C. A. K. lovell and C. Pasurka, “Multilateral Productivity Comparisons When Some Outputs are Undesirable: A Nonparametric Approach,” Review of Economics and Statistics, Vol. 71, No. 1, 1989, pp. 90-98.doi:10.2307/1928055 [9] H. Schee, “Undesirable Outputs in Efficiency Valua- tions,” European Journal of Operational Research, Vol. 132, No. 2, 2001, pp. 400-410. doi:10.1016/S0377-2217(00)00160-0 [10] L. M. Seiford and J. Zhu, “Modeling Undesirable Factors in Efficiency Evaluation,” European Journal of Opera- tional Research, Vol. 142, No. 1, 2002, pp. 16-20. doi:10.1016/S0377-2217(01)00293-4 [11] K. Tone, “A Slacks-Based Measure of Efficiency in Data Envelopment Analysis,” European Journal of Opera- tional Research, Vol. 130, No. 3, 2001, pp. 498-509. doi:10.1016/S0377-2217(99)00407-5 [12] K. Tone, “A Slacks-Based Measure of Super-Efficiency in Data Envelopment Analysis,” European Journal of Operational Research, Vol. 143, No. 1, 2002, pp. 32-41. doi:10.1016/S0377-2217(01)00324-1
|