Journal of Geoscience and Environment Protection, 2014, 2, 8-12
Published Online December 2014 in SciRes. http://www.scirp.org/journal/gep
http://dx.doi.org/10.4236/gep.2014.25002
How to cite this paper: Shergunova, N. A., Solovev, S. V., Baikov, K. S., Chernenko, Yu. V., & Poshivailo, Ya. G. (2014). Com-
puter Modelling Average Annual Temperature in the Ground Layer of Air for the South of Western Siberia (Russia). Journal
of Geoscience and Environment Protection, 2, 8-12. http://dx.doi.org/10.4236/gep.2014.25002
Computer Modelling Average Annual
Temperature in the Ground Layer of Air for
the South of Western Siberia (Russia)
N. A. Shergunova, S. V. Solovev, K. S. Baikov, Yu. V. Chernenko, Ya. G. Poshivailo
Institute of Soil Science and Agrochemisry, Novosibirsk, Russia
Email: elka_palkina @mail.ru , solo vyev87@ mail.ru , kbaikov@mail.ru, yuliachernenko89@yandex.ru,
yaroslava_po@mail.ru
Received N ove mber 20 14
Abstract
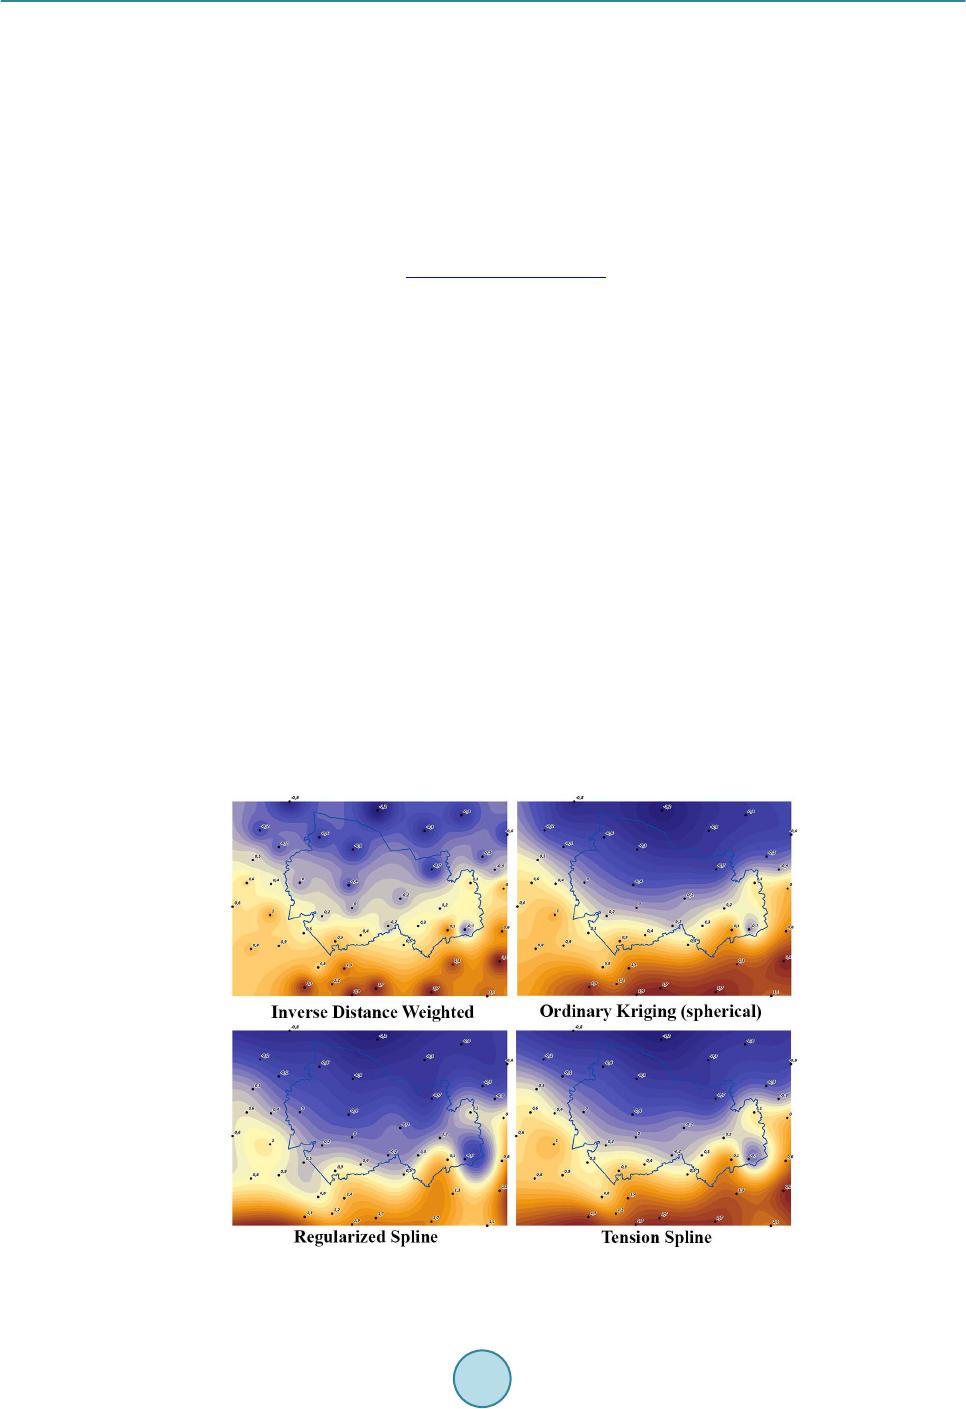
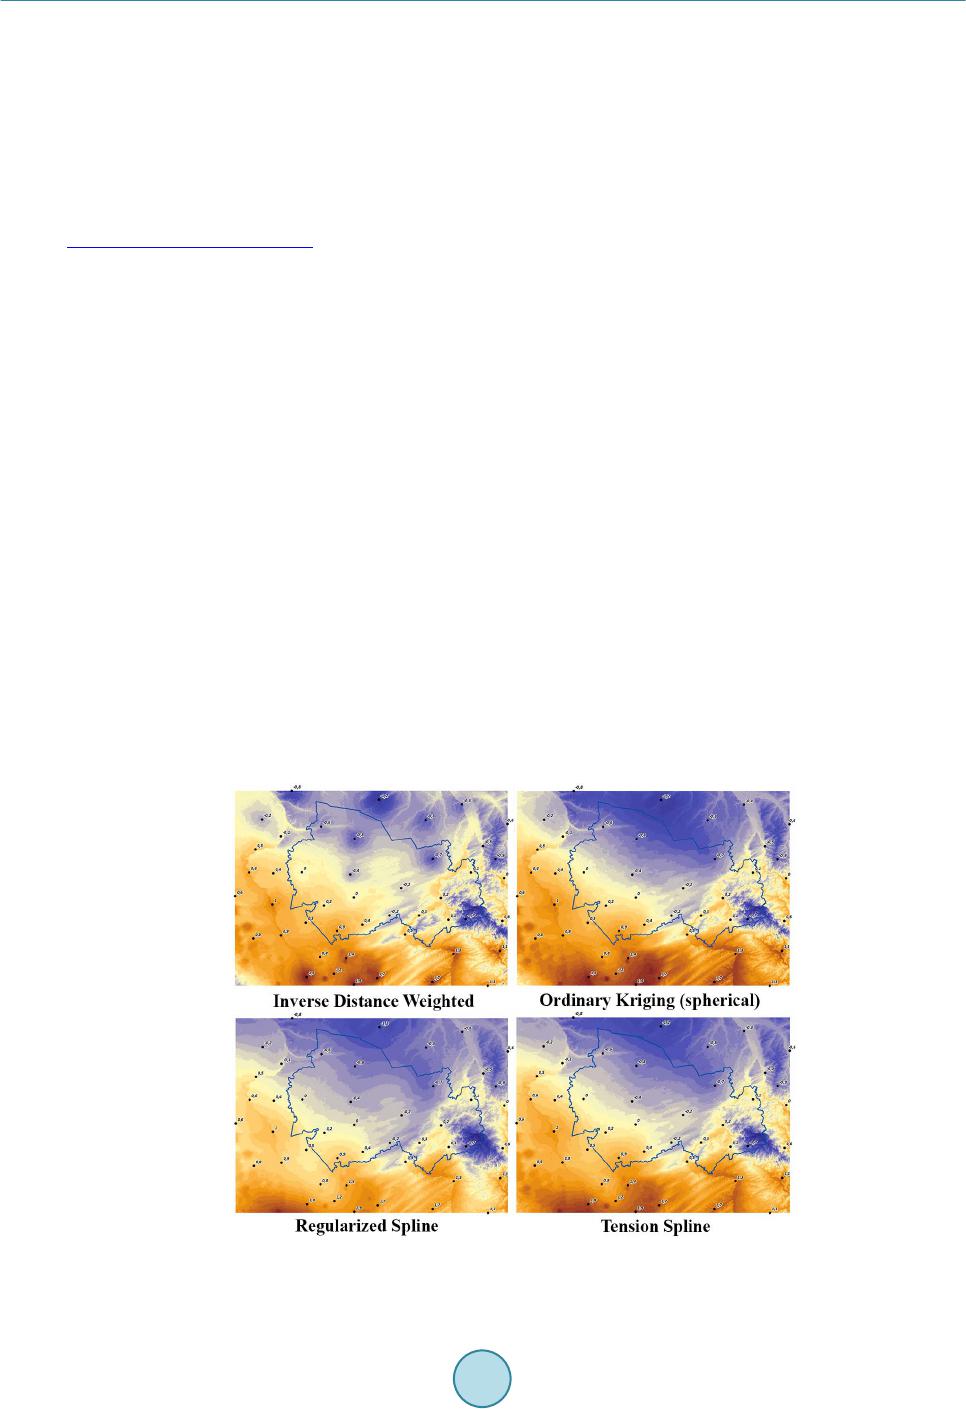
Computer modelling the map of average annual temperature in the ground layer of air is per-
formed for the southern part of Western Siberia (Russia). Four methods for data interpolation
were used in ArcMap 9. Procedure of creation of digital model is described in detail. An original
mathematic way for ranking of methods is proposed. According to results, Ordinary Kriging me-
thod gives the best approximation to the initial data.
Keywords
Computer Modelling, Tem p erature, Interp olati on, Western Siberia
1. Introduction
In connection with development of computer technologies and wide introduction of computers in the sphere of
scientific researches, the questions of their effective use for modelling, identication and scientific prognosis be-
come more and more actual, for example, in ecology, climatology, soil science. The insufficient amount of
models corresponding to the real data is observed in these sciences.
Difficulty of accumulation and processing of spatial data, as well as complication of simultaneous account of
many factors influencing on a natural situation, do such procedure very difficult and expense. Researchers work
in the conditions of permanent deficit of information: many attributes have a low level of informing, other pa-
rameters are absent often (Tsaregorodcev, & Pogrebnaya, 1998).
The executed research has in focus development of effective paths for the study of spatial distribution of cli-
matic indexes on the basis of the use of modern computer technologies. An aim of this research is mapping val-
ues of middle annual temperature on the basis of their spatial distribution and construction of the model of av-
erage annual temperature on long-term data for territory of the Novosibirsk Oblast (Western Siberia, Russia)
using ArcGis.
The study area is located in the southeast West-Siberian plain and only in the utmost east go spurs Salairo-
Kuznetsk mountain region, in its turn, determines its climatic features (Natural zoning and, 2010). The climate is
N. A. Shergunova et al.
9
continental with a long cold winter and hot short summer, average air temperature rises from north-east to
south-west (Alisov, Berlin, & Michael, 1954).
The important initial stage of work was executed is systematization and unitization of heterogeneous basic
data as electronic databases and thematic layer in the geographic information system.
Creation of digital map of average annual temperature did a necessity the decision of next tasks:
1) input and systematization of the long-term measuring of temperature of air in the ground two-meter layer
for 16 weather-stations on territory of the Novosibirsk area and thirty such items around (Climate handbook
USSR, 1966; Scientific and applied climate handbook USSR, No. 17, 1998; Scientific and applied climate
handbook USSR, No. 20, 1998);
2) filling of data base for values of average annual temperature, with attachment to position of weather-sta-
tions, including a height above a sea level (http://meteo .in fospac e.r u);
3) creation by means of the different algorithms realized in the environment of ArcGis, set of models of aver-
age annual temperature of the ground layer of air, for territory of south part of West Siberia (Novosibirsk Oblast
and fragments of nearby regions);
4) discussion of results by means of criteria and expert estimation and choice most suitable from them.
2. Materials and Methods
Long-term (30 years) series of temperature data in the ground layer of air (using data from regional weather-
stations, including 16 points in the Novosibirsk Oblast and 30 ones near her borders) were put into thematic da-
tabase. Initial temperature diapason totaled [1.2˚C; 1.9˚C].
In application of ArcMap 9.3, special layer with attributive table of information on names, measures of aver-
age air temperature, position of weather-stations above sea level, was generated on the first stage, using the
coordinates of weather-station s.
Vertical gradient of temperature in troposphere, that equal .65 of a degree Celsius per 100 meters, was in-
volved in modeling (Polikarpov, Tchebakova, & Nazimova, 1986).
By the tools of ArcGis 9, data on average annual temperature in points were converted to temperature on 142
metersmedium altitude for registered weather-stations (ArcGis 9 ArcMap User guide, 2000-2004). Obtained
temperature diapason totaled stations [1.49˚C; 1.95˚C].
Thus, all indexes are put in one and the same plane, that allowed to choose a suitable method for data interpo-
lation in ArcGis Spatial Analyst (ArcGis 9 Spatial Analyst User guide, 1999-2001).
As interpolation methods were used (Figure 1):
Figure 1. Temperature rasters on the level 142 meters above sea level.
N. A. Shergunova et al.
10
Inverse Distance Weighted
Ordinary Kriging (spherical)
Regularized Spline
Tension Spline
Temperature levels (ranges) on resulting rasters have some differences for methods: Inverse Distance
Weighted [1.489˚C; 1.949˚C], Ordinary Kriging (spherical) [1.489 ˚C; 1.948˚C], Regularized Spline
[1.646˚C; 2.968˚C], Tension Spline [1.569˚C; 2.123˚C].
Then these rasters were performed by means of Spatial Analyst. Data in every cell were returned from virtual
plane on their real height, using data for relief of SRTM (Shuttle Radar Topography Mission)
(http://gis-lab.info/qa/srtm.html), according to a formula:
[] []
( )
142_1 .0.0065interpolationSRTM kmtif+− ⋅
(1)
where interpolation—interpolated raster of average annual temperature, 142medium altitude for registered
weather-stations, SRTM.tifraster for relief, .0065vertical gradient of temperature, that equal .0065 of a de-
gree Celsius per 1 meter.
Four digital average annual temperature models having 1km pixel were generated in projection UTM WGS
84 (Universal Transverse Mercator (World Geodetic System 84)) for the southern part of Western Siberia in
Russia (Figure 2).
Novel temperature levels (ranges) for digital maps are: Inverse Distance Weighted [1.975˚C; 2.065˚C], Or-
dinary Kriging (spherical) [2.094˚C; 2.074˚C], Regularized Spline [2.891˚C; 3.396˚C], Tension Spline
[2.443˚C; 2.503˚C].
3. Results and Discussion
Cartographic model were further analyzed in a software product Global Mapper, ver. 16. As an indicator of se-
lected zero isotherm (Figure 3). Zero isotherm on method Inverse Distance Weighted noticeably displaced in
the area of positive temperatures relatively two of meteo stations with zero average annual temperature. In the
model by Kriging zero isotherm very accurately approximated to zero points. Two models on Regularized
Spline and Tension Spline similar by Kriging, but plus isotherm displaced toward the periphery in south-west
and understated isotherms in foothills Salair (south-eastern part of the territory).
As a result, of the methods considered interpolation temperature data method Ordinary Kriging selected the
best (Figure 4).
Figure 2. Four digital average annual temperature models, calculated by dif-
ferent interpolation.
N. A. Shergunova et al.
11
Figure 3. Four digital average annual temperature models with isotherms through .5˚C.
Figure 4. 3D-model for average annual temperature in southern part of Western Siberia (Russia). Ordinary Kriging.
This investigation is performed in Institute of Soil Science and Agrochemistry, Novosibirsk, Russia; under
financial supporting of Russian government scientific program, project VI.54.1.3 (scientific leader Dr. K.S.
Bai kov).
N. A. Shergunova et al.
12
References
Climate Handbook USSR (1966). Vol. II. The Temperature of the Air and Soil. No. 18. Kazakh SSR. L., 656 p.
Scientific and Applied Climate Handbook USSR (1998). Ser. 3 Long-Term Data. Vol. 1-6, No .17. Tyumen and Omsk Regio n .
SPb., 702 p.
Scientific and Applied Climate Handbook USSR (1998). Ser. 3 Long-Term Data. Vol. 1-6, No . 20. Tomsk, Novosibirsk, Ke-
merovo R egio n , Altay. SPb. 702 p.
http://meteo.infospace.ru
ArcGis 9 ArcMap User guide (2000-2004). ESRI. 219 p.
ArcGis 9 Spatial Analyst User Guide (1999 -2001). ESRI. 219 p.
Polikarpov, N. P., Tchebakova, N. M., & Nazimova, D. I. (1986). Climate and Mountain Forests of Southern Siberia. Novo-
sibirsk, 226 p.
http://gis-lab.info/qa/srtm.html
Tsaregorodcev, V. G., & Pogrebnaya, N. A. (1998). Neural Network Method of Information Processing in the Prediction
Problem Climatic Characteristics and Silvicultural Properties of Landscape Zones. Methods of Neuroinformatics. Collec-
tion of Scientific Works, Krasno yarsk, 65-110.
Natural Zoning and the Current State of Soils of the Novosibirsk Region (Atlas) (2010). Novosibirsk, 20 p.
Alisov, B. P., Berlin, I. A., & Michael, V. M. (1954). Course Climatology. Vol. 3. The Climate of the Globe. L., 321 p.