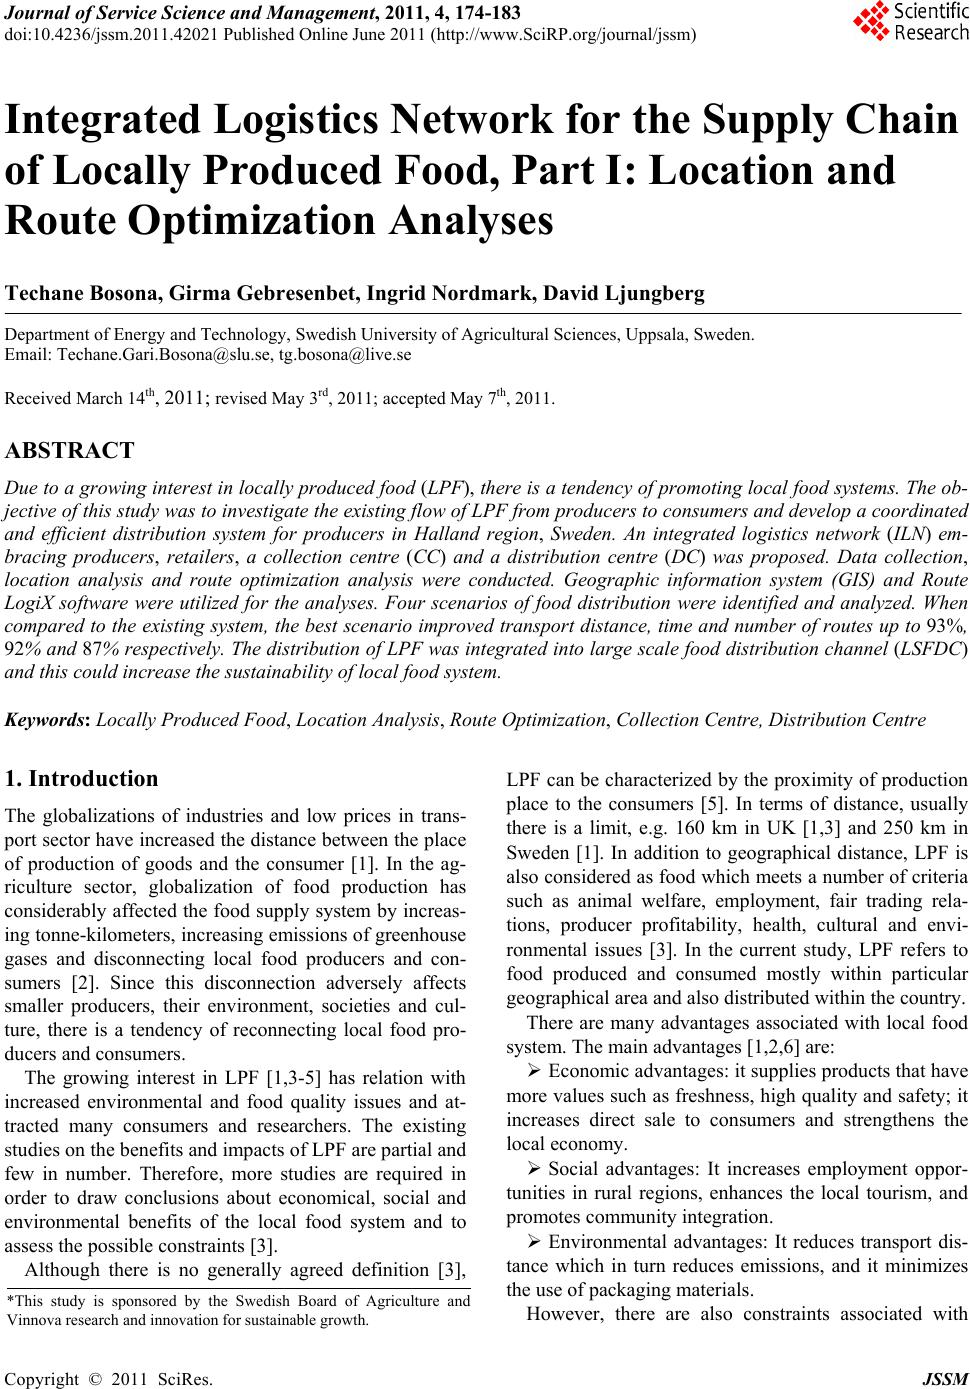
 Journal of Service Science and Management, 2011, 4, 174-183 doi:10.4236/jssm.2011.42021 Published Online June 2011 (http://www.SciRP.org/journal/jssm) Copyright © 2011 SciRes. JSSM Integrated Logistics Network for the Supply Chain of Locally Produced Food, Part I: Location and Route Optimization Analyses Techane Bosona, Girma Gebresenbet, Ingrid Nordmark, David Ljungberg Department of Energy and Technology, Swedish University of Agricultural Sciences, Uppsala, Sweden. Email: Techane.Gari.Bosona@slu.se, tg.bosona@live.se Received March 14th, 2011; revised May 3rd, 2011; accepted May 7th, 2011. ABSTRACT Due to a growing interest in locally produced food (LPF), there is a tendency of promoting local food systems. The ob- jective of this study was to investigate the existing flow of LPF from producers to consumers and develop a coordinated and efficient distribution system for producers in Halland region, Sweden. An integrated logistics network (ILN) em- bracing producers, retailers, a collection centre (CC) and a distribution centre (DC) was proposed. Data collection, location analysis and route optimization analysis were conducted. Geographic information system (GIS) and Route LogiX software were utilized for the analyses. Four scenarios of food distribution were identified and analyzed. When compared to the existing system, the best scenario improved transport distance, time and number of routes up to 93%, 92% and 87% respectively. The distribution of LPF was integrated into large scale food distribution channel (LSFDC) and this could increase the sustainability of local food system. Keywords: Locally Produced Food, Location Analysis, Route Optimization, Collection Centre, Distribution Centre 1. Introduction The globalizations of industries and low prices in trans- port sector have increased the distance between the place of production of goods and the consumer [1]. In the ag- riculture sector, globalization of food production has considerably affected the food supply system by increas- ing tonne-kilometers, increasing emissions of greenhouse gases and disconnecting local food producers and con- sumers [2]. Since this disconnection adversely affects smaller producers, their environment, societies and cul- ture, there is a tendency of reconnecting local food pro- ducers and consumers. The growing interest in LPF [1,3-5] has relation with increased environmental and food quality issues and at- tracted many consumers and researchers. The existing studies on the benefits and impacts of LPF are partial and few in number. Therefore, more studies are required in order to draw conclusions about economical, social and environmental benefits of the local food system and to assess the possible constraints [3]. Although there is no generally agreed definition [3], LPF can be characterized by the proximity of produ ction place to the consumers [5]. In terms of distance, usually there is a limit, e.g. 160 km in UK [1,3] and 250 km in Sweden [1]. In addition to geographical distance, LPF is also con sidered as food which meets a number of criteria such as animal welfare, employment, fair trading rela- tions, producer profitability, health, cultural and envi- ronmental issues [3]. In the current study, LPF refers to food produced and consumed mostly within particular geographical area and also distributed within the country. There are many advantages associated with local food system. The main advantages [1,2,6] are: Economic advantages: it supplies products that have more values such as freshness, high quality and safety; it increases direct sale to consumers and strengthens the local economy. Social advantages: It increases employment oppor- tunities in rural regions, enhances the local tourism, and promotes community integration. Environmental advantages: It reduces transport dis- tance which in turn reduces emissions, and it minimizes the use of packaging materials. However, there are also constraints associated with *This study is sponsored by the Swedish Board of Agriculture and Vinnova research and innovation for sustainable growth. 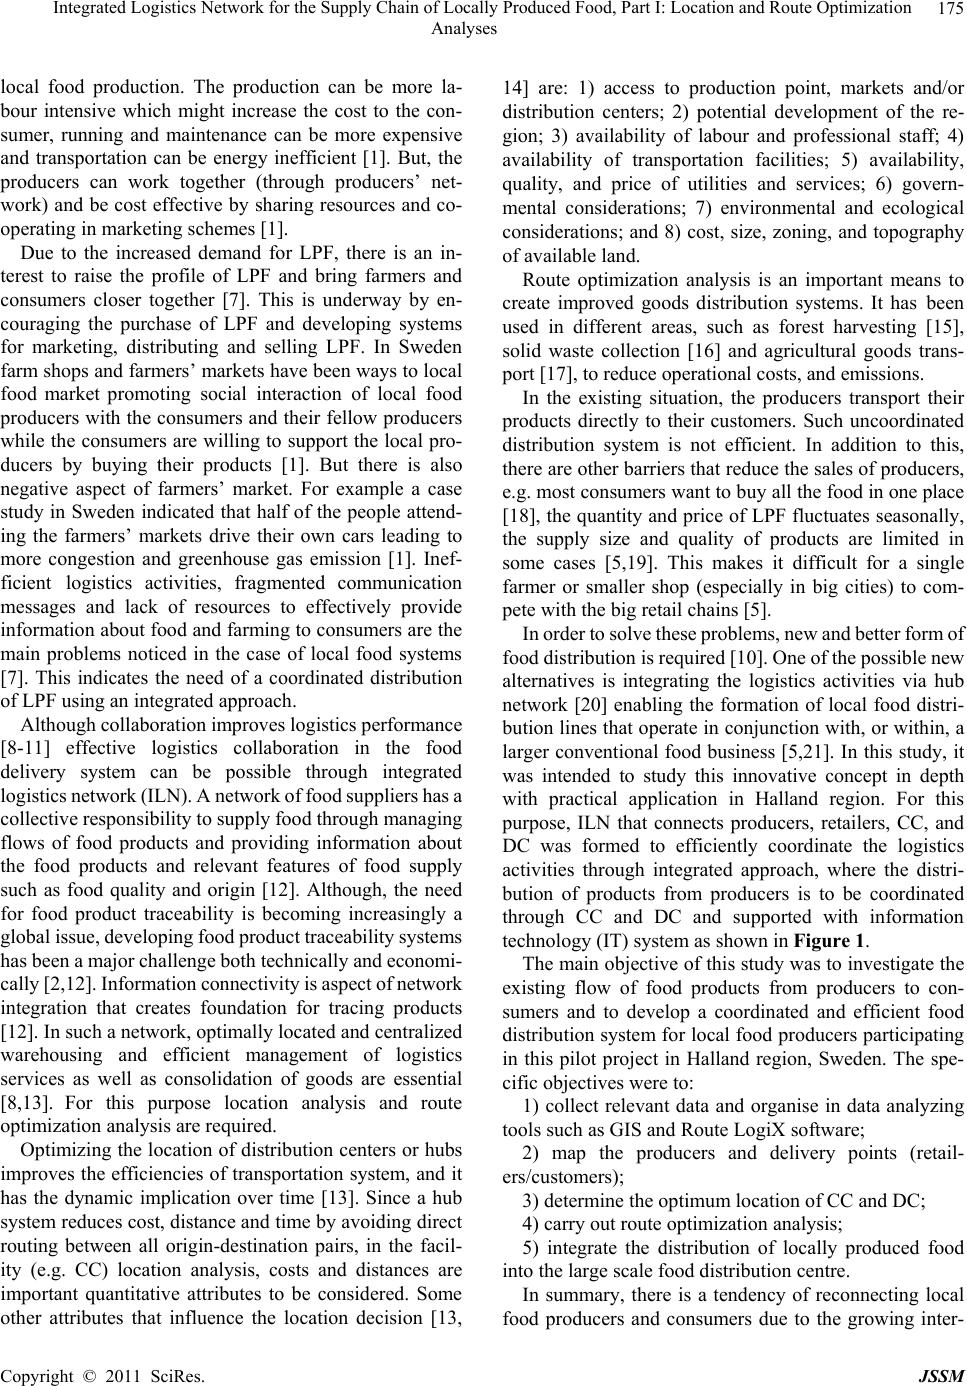 Integrated Logistics Network for the Supply Chain of Locally Produced Food, Part I: Location and Route Optimization Analyses Copyright © 2011 SciRes. JSSM 175 local food production. The production can be more la- bour intensive which might increase the cost to the con- sumer, running and maintenance can be more expensive and transportation can be energy inefficient [1]. But, the producers can work together (through producers’ net- work) and be cost effective by sharing resources and co- operating in marketing schemes [1]. Due to the increased demand for LPF, there is an in- terest to raise the profile of LPF and bring farmers and consumers closer together [7]. This is underway by en- couraging the purchase of LPF and developing systems for marketing, distributing and selling LPF. In Sweden farm shops and farmers’ markets have been ways to local food market promoting social interaction of local food producers with the consumers and their fellow producers while the consumers are willing to support the local pro- ducers by buying their products [1]. But there is also negative aspect of farmers’ market. For example a case study in Sweden indicated that half of the people attend- ing the farmers’ markets drive their own cars leading to more congestion and greenhouse gas emission [1]. Inef- ficient logistics activities, fragmented communication messages and lack of resources to effectively provide information about food and farming to consumers are the main problems noticed in the case of local food systems [7]. This indicates the need of a coordinated distribution of LPF using an integrated approach. Although collaboration improves logistics performance [8-11] effective logistics collaboration in the food delivery system can be possible through integrated logistics network (ILN). A network of food suppliers has a collective responsibility to supply food through managing flows of food products and providing information about the food products and relevant features of food supply such as food quality and origin [12]. Although, the need for food product traceability is becoming increasingly a global issue, developing food product traceability systems has been a m a jor c hall enge b ot h tec hni cally a nd ec onomi- cally [2,12] . Inform ation connectivi ty is aspect of network integration that creates foundation for tracing products [12]. In such a network, optimally located and centralized warehousing and efficient management of logistics services as well as consolidation of goods are essential [8,13]. For this purpose location analysis and route optimization analysis are required. Optimizing the location of distribution centers or hubs improves the efficiencies of transportation system, and it has the dynamic implication over time [13]. Since a hub system reduces cost, distance and time by avoiding direct routing between all origin-destination pairs, in the facil- ity (e.g. CC) location analysis, costs and distances are important quantitative attributes to be considered. Some other attributes that influence the location decision [13, 14] are: 1) access to production point, markets and/or distribution centers; 2) potential development of the re- gion; 3) availability of labour and professional staff; 4) availability of transportation facilities; 5) availability, quality, and price of utilities and services; 6) govern- mental considerations; 7) environmental and ecological considerations; and 8) cost, size, zoning, and topography of available land. Route optimization analysis is an important means to create improved goods distribution systems. It has been used in different areas, such as forest harvesting [15], solid waste collection [16] and agricultural goods trans- port [17], to reduce operational costs, and emissions. In the existing situation, the producers transport their products directly to their customers. Such uncoordinated distribution system is not efficient. In addition to this, there are other barriers that reduce the sales of producers, e.g. most consu mers want to bu y all the food in one place [18], the quantity and price of LPF fluctuates seasonally, the supply size and quality of products are limited in some cases [5,19]. This makes it difficult for a single farmer or smaller shop (especially in big cities) to com- pete with the big retail chains [5]. In order to solve these problems, new and better form of food distri bution is required [10]. One of the po ssible new alternatives is integrating the logistics activities via hub network [20] enabling the formation of local food distri- bution lines that o perate in conjunction with, or within , a larger conventional food business [5,21]. In this study, it was intended to study this innovative concept in depth with practical application in Halland region. For this purpose, ILN that connects producers, retailers, CC, and DC was formed to efficiently coordinate the logistics activities through integrated approach, where the distri- bution of products from producers is to be coordinated through CC and DC and supported with information technology (IT) system as shown in Figure 1. The main objective o f this study was to investigate the existing flow of food products from producers to con- sumers and to develop a coordinated and efficient food distribution system for local food producers participating in this pilot project in Halland region, Sweden. The spe- cific objectives were to: 1) collect relevant data and organise in data analyzing tools such as GIS and Route LogiX software; 2) map the producers and delivery points (retail- ers/customers); 3) determine the optimum location of CC and DC; 4) carry out route optimization analysis; 5) integrate the distribution of locally produced food into the large scale food distribution centre. In summary, there is a tendency of reconnecting local food producers and consumers due to the growing inter- 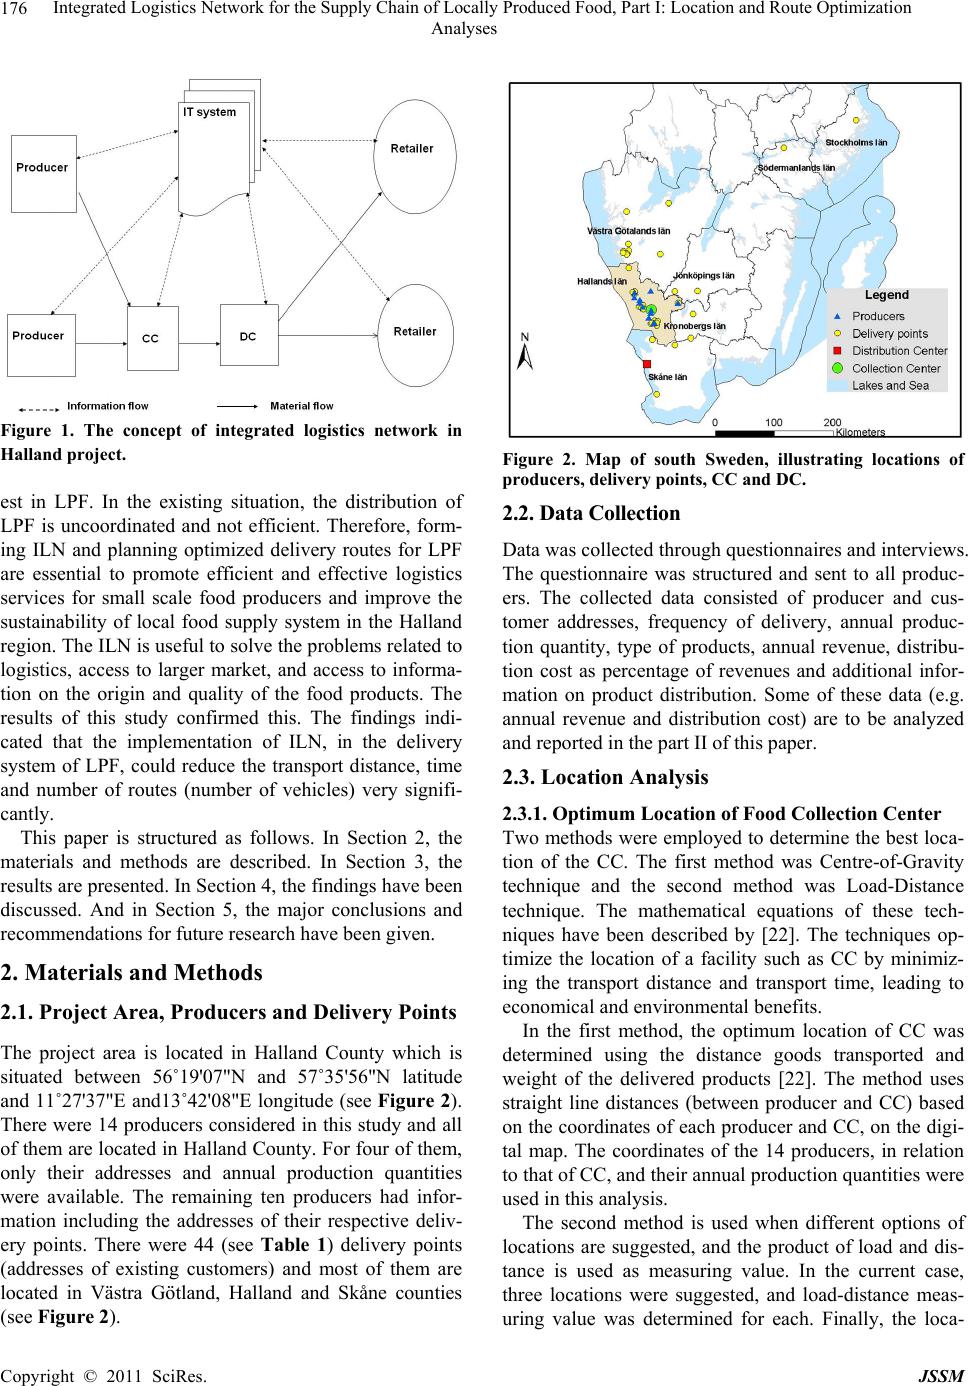 Integrated Logistics Network for the Supply Chain of Locally Produced Food, Part I: Location and Route Optimization Analyses Copyright © 2011 SciRes. JSSM 176 Figure 1. The concept of integrated logistics network in Halland project. est in LPF. In the existing situation, the distribution of LPF is uncoordinated and not efficient. Therefore, form- ing ILN and planning optimized delivery routes for LPF are essential to promote efficient and effective logistics services for small scale food producers and improve the sustainability of local food supply system in the Halland region. The ILN is useful to solve the problems related to logistics, access to larger market, and access to informa- tion on the origin and quality of the food products. The results of this study confirmed this. The findings indi- cated that the implementation of ILN, in the delivery system of LPF, could reduce the transport distance, time and number of routes (number of vehicles) very signifi- cantly. This paper is structured as follows. In Section 2, the materials and methods are described. In Section 3, the results are presented. In Section 4, the findings have been discussed. And in Section 5, the major conclusions and recommendations for future research have been given. 2. Materials and Methods 2.1. Project Area, Producers and Delivery Points The project area is located in Halland County which is situated between 56˚19'07"N and 57˚35'56"N latitude and 11˚27'37"E and13˚42'08"E longitude (see Figure 2). There were 14 producers considered in this study and all of them are located in Halland County. For four of them, only their addresses and annual production quantities were available. The remaining ten producers had infor- mation including the addresses of their respective deliv- ery points. There were 44 (see Table 1) delivery points (addresses of existing customers) and most of them are located in Västra Götland, Halland and Skåne counties (see Figure 2). Figure 2. Map of south Sweden, illustrating locations of producers, delivery points, CC and DC. 2.2. Data Collection Data was collected through question n aires and interviews. The questionnaire was structured and sent to all produc- ers. The collected data consisted of producer and cus- tomer addresses, frequency of delivery, annual produc- tion quantity, type of products, annual revenue, distribu- tion cost as percentage of revenues and additional infor- mation on product distribution. Some of these data (e.g. annual revenue and distribution cost) are to be analyzed and reported in the part II of this paper. 2.3. Location Analysis 2.3.1. Optimum Location of Food Collection Center Two methods were employed to determine the best loca- tion of the CC. The first method was Centre-of-Gravity technique and the second method was Load-Distance technique. The mathematical equations of these tech- niques have been described by [22]. The techniques op- timize the location of a facility such as CC by minimiz- ing the transport distance and transport time, leading to economical and environmental benefits. In the first method, the optimum location of CC was determined using the distance goods transported and weight of the delivered products [22]. The method uses straight line distances (between producer and CC) based on the coordinates of each producer and CC, on the digi- tal map. The coordinates of the 14 producers, in relation to that of CC, and their annual produ ction quan tities were used in this analysis. The second method is used when different options of locations are suggested, and the product of load and dis- tance is used as measuring value. In the current case, three locations were suggested, and load-distance meas- uring value was determined for each. Finally, the loca-  Integrated Logistics Network for the Supply Chain of Locally Produced Food, Part I: Location and Route Optimization Analyses Copyright © 2011 SciRes. JSSM 177 Table 1. Producers, their production quantity and number of delivery points. Producers Description P1 P2 P3 P4P5P6P7P8P9P10P11 P12 P13 P14 Quantity[t year-1] 20 55 25 15015168965303065 30 60 50 No. of delivery points 7 6 3 5 2 2 5 5 4 5 no info* no info no info no info *-no information on number of delivery points was obtained tion with lowest value of the summation of the load- dis- tance value was selected. The actual road distances were calculated with Route LogiX software [23] and the an- nual production quantity was considered as load value. One of large scale food distribution centers found in the region of these producers was chosen to serve as DC for the LPF. This DC is located in Helsingborg city and owned by one of the LSFDCs in Sweden. From the CC, the LPF are to be transported to distribution centre (DC). 2.3.2. Mapping the Production and Delivery Points, CC and DC First, the longitude and latitude coordinates were deter- mined for each producer, delivery point, and DC based on their postcode and additional geographical informa- tion obtained from digital database. The coordinates of CC were determined as described above. Then all the identified locations were mapped using ArcMAP of GIS software [24]. A point shape files representing the geo- graphic location of these places were created and dis- played on the map (see Figure 2). 2.4. Scenarios for Collection and Distribution of Locally Produced Food Coordination wi t hi n foo d s u ppl y chai ns i s essent i a l for t he effectiveness and efficiency of chains in the competitive environment and coordinative structures can be organised in different ways [25]. In the current study, different scenarios were considered to realize such coordination. In the coordination process different routes were created using the digital maps which enable the visualization of the production and delivery points in relation to CC and DC. The route optimization analysis was carried out using RoutelogiX software which has most powerful vehicle routing including optimization [23]. It finds optimized routes by minimizing driving distance and time, which in turn reduces transport cost and emission of green house gases. Since this software handles planning of one vehicle at a time, each of the routes formed in this study was optimized separat el y [23]. For detailed analysis, four scenarios were set carefully taking into consideration the relations between the pro- ducers, the delivery points, CC and DC. The delivery frequency and quantity p er tour were also taken into con- sideration based on the available information. 2.4.1. Scenario 1: When Producers Distribute Their Products In this case, all producers deliver their produces to their respective customers (retailers) in a single or more routes depending on the location and number of their custom- ers/delivery points (see Figure 3). This scenario is simi- lar to current distribution practice. Since there is no detail information concerning the distribution route for each producer (only the locations of customers were available) product delivery route was created for each producer with the assumption that deliveries to customers which are very close to each other can be done by the same route. Totally 23 possible routes were formed and ana- lyzed under this scenario. 2.4.2. Scenario 2: Collection by Producers and Distribution by DC Scenario 2 includes three parts of transporting products from producers to retailers. These are transporting from producers to CC, from CC to DC and from DC to deliv- ery points (see Figure 4). Under this Scenario two op- tions, Option I and Option II, were considered. Option I: Wh en distribution o f food products fr om DC to retailers is to be treated separately at DC i.e. assigning vehicles that distribute only LPF of the producers under consideration. For this purpose, 5 distribution routes were designed where the number of delivery points served by a single route varied from 2 to 12. Option II: An Integrated distribution: In this case, transporting LPF from producers to CC and from CC to DC is similar to that of Option I. However, the delivery from DC to delivery points was considered to be inte- grated into the existing distribution routes of LSFDC. It was also assumed that the products could be delivered only by utilizing the empty space of the trucks in the LSFDC as about 30 - 40% of loading capacity of these Figure 3. Fragmented distri bution in Sc e nario 1.  Integrated Logistics Network for the Supply Chain of Locally Produced Food, Part I: Location and Route Optimization Analyses Copyright © 2011 SciRes. JSSM 178 Figure 4. Uncoordinated collection and coordinated distri- bution for Scenario 2 (Option I). trucks is usually unutilized. 2.4.3. Scenario 3: Collection by CC and Distribution by DC In Scenario 3, the collection of products to CC and de- livery to DC were considered to be coordinated and man- aged by the CC and for this two routes were created (see Figure 5). Similar to scenario 2, in scenario 3, two op- tions were considered for distribution from DC to con- sumers/retailers. 2.4.4. Scenario 4: Integrated Collection and Distribution In Scenario 4, both collection and distribution of prod- ucts were to be coordinated in every route. This coordi- nation is to be performed by centralised management with support of IT system, where the drivers receive in- formation from the communication centre and collect the products from the producers while delivering to the re- tailers at the same time (see Figure 6). This can be prac- tical by furnishing the trucks with different compart- ments for different products being collected and deliv- ered. In this case, the task is to pick the products from producers in a route and deliver to the retailer in the same route. Four routes were created based on the geographical Figure 5. Coordinated collection and coordinated distribu- tion for Scenario 3 (Option I). Figure 6. The concept of coordinated collection and distri- bution (scenario 4). location of producers and delivery points i.e. assigning producers and consumers close to each other, on the same route. Concerning the vehicles, in scenario 1 (existing system) and in the collection part of scenario 2, the producers could use light transport cars and passenger cars. In the option I (of scenar io 2 and scenario 3) and in scenario4 it was assumed that light trucks with loading capacity up to 3.5 t would be assigned. In option II (of scenario 2 and scenario 3) it was assumed that light trucks (for collec- tion and transporting to DC) and heavy trucks (about 30 - 40% of the capacity of trucks owned by LSFDC) would be used for further distribution from DC. 3. Results 3.1. Investigation of Producers and Product Delivery Points All the producers of LPF considered in this study were located within the radius of 50km from CC, within Halland County (see Figure 2) while most of their exist- ing customers were found within the radius of 180km from CC. Out of 44 delivery points, 22 were found in Halland (50%) and 20 delivery points were located in the adjoining counties (46%). Only 2 d elivery points were in non adjoining counties. Two of these delivery points, Norrtälje (within Stock- holm County) and Eskilstuna (within Södermanland County) are far from both CC and DC (see Figure 2). Norrtälje is the furthest away, 625 km from DC and 554 km from CC while Eskilstuna is the second furthest away, 520 km from DC and 443 km from CC. Delivery to Norrtälje was only once per week, while delivery to Eskilstuna was 5 times per week. Table 1 reports the number of delivery points for 10 of the producers and the number varied from 2 to 7. Totally,  Integrated Logistics Network for the Supply Chain of Locally Produced Food, Part I: Location and Route Optimization Analyses Copyright © 2011 SciRes. JSSM 179 the 14 producers produce 700 tons per year. For each producer th e quantity varied from 15 tons to 150 ton s per year with mean value of 50 tons per year. The largest product type was fruits and vegetables as about 33% of the producers supplied fruits and vegeta- bles. About 25% supplied meat while the grain products, egg and dairy products were supplied by 17%, 17% and 8% of producers respectively. The producers were selling about 63% of the products within their own county (see part II). The producers used three means to transport their product to customers in the existing distribution practice (see Figure 7), i.e. using their own vehicles (75%), working with transport companies (68%) and cooperating with other producers (16%) (see Figure 7). 3.2. Location and Route Optimization Analyses The location analyses conducted using Centre-of-Gravity and Load-Distance techniques showed that the optimum location of the CC was at place called Slöinge with coor- dinates of 56˚ 55'15"N latitude and 12˚34'15"E longitude. The geographical location of the DC was at 56˚02'56"N latitude and 12˚43'08"E longitude which is located in Helsingborg city , about 2 08 k m away from CC. Regarding the route optimization analysis, 23 routes were created and analyzed in scenario 1. The results in- dicated that the simulated driving distances and times varied from 56 km to 1554 km and from 57 min to 17 hr respectively. For the scenario 1, total driving distance was 6159 km while total driving time was about 69 hr. In scenario 2, the driving distance and time were simu- lated for each producer in the case of food collection to CC. For two producers, the driving distance and time were considered to be zero, because they were located at the same place as CC. For the rest of producers, the simulated driving distance varied from 9 km to 123 km while the driving time varied from 6 min to 1 hr and 36 min. The total distance and time for the 10 producers were 519 km and 6 hr and 26 min. For scenario 3, two optimized collection routes were Figure 7. Means of transporting LPF in the current practice. formed and analyzed. The simulated driving distances were 70 km and 169 km for route1 and route 2 respec- tively while their driving times were 1hr and 2 hr and 33 min. For the case of food distribution from DC to cus- tomers/retailers, 5 routes were formed and optimized in both scenario 2 and scenario 3. The total driving distance and time for the 5 routes were about 3047 km and 34 hr. The distance of each route varied from 425 km to 1352 km while the time varied from 1 hr and 27 min to 14 hr. Considering both collection and distribution routes to- gether, for scenario 2 (option I), total simulated driving distance and driving time of all routes were about 3774 km and 42 hr respectively. For option II the figures were less i.e. about 727 km and 8 hr. Similarly, for sce- nario 3 the total driving distance and time were about 3493 km and 40 hr for Option I , and about 446 km and 6 hr for option II. Figure 8 presents examples of simulated routes in scenario 3. For the scenario 4, the simulated driving distance and time varied from 133 km to 1124 km and from 3 hr to 13 hr. The total driving distance and time and number of routes were 2343 km, 30 hr and 4 routes respectively indicating the improvements of 62%, 57% and 83% (see Table 2). Table 2 presents the summary of route optimisation analysis for all scenarios . Wh en compa r ed to s c e nar io 1 , a significant saving was gained in distance, time and no of routes in the remaining three scenarios. For example, in scenario 2 (option II) the driving distance, driving time and n o o f ro ut es we re re du ce d fr om 61 59 km , 69 h r a nd 2 3 routes to 727 km, 8 hr and 11 routes respectively, indi- cating improvement of 88% in both distance and time and 48% in no of routes. Similarly, in option II of scenario 3, the total driving distance and time and no of routes were 446 km, 6 hr, and 3 routes with respective im- Figure 8. Examples of simulated routes for Scenario 3. (a) Collection route, (b) Distribution route.  Integrated Logistics Network for the Supply Chain of Locally Produced Food, Part I: Location and Route Optimization Analyses Copyright © 2011 SciRes. JSSM 180 Table 2. Summary of route optimization analysis. Scenario Driving Distance Driving Time No. of routesImprovement when compared to Scenario 1[%] [km] [h] Distance Time no. of routes Scenario 1 6159 69 23 - - - Scenario 2 Option I 3774 42 16 39 39 30 Option II 727 8 11 88 88 48 Scenario 3 Option I 3493 40 8 43 42 65 OptionII 446 6 3 93 91 87 Scenario 4 2343 30 4 62 57 83 provement of 93%, 91% and 87%. Table 2 presents the summary of route optimization analysis for all scenarios. When compared to scenario 1, a significant saving was gained in distance, time and no of routes in the remaining three scenarios. For example, in scenario 2 (option II) the driving distance, driving time and no of routes were reduced from 6159 km, 69 hr and 23 routes to 727 km, 8 hr and 11 routes respectively, in- dicating improvement of 88% in both distance and time and 48% in no of routes. Similarly, in option II of sce- nario 3, the total driving distance and time and no of routes were 446 km, 6 hr, and 3 routes with respective improvement of 93%, 91% and 87%. 4. Discussion 4.1. Main Characteristics of Existing Local Food Delivery System More than one third of producers produce fruits and vegetables. The physical distribution of such products requires appropriate packaging in order to be transported to end users. This type of pack aging can be facilitated by the proposed ILN. Concerning the food distribution activities, collabora- tion in the food supply chain was relatively uncommon in the existing system. Only about 16% of the participants had collaboration with othe r pr oducers so far. Although it was at low level, such an experience of collaboration can play important role in implementing the proposed coor- dinated distribution system in the Halland region. It was also known that about 68% of participants had experi- ence of working with transport companies. Most of the participants (about 75%) transported their products mainly with their own vehicles indicating that the logis- tics activities in the existing local food system were un- coordinated and needs improvement. In the existing system, the frequencies of product de- livery to customers varied markedly. Some of the pro- ducers delivered ten times a week to its major customers, while others only delivered during a limited period of the year and/or every other week. This has great impact on the logistics, because it makes the transport demand vary considerably throughou t the year. 4.2. Location and Route Optimization Analyses The location analysis enabled determines the best loca- tion of CC which facilitated the coordination of product collection and delivery to DC. This CC was determined considering only limited number of producers and their production quan tity. If more producers jo in the system in the future or if the producers increase production quan- tity the location of optimum CC might change. The result of rout optimization analysis indicated that the ILN could reduce the transport distance, time and number of routes when compared to the current distribu- tion practices which is similar to scenario 1. Although the improvements were gained in both option I and op- tion II (in scenario 2 and scenario 3), more saving was gained in option II, especially the saving in distance and time was increased by more than 50% when compared to the saving in option I. The saving in scenario 4 was bet- ter than that of option I. Option II of scenario 3, in which the improvements of 93%, 92% and 87% were gained for distance, time and routes respectively, was found to be the best of all sce- narios followed by option II of scenario 2. This signifi- cant saving in the option II was the result of integrating the distribution of LPF into the conventional LSFDC. 4.3. Implications of ILN 4.3.1. Improving Logistics Service In the existing product delivery system, about 75% of producers use their own vehicles to transport their prod- ucts i.e. the logistics service is fragmented. The produc- ers expressed their ambition to solve logistics problems through the application of the proposed ILN. Previous studies [26] and the significant improvements obtained in  Integrated Logistics Network for the Supply Chain of Locally Produced Food, Part I: Location and Route Optimization Analyses Copyright © 2011 SciRes. JSSM 181 the current study indicated that the integrated approach could increase the efficiency of logistics service in the supply chain of LPF. In the indentified scenarios, espe- cially, in the option II of scenario 2 and scenario 3, the LPF were considered to be loaded on empty spaces of the trucks being used in the conventional LSFDCs and this greatly improved the efficiency of utilizing the vehicles loading capacity. However, in option II, the delivery frequency and quantity to each existing customers might change leading to the dissatisfaction of these customers and this should be investigated further. 4.3.2. Expandi ng Po tential Market Area In this study, in addition to finding better solu tion for the logistics problems, the objective of the producers was to expand their sales area. Only 2 out of 44 existing cus- tomers were in non adjoining counties indicatin g that the producers have difficulties to expand their sales area and reach the consumers in the other counties. However, increasing sales of LPF needs to overcome the main problems (related to local food syste ms) such as low size of production and more volatility of market price and high seasonality of food products on market [4], inadequate or no packing and storage facilities, limited or no means of transport and limited knowledge of potential market [5]. These problems can be over- come, if the LPF be embraced by dominant food super- market and superstore chains [3] and this can be facilitated by the application of the proposed ILN which integrates the local food system into LSFDC and fulfils the ambition of the producers to expand their sales. 4.3.3. Improving Access to Information Efficient ways of sharing information and scarce/ exp e ns i ve re s ou rc es pl ay a k e y ro l e in d e ve lo pi n g IL N [ 27 , 28]. Well organized information concerning local food is also important to satisfy the increasing demand of con- sumers to have good knowledge and information of the food origin and how it is handled and transported [29]. Such consistent flow of information in local food system could be realized via the application of this ILN enabling producers and consumers get access to the right informa- tion at the right time. 4.3.4. Improving the Sustainability of Local Food Systems The de vel ope d IL N i s im p o r tan t to s e cu r e t h e f lo w o f LPF from producers to consumers and to improve the food quality through training opportunities and sharing/ learn- ing professional skills [1]. This type of better fo od supply chain management that empowers the producers is re- quired to achieve sustainable local food supply chain [25,30]. Especially in European countries where the populations mostly use supermarkets, local food system can be sustainable if it can become financially and physically accessible to the mainstream market, maxi- mizing distribution of LPF through supermarkets [21] and this accessibility to large market can be achieved through the app lication of the proposed ILN. The positive implication of ILN towards achieving and maintaining more sustainable local food systems can be confirmed by expanded potential markets, access to bet- ter technologies and practices, improved logistics and minimized food miles and reduced green house gas emissions [17,31], traceability of food origin, availability of information on nutrition and value. This ILN also cre- ates more opportunity for identifying problems in the supply chain of LPF and launching research projects to provide appropriate solutions and maintain the sustain- ability of local food systems in different regions/ countries [4]. Part II of this paper reports the results of analyses done regarding the implications of the proposed integrated approach on environment, marketing arrangements/ managements and economic tradeoffs in the supp ly chai n of LPF. 5. Conclusions This study initiated with the aim to investigate the exist- ing flow of LPF from producers to consumers and to develop a coordinated and efficient food distribution system for local food producers in Halland region. For this purpose, an ILN that embraced fourteen producers, 44 delivery points, one CC and one DC was formed. All producers were located within the radius of 50km from CC. Most of their existing customers were found within Halland county (50%) and the adjoining county (46%) within the radius of 180 km from CC. The optimized CC was located at 56˚55'15"N latitude and 12˚34'15"E longitudes. The DC, which was 208 km far from CC, was used as centre of the network to inte- grate the local food system into LSFDCs. The formation of ILN and the location and route opti- misation analyses, conducted based on four scenarios utilising tools such as GIS and professional Route LogiX software, made it possible to get more insight into the impact of integration of local food systems. When com- pared to the existing, uncoordinated delivery system which was most similar to scenario 1, the remaining sce- narios (scenarios 2, 3 and 4) showed significant im- provements. Option II of scenario 3 was found to be the best scenario with the improv ements of 93% for tr an sport distance, 92% for transport time and 87% for number of routes. Option II also improved the efficiency of utilizing the vehicles loading capacity in the LSFDC.  Integrated Logistics Network for the Supply Chain of Locally Produced Food, Part I: Location and Route Optimization Analyses Copyright © 2011 SciRes. JSSM 182 The application of this ILN will satisfy the needs of producers and consumers through solving the problems related to logistics, access to larger market, and access to information on the origin and quality of the food prod- ucts. These advantages of ILN indicate that the applica- tion of this type of integration will greatly improve the sustainability of local food systems. This study was site specific, and the analysis results mainly reflect the situation of the supply chain of LPF in the Halland region, which was selected for this study. Therefore, similar, site specific and detailed studies are required to establish well coordinated and sustainable supply chain systems for LPF. 6. Acknowledgements The authors would lik e to than k Prof . Dietrich von Ro sen for his fruitful discussions and valuable suggestions dur- ing the development of this paper. REFERENCES [1] H. Nilsson, “Local Food Systems from a Sustainability Perspective: Experiences from Sweden,” International Journal of Sustainable Society, Vol. 1, No. 4, 2009, pp. 347-363.doi:10.1504/IJSSOC.2009.028906 [2] C. Wallgren, “Local or Global Food Markets: A com- parison of Energy Use for Transport,” Local Environment, Vol. 11, No. 2, 2006, pp. 233-251. doi:10.1080/13549830600558598 [3] P. Jones, D. Comfort and D. Hillier, “A Case Study of Local Food and Its Routes to Market in the UK,” British Food Journal, Vol. 106, No. 4, 2004, pp. 328-335. doi:10.1108/00070700410529582 [4] B. G. Smith, “Developing Sustainable Food Supply Chains: Philosophical Transactions of the Royal Society B,” Biological Sciences, Vol. 363, No. 1492, 2008, pp. 849-861. doi:10.1098/rstb.2007.2187 [5] V. Zajfen, “Fresh Food Distribution Models for the Greater Los Angeles Region: Barriers and Opportunities to Facilitate and Scale up the Distribution of Fresh Fruits and Vegetables,” 2010. http://departments.oxy.edu/uepi/publictions/TCE [6] S. Forsman and J. Paananen, “Local food systems: Ex- plorative findings from Finland MTT agrifood research Finland,” Economic Research, Helsinki, 2010. [7] R. Duffy, A. Fearne and V. Healing, “Reconnection in the UK food chain: Bridging the communication gap between food producers and consumers,” British Food Journal, Vol. 107, No. 1, 2005, pp. 17-33. doi:10.1108/00070700510573177 [8] H. Aronsson and M. H. Brodin, “The Environmental Im- pact of Changing Logistics Structures,” The International Journal of Logistics Management, Vol. 17, No. 3, 2006, pp. 394-415.doi:10.1108/09574090610717545 [9] E. Sandberg, “Logistics Collaboration in Supply Chains: Practice vs. Theory,” The International Journal of Logis- tics Management, Vol. 18, No. 2, 2007, pp. 274-293. doi:10.1108/09574090710816977 [10] M. Beckeman and C. Skjöldebrand, “Clusters/Networks Promote Food Innovations,” Journal of Food Engineering, Vol. 79, No. 4, 2007, pp. 418-425. doi:10.1016/j.jfoodeng.2006.04.024 [11] J. Töyli, L. Häkkinen, L. Ojala, and T. Naula, “Logistics and Financial Performance: An Analysis of 424 Finnish Small and Medium,” International Journal of Physical Distribution and Logistics Management, Vol. 38, No. 1, 2008, pp. 57-80. doi:10.1108/09600030810857210 [12] P. Engelseth, “Food Product Traceability and Supply Network Integration,” Journal of Business and Industrial Marketing, Vol. 24, No. 5, 2009, pp. 421-430. doi:10.1108/08858620910966291 [13] S. U. Randhawa and T. M. West, “An Integrated Ap- proach to Facility Location Problems,” Computers and industrial Engineering, Vol. 29, No.1-4, 1995, pp. 261 -265.doi:10.1016/0360-8352(95)00082-C [14] T. H. Oum and J. Park, “Multinational Firms’ Location Preference for Regional Distribution Centers: Focus on the Northeast Asian Region,” Transportation Research part E, Vol. 40, No. 2, 2003, pp. 101-121. doi:10.1016/S1366-5545(03)00036-X [15] M. Rönnqvist, P. Flisberg and M. Forsberg, “Optimiza- tion Based Planning Tools for Routing of Forwarders at Harvest Areas,” Canadian Journal of Forest Research, Vol. 37, No. 11, 2007, p. 11. doi: 10.1139/X07-065 [16] O. Apaydin and M. T. Gonullu, “Emission Control with Route Optimization in Solid Waste Collection Process,” Sâdhanâ, Vol. 33, No. 2, 2008, pp. 71-82. doi:10.1007/s12046-008-0007-4 [17] D. Ljungberg, G. Gebresenbet and S. Aradom, “Logistics Chain of Animal Transport and Abattoir Operations,” Biosystems Engineer ing, Vol. 96, No. 2, 2007, pp . 267-277. doi:10.1016/j.biosystemseng.2006.11.003 [18] M. Lundkvist, ”Lokal och regional mat: En studie om konsumenters, Producenters och handels inställning och erfarenhet av lokal och regional mat,” 2010. http://www.livsmedelssverige.org/regmat/litt/Lokal_ regionalmatRapporten.pdf [19] I. Heer and S. Mann, “Acting Under Spatial Restrictions: Success Factors of German Local Food Marketing Net- works,” British Food Journal, Vol. 112, No. 3, 2010, pp. 285-293. doi:10.1108/00070701011029156 [20] B. Groothedde, C. Ruijgrok and L. Tavasszy, “Towards Collaborative, Intermodal Hub Networks: A Case Study in the Fast Moving Consumer Goods Arket,” Transporta- tion Research Part E, Vol. 41, No. 6, 2005, pp. 567-583. doi:10.1016/j.tre.2005.06.005 [21] E. Brown, S. Dury and M. Holdsworth, “Motivations of Consumers that Use Local, Organic Fruit and Vegetable Box Schemes in Central England and Southern France,” Appetite, Vol. 53, No. 2, 2009, pp. 183-188. doi:10.1016/j.appet.2009.06.006  Integrated Logistics Network for the Supply Chain of Locally Produced Food, Part I: Location and Route Optimization Analyses Copyright © 2011 SciRes. JSSM 183 [22] R. S. Russell, B. W. Taylor, “Operations Management along the Supply Chain,” 6th Edition, John wiley and Sons Ltd., Chichester, 2009. [23] DPS, “Route LogiX Professional V5.0.4.39,” Distribution Planning Software Ltd., Halesowen, 2004. [24] ESRI, “ArcGIS Desktop Help,” ESRI GIS Software Cor- porate, New York, 2008. [25] M. Mikkola, “Coordinative Structures and Development of Food Supply Chains,” British Food Journal, Vol. 110, No. 2, 2008, pp. 189-205. doi:10.1108/00070700810849907 [26] D. P. Van Donk, R. Akkerman and T. Van der Vaart, “Opportunities and Realities of Supply Chain Integration: The Case of Food Manufacturers,” British Food Journal, Vol. 100, No. 2, 2008, pp. 218-235. doi:10.1108/00070700810849925 [27] C. Gimenez, “Logistics Integration Processes in the Food Industry,” International Journal of Physical Distribution and Logistics Management, Vol. 36, No. 3, 2006, pp. 231-249.doi:10.1108/09600030610661813 [28] R. Kaipia, “Coordinating Material and Information Flows with Supply Chain Planning,” The International Journal of Logistics Man ageme nt, Vo l. 20 , N o. 1, 20 0 9, pp . 144-162. doi:10.1108/09574090910954882 [29] A. Bantham and C. Oldham, “Creating Value through Traceability Solutions,” Food Origins, Illinois, 2003. [30] M. Zarei, M. B. Fakhrzad and J. M. Paghaleh, “Food Supply Chain Leanness Using a Developed QFD Model,” Journal of Food Engineering, Vol. 102, No. 1, 2011, pp. 25-33. doi:10.1016/j.jfoodeng.2010.07.026 [31] A. Osvald and L.Z. Stirn, “A Vehicle Routing Algorithm for the Distribution of Fresh Vegetables and Similar Per- ishable Food,” Journal of Food Engineering, Vol. 85, No. 2, 2008, pp. 285-295. doi:10.1016/j.jfoodeng.2007.07.008
|