 Journal of Service Science and Management, 2011, 4, 132-140 doi:10.4236/jssm.2011.42017 Published Online June 2011 (http://www.SciRP.org/journal/jssm) Copyright © 2011 SciRes. JSSM Applying Zipf’s Power Law over Population Density and Growth as Network Deployment Indicator Vagia Kyriakidou*, Christos Michalakelis, Dimitris Varoutas Department of Informatics and Telecommunications, University of Athens, Athens, Greece. Email: bkiriak@di.uoa.gr, michala@di.uoa.gr, arkas@di.uoa.gr Received February 25th, 2011; revised May 13th, 2011; accepted May 17th, 2011. ABSTRACT Population distribution analysis contains useful information regarding decision making of networks’ deployment. However, both the public and the private sector should decide the development of networks based on qualitative and quantitative criteria, such as the application of power laws. In this work, one of the most widely used power laws ap- plied in demographics, the Zipf’s law, is tested over urban cities in Greece. Apart from the examination of Zipf’s law validation over population, this study provides further results according the distribution of population density as far as an analysis based on population differentiations in the last decades. According to the results, it is proved that the con- sidered sample plays a crucial role to the final conclusions, since the acceptance or the rejection of the law depends on it. Moreover, important information regarding the deployment of networks are revealed and discussed. Keywords: Population Distribution, Zipf’s Law, Population Density, Network Deployment, Population Growth 1. Introduction Urbanization and the process of a city growth have been widely studied and questioned. Apart from important economic and political conclusions, useful information regarding telecommunications/networks development could also be drawn. For example, the deployment of telecommunications networks is usually decided after conducting business models based on estimating the po- tential users of the offered services. Thus, the analysis of population distribution and growth provides crucial in- formation to decision makers. Initial investments are the main obstacle for operators in order to provide services equally in all areas. Although, despite the increasingly demand for such services e.g. broadband, a digital divide gap between big and smaller cities is still evidence, due to the lack of the required infrastructures. The European Commission (EC) addressed the prob- lem of these inequalities and in line with its decision for an “Information Society for all” [1] subsidized a number of initiatives aiming to the deployment of telecommuni- cations networks, especially to no-metropolitan areas. The e-Europe 2005 was additionally supported by the action plan i2010 [2], which promoted the advantages of ICT technologies in economical and social aspects. The successor of this action plan is the “Digital Agenda” ini- tiative which will be completed in 2020 and aims to ex- pand ICT benefits [3]. The US government has also con- fronted the same problem and as Pigg and Clark pre- sented in [4] a number of initiatives are applied by the US Department of Agriculture, targeting to the elimina- tion of technological exclusion in rural areas. Yet, apart from the total number of population in an area, population density together with population growth should also be included in analyses regarding network development as they contain important information. On the one hand, population density could offer significant economies of scales regarding networks’ deployment. On the other hand, the rate of population growth determines the growth of potential users. The stability regarding cities’ size over long time pe- riods in developed countries was investigated among others by [5,6]. These works concluded to equal propor- tions between big and smaller cities. Henderson [7] stated that urbanization process in developing countries releases a number of political and societal challenges. Among others, population agglomeration in urban areas and the change from agriculture to a service-provided economy will raise opportunities for these countries.  Applying Zipf’s Power Law over Population Density and Growth as Network Deployment Indicator Copyright © 2011 SciRes. JSSM 133 However, it is very likely for policy makers to address income, technological and cognitive diversification be- tween big and smaller cities. These differences are caused mainly because of the distinct policy followed in some areas that favored over others. Hence, the compliance of a country’s population on specific laws provides useful information to decision makers from both the public and the private sector. The evolution of the size distribution seems to be complied with Zipf’s law in most cases [8]. According to this rule and in the case of cities size, the second largest city (rank = 2) should have half of the size of the largest one, which is ranked as first (rank = 1), the third largest city (rank = 3) should have one third of the 1st ranked city, and so on. Thus, this relation, which depends on the population and the rank of each city, can be described by the following equation: Rank PopulationConstant (1) The aim of this work is neither the examination of a new regression method for the validation of Zipf’s law nor the critic for the existing models. The paper aims to investigate the compliance of Greek urban areas with the Zipf’s law, not only in a population basis but also ac- cording to density and Δ(Population) which represents population differences among last censuses. The rest of the paper is structured as follows. In Sec- tion II the corresponding literature is reviewed and in Section III, the considered sample and the methodology of the analysis are presented. In Section III, the evalua- tion results are presented and discussed. Finally, in Sec- tion IV discussion of the results takes place, while Sec- tion V concludes the analysis and proposes additional applications. 2. Literature Review According to Zipf there is an inversely proportional rela- tionship between the frequency of words in a large cor- pus and the rank-size of these words. His suggestion is known as the “Zipf’s law” [8] and since then it has been applied to several fields of study. The Zipf’s law or the “rank-size rule” is one of the most famous rules–among linguists, economists, geographers etc., although it is not based on a clear theoretical basis [9]. Ha et al. [10] investigated the validation of the law between English and Mandarin corpora and Adamic and Huberman [11] proved that web sites’ popularity follows the Zipf’s law. Lu et al. [12] claimed that the majority of expressed genes exhibit a power law distribution similar to Zipf’s one etc.. Nowadays, the Zipf’s law and its applications have at- tracted the interest of many researchers worldwide and the factors which may affect its validation test are under investigation. According to many researchers, concentra- tion of population and urbanization are related to the Zipf’s law. Kosmopoulou [13] studied the distribution in both metro and urban areas in US cities. She concluded that metro areas comply with Zipf’s law, while urban areas tend to not follow the law, especially in recent years. Nitsch [14] claimed that the law cannot be valid for urban areas due to the evolution of the modern coun- tries and cities. In addition, an international research showed that the regression method may significantly affect the results of validation tests [15]. Furthermore, Gabaix and Ioannides [16] proposed that city size distri- bution can be better justified through dynamic models, than by Zipf’s law which belongs to power laws. Sato and Yamamoto [17] investigated the relation be- tween urbanization and demographic transition and they suggested that urbanization plays a crucial role in the process of economic development. In addition, Lucas suggested in [18] that there is a positive relationship be- tween economic development and human capital growth. Thus, public policies have been strongly influenced by the urban growth and population concentration [19]. Cunningham et al. [20] studied the network growth in mobile telephony and concluded, among others, that demographic factors affect the development of this mar- ket. Not surprisingly, population density has a positive impact on mobile demand. In addition, income and the distribution of GDP on population, e.g. income inequal- ity, are considered as driving factors regarding the adop- tion of mobile services. Moreover, Moutafides and Economides [21] showed that income is positively varied with demand for broadband services. The compliance of population under certain rules, such as the Zipf’s law, is strongly depended on the sample size [22]. For this reason, the following analysis is separated in two cases. On the one hand, urban cities with popula- tion more than 5 K inhabitants are studied and on the other hand cities with more than 10 K are included in the analysis. For both cases, the analysis is conducted with and without the two main urban areas of Greece, which are the capital city of Athens and Thessalonica. 3. The Methodology The data sample used in this analysis were drawn from the official Hellenic Statistical Authority [23], corre- spond to years 1971, 1981, 1991 and 2001 and they are the only data digitally available from corresponding censuses. Before the explanation of the exact following methodology, it must be clear that the dataset was de- fined based on cities which were characterized as urban by the National Census in 2001 (approximately ≥ 5 K inhabitants). However, a decade has almost passed from the last census and so data from 2011 are also included in 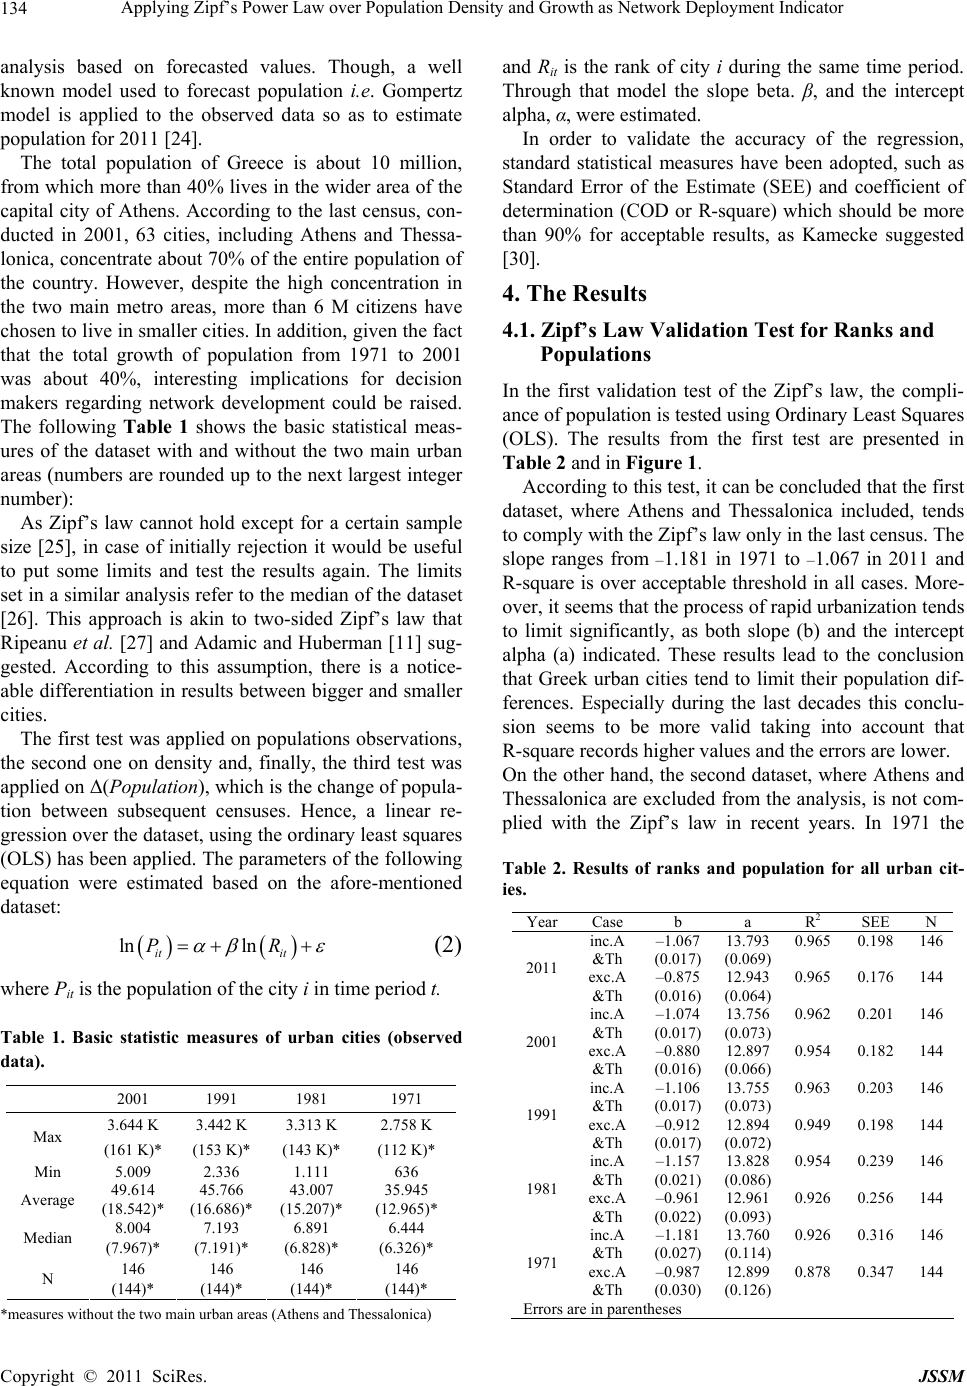 Applying Zipf’s Power Law over Population Density and Growth as Network Deployment Indicator Copyright © 2011 SciRes. JSSM 134 analysis based on forecasted values. Though, a well known model used to forecast population i.e. Gompertz model is applied to the observed data so as to estimate population for 2011 2[24]. The total population of Greece is about 10 million, from which more than 40% lives in the wider area of the capital city of Athens. According to the last census, con- ducted in 2001, 63 cities, including Athens and Thessa- lonica, concentrate about 70% of the entire population of the country. However, despite the high concentration in the two main metro areas, more than 6 M citizens have chosen to live in smaller cities. In addition, given the fact that the total growth of population from 1971 to 2001 was about 40%, interesting implications for decision makers regarding network development could be raised. The following Table 1 shows the basic statistical meas- ures of the dataset with and without the two main urban areas (numbers are rounded up to the next largest integer number): As Zipf’s law cannot hold except for a certain sample size 2[25], in case of initially rejection it would be useful to put some limits and test the results again. The limits set in a similar analysis refer to the median of the dataset 2[26]. This approach is akin to two-sided Zipf’s law that Ripeanu et al. 2[27] and Adamic and Huberman 2[11] sug- gested. According to this assumption, there is a notice- able differentiation in results between bigger and smaller cities. The first test was applied on populations observations, the second one on density and, finally, the third test was applied on Δ(Population), which is the change of popula- tion between subsequent censuses. Hence, a linear re- gression over the dataset, using the ordinary least squares (OLS) has been applied. The parameters of the following equation were estimated based on the afore-mentioned dataset: ln ln it it PR (2) where Pit is the population of the city i in time period t. Table 1. Basic statistic measures of urban cities (observed data). 2001 1991 1981 1971 3.644 K 3.442 K 3.313 K 2.758 K Max (161 K)* (153 K)*(143 K)* (112 K)* Min 5.009 2.336 1.111 636 49.614 45.766 43.007 35.945 Average (18.542)* (16.686)*(15.207)* (12.965)* 8.004 7.193 6.891 6.444 Median (7.967)* (7.191)* (6.828)* (6.326)* 146 146 146 146 N (144)* (144)* (144)* (144)* *measures without the two main urban areas (Athens and Thessalonica) and Rit is the rank of city i during the same time period. Through that model the slope beta. β, and the intercept alpha, α, were estimated. In order to validate the accuracy of the regression, standard statistical measures have been adopted, such as Standard Error of the Estimate (SEE) and coefficient of determination (COD or R-square) which should be more than 90% for acceptable results, as Kamecke suggested 2[30]. 4. The Results 4.1. Zipf’s Law Validation Test for Ranks and Populations In the first validation test of the Zipf’s law, the compli- ance of population is tested using Ordinary Least Squares (OLS). The results from the first test are presented in Table 2 and in Figure 1. According to this test, it can be concluded that the first dataset, where Athens and Thessalonica included, tends to comply with the Zipf’s law only in the last census. The slope ranges from –1.181 in 1971 to –1.067 in 2011 and R-square is over acceptable threshold in all cases. More- over, it seems that the process of rapid urbanization tends to limit significantly, as both slope (b) and the intercept alpha (a) indicated. These results lead to the conclusion that Greek urban cities tend to limit their population dif- ferences. Especially during the last decades this conclu- sion seems to be more valid taking into account that R-square records higher values and the errors are lower. On the other hand, the second dataset, where Athens and Thessalonica are excluded from the analysis, is not com- plied with the Zipf’s law in recent years. In 1971 the Table 2. Results of ranks and population for all urban cit- ies. YearCase b a R2 SEE N –1.067 13.793 0.965 0.198 146inc.A &Th (0.017)(0.069) –0.875 12.943 0.965 0.176 144 2011 exc.A &Th (0.016)(0.064) –1.074 13.756 0.962 0.201 146inc.A &Th (0.017)(0.073) –0.880 12.897 0.954 0.182 144 2001 exc.A &Th (0.016)(0.066) –1.106 13.755 0.963 0.203 146inc.A &Th (0.017)(0.073) –0.912 12.894 0.949 0.198 144 1991 exc.A &Th (0.017)(0.072) –1.157 13.828 0.954 0.239 146inc.A &Th (0.021)(0.086) –0.961 12.961 0.926 0.256 144 1981 exc.A &Th (0.022)(0.093) –1.181 13.760 0.926 0.316 146inc.A &Th (0.027)(0.114) –0.987 12.899 0.878 0.347 144 1971 exc.A &Th (0.030)(0.126) Errors are in parentheses  Applying Zipf’s Power Law over Population Density and Growth as Network Deployment Indicator Copyright © 2011 SciRes. JSSM 135 01 234 5 6 7 8 9 10 11 12 13 14 15 16 ln population (with A&Th) ln ranks ln1971 ln1981 ln1991 ln2001 ln2011 Linea r Regressio n 01 234 5 6 7 8 9 10 11 12 13 14 15 16 ln population (w/o A&Th) ln ranks ln1971 ln1981 ln1991 ln2001 ln2011 Linear Regression Figure 1. Graphs of logarithms of ranks and population with and without Athens & Thessalonica. population was distributed in line with the law. However, in 2011 the slope is not consistent with it. According to these results, it seems that the distribution of population in small urban cities tend not to follow the Zipf’s law. Thus, further analysis is provided, in order to determine the law validation over the Greek population. After separating the sample in two subsets, above and bellow 10 K inhabitants, Zipf’s law validation is tested again with the same method of OLS (Table 3and Figure 22Figure 2). The threshold of 10 K inhabitants is in line with the initiative “eEurope 2005, an information society for all”, aiming to the subsidization of deployment of fiber optical metropolitan networks in urban cities with more than 10 K inhabitants (www.infosoc.gr). According to the analysis of the results, the first sub-sets comply with the law, while the second ones give non acceptable results. More specifically, cities with more than 10 K inhabitants–including Athens and Thes- salonica seem to follow a stable population distribution. Statistical results are above threshold of acceptance and the slight increase in the intercept parameter, α, indicated the general population increase. Table 3. Results of ranks and population for urban cities with more than 10 K inhabitants. Year Caseb a R2 SEEN –1.05613.777 0.920 0.28563 inc.A &Th (0.039)(0.131) –0.70912.516 0.924 0.17961 2011 excA &Th (0.026)(0.086) –1.06013.736 0.918 0.28763 inc.A &Th (0.040)(0.134) –0.70912.462 0.928 0.17961 2001 excA &Th (0.025)(0.084) –1.06913.666 0.920 0.28763 inc.A &Th (0.040)(0.133) –0.71712.387 0.930 0.17861 1991 excA &Th (0.025)(0.084) –1.06813.583 0.912 0.30163 inc.A &Th (0.042)(0.140) –0.71212.290 0.917 0.19361 1981 excA &Th (0.027)(0.091) –1.02513.312 0.902 0.30663 inc.A &Th (0.043)(0.142) –0.66812.018 0.918 0.18161 1971 excA &Th (0.025)(0.085) Errors are in parentheses 012 34 8 9 10 11 12 13 14 15 16 ln population (>1 0K with A&Th) ln ranks ln1971 ln1981 ln1991 ln2001 ln2011 Linear Regression 01234 8 9 10 11 12 13 14 15 16 ln population (>10K w/o A&Th) ln ranks ln1971 ln1981 ln1991 ln2001 ln2011 Linear Regression Figure 2. Graphs of logarithms of ranks and population of cities with more than 10 K inhabitants. On the contrary, the estimated slopes in the second In population (with A&Th) In population (w/o A&Th) In population (>10k with A&Th) In population (>10k w/o A&Th)  Applying Zipf’s Power Law over Population Density and Growth as Network Deployment Indicator Copyright © 2011 SciRes. JSSM 136 sub-sets–excluding Athens and Thessalonica indicated an upward process caused by the significant increase of population in the considered cities. The slope, β, is con- tinuously decreased from 1971 to 1991, although in 2001 there was a slight increase. Thus, population distribution according to last census reveals smoothing tendency and though the proportion signifies Zipf’s law is strongly rejected in this case. 4.2. Zipf’s Law Validation Test using Population’s Density At this stage, a rank-size rule is applied to the whole dataset based on their population density. In 2Table 4 and in 2Figure 3 a comparison in results of both cases, with and without the two main urban areas, according to OLS method is presented. It is obvious that there is a similar- ity with previous results for all censuses. Though, in the first sub-sets where Athens and Thessalonica included in analysis, population density complied with Zipf’s law. In addition, calculated R-squares and errors boost the accu- racy of the estimated results. On the contrary, it seems that second sub-sets don’t comply with Zipf’s law as the slope is not close enough to –1. The distribution of population density in this case seems to be stable in last decades and the estimated slope indicated that there are slight differences regarding population density among cities. Though, the majority of the bigger urban cities with more than 10 K inhabitants tend to grow in a similar way in terms of their density. At a second stage, the analysis is applied in urban cit- ies with population of more than 10 K inhabitants. In this Table 4. Results of ranks and population density. Year Case b a R2 SEE N –1.031 10.732 0.939 0.229 146 inc.A &Th (0.020) (0.088) –0.827 9.572 0.921 144 2011 exc.A &Th (0.018) (0.080) –1.037 10.415 0.944 0.237 146 inc.A &Th (0.020) (0.086) –0.835 9.524 0.924 0.225 144 2001 exc.A &Th (0.019) (0.081) –1.051 10.330 0.952 0.223 146 inc.A &Th (0.019) (0.080) –0.846 9.430 0.941 0.199 144 1991 exc.A &Th (0.017) (0.072) –1.079 10.296 0.956 0.218 146 inc.A &Th (0.019) (0.078) –0.879 9.413 0.939 0.211 144 1981 exc.A &Th (0.018) (0.077) –1.073 10.120 0.963 0.198 146 inc.A &Th (0.017) (0.071) –0.876 9.254 0.951 0.188 144 1971 exc.A &Th (0.016) (0.068) Errors are in parentheses case, as Table 5 and Figure 4 show, population density complied with Zipf’s law only in the case where Athens 012345 4 5 6 7 8 9 10 11 12 13 ln population density (with A&Th) ln ranks ln1971 ln1981 ln1991 ln2001 ln2011 Linear Regression 0123 45 4 5 6 7 8 9 10 11 12 13 ln population density (w/o A&Th) ln ranks ln1971 ln1981 ln1991 ln2001 ln2011 Linear Regression Figure 3. Graphs of logarithms of ranks and population density with and without Athens and Thessalonica. Table 5. Results of ranks and population density for urban cities with more than 10 K inhabitants. Year Case b a R2 SEE N –0.983 10.283 0.893 0.33763 inc.A &Th (0.043)(0.142) –0.622 8.980 0.918 0.12161 2011 exc.A &Th (0.023)(0.078) –0.957 10.188 0.874 0.33163 inc.A &Th (0.046)(0.154) –0.580 8.826 0.951 0.11961 2001 exc.A &Th (0.017)(0.056) –0.999 10.177 0.887 0.32363 inc.A &Th (0.045)(0.150) –0.619 8.809 0.962 0.11161 1991 exc.A &Th (0.016)(0.052) –1.011 10.096 0.902 0.30263 inc.A &Th (0.042)(0.140) –0.643 8.765 0.962 0.11561 1981 exc.A &Th (0.016)(0.054) –1.018 9.964 0.911 0.28863 inc.A &Th (0.040)(0.134) –0.658 8.662 0.966 0.11261 1971 exc.A &Th (0.016)(0.052) Errors are in parentheses  Applying Zipf’s Power Law over Population Density and Growth as Network Deployment Indicator Copyright © 2011 SciRes. JSSM 137 01234 4 5 6 7 8 9 10 11 12 13 ln population density (>10K with A&Th) ln ranks ln1971 ln1981 ln1991 ln2001 ln2011 Linear Regression 01234 4 5 6 7 8 9 10 11 12 13 ln population density (>10K w/o A&Th) ln ranks ln1971 ln1981 ln1991 ln2001 ln2011 Linear Regression Figure 4. Graphs of logarithms of ranks and population density of cities with more than 10 K inhabitants. and Thessalonica included in the analysis. Although there is a slight increase in the slope from –1.018 to –0.983, in 1971 and 2011 respectively, results are to close to the expected slope of –1. On the other hand, based on the results of the other sub-sets–without Athens and Thessalonica the hypothesis of Zipf’s law validation is strongly declined. In addition, according to the estimated slope (b) and the intercept (a), it seems that differentiations of population density in urban cities are reduced significantly. Thus, network infrastructure development e.g. tele- communications network, should be carefully designed. Decision makers should take into account that in these cities the majority of potential users for telecommunica- tions services is concentrated and though the appropriate business models have to apply. The development of high-cost infrastructures, such as fiber to the home net- works, maybe should be rejected in areas where econo- mies of scales are not favored by the population density. 4.3. Zipf’s Law Validation Test for Ranks and Δ(Population) Apart from the above tests, the analysis goes ahead with Zipf’s law validation tests and exam the distribution of difference in population–Δ(Population)–among censuses. Firstly, the net difference between population is calcu- lated, then the rank-size rule is applied to these differ- ences and, finally, the Zipf’s law hypothesis is tested. The analysis is conducted for population differentiation regarding the time intervals of years 2011 to 2001, 2001 to 1991, 1991 to 1981 and 1981 to 1971. The results of the applied OLS linear regression are as presented in Table 6 and in Figure 5. Data seem not to comply with Zipf’s law as the slope, β, R-square and Standard Error of Estimate (SEE) have not acceptable values. Among the 146 examined cities 19, 27 and 22 had a population decrease in 2001, 1991 and 1981 respectively. It is estimated that in 2011 only 10 cities will decrease in terms of population. The average decrease was about 5% in all censuses (Table 7). Athens and Thessalonica had the faster population Table 6. Regression results of ranks and Δ(Population) for all urban cities. Year Case b a R2 SEEN –1.127 11.917 0.878 0.414136 inc.A &Th (0.032)(0.152) –0.989 11.102 0.798 0.395134 2011 - 2001 exc.A &Th (0.041)(0.147) –1.180 11.866 0.879 0.411127inc.A &Th (0.039)(0.155) –0.994 11.060 0.808 0.455125 2001 - 1991 exc.A &Th (0.043)(0.160) –1.223 11.754 0.860 0.463119inc.A &Th (0.045)(0.178) –1.050 11.002 0.789 0.508117 1991 - 1981 exc.A &Th (0.050)(0.197) –1.453 12.795 0.871 0.526124inc.A &Th (0.050)(0.200) –1.238 11.850 0.805 0.572122 1981 - 1971 exc.A &Th (0.055)(0.218) Errors are in parentheses 012345 0,0 0,5 1,0 1,5 2,0 proportion in % ln ranks 1981-1971 1991-1981 2001-1991 2011-2001 Linear Regression Figure 5. Proportion of population growth expressed in percentage. 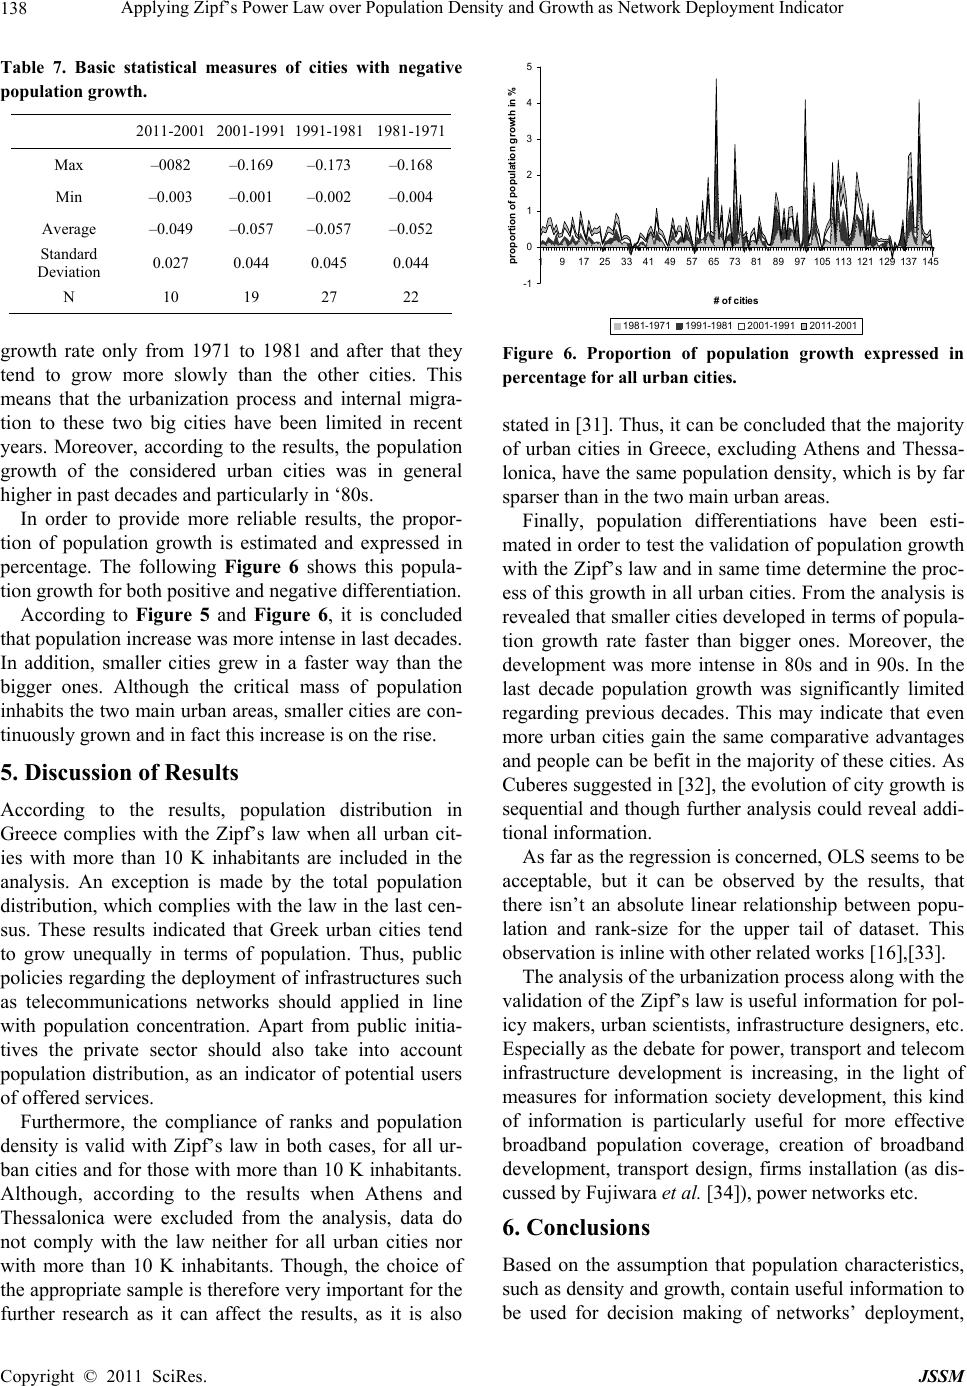 Applying Zipf’s Power Law over Population Density and Growth as Network Deployment Indicator Copyright © 2011 SciRes. JSSM 138 Table 7. Basic statistical measures of cities with negative population growth. 2011-2001 2001-1991 1991-1981 1981-1971 Max –0082 –0.169 –0.173 –0.168 Min –0.003 –0.001 –0.002 –0.004 Average –0.049 –0.057 –0.057 –0.052 Standard Deviation 0.027 0.044 0.045 0.044 N 10 19 27 22 growth rate only from 1971 to 1981 and after that they tend to grow more slowly than the other cities. This means that the urbanization process and internal migra- tion to these two big cities have been limited in recent years. Moreover, according to the results, the population growth of the considered urban cities was in general higher in past decades and particularly in ‘80s. In order to provide more reliable results, the propor- tion of population growth is estimated and expressed in percentage. The following 3Figure 6 shows this popula- tion growth for both positive and negative differentiation. According to 3Figure 5 and 3Figure 6, it is concluded that population increase was more intense in last decades. In addition, smaller cities grew in a faster way than the bigger ones. Although the critical mass of population inhabits the two main urban areas, smaller cities are con- tinuously grown and in fact this increase is on the rise. 5. Discussion of Results According to the results, population distribution in Greece complies with the Zipf’s law when all urban cit- ies with more than 10 K inhabitants are included in the analysis. An exception is made by the total population distribution, which complies with the law in the last cen- sus. These results indicated that Greek urban cities tend to grow unequally in terms of population. Thus, public policies regarding the deployment of infrastructures such as telecommunications networks should applied in line with population concentration. Apart from public initia- tives the private sector should also take into account population distribution, as an indicator of potential users of offered services. Furthermore, the compliance of ranks and population density is valid with Zipf’s law in both cases, for all ur- ban cities and for those with more than 10 K inhabitants. Although, according to the results when Athens and Thessalonica were excluded from the analysis, data do not comply with the law neither for all urban cities nor with more than 10 K inhabitants. Though, the choice of the appropriate sample is therefore very important for the further research as it can affect the results, as it is also -1 0 1 2 3 4 5 191725334149 57 6573818997105113121129137145 # of ci ti es proport ion of populat ion gr owt h in % 1981-1971 1991-1981 2001-1991 2011-2001 Figure 6. Proportion of population growth expressed in percentage for all urban cities. stated in 3[31]. Thus, it can be concluded that the majority of urban cities in Greece, excluding Athens and Thessa- lonica, have the same population density, which is by far sparser than in the two main urban areas. Finally, population differentiations have been esti- mated in order to test the validation of population growth with the Zipf’s law and in same time determine the proc- ess of this growth in all urban cities. From the analysis is revealed that smaller cities developed in terms of popula- tion growth rate faster than bigger ones. Moreover, the development was more intense in 80s and in 90s. In the last decade population growth was significantly limited regarding previous decades. This may indicate that even more urban cities gain the same comparative advantages and people can be befit in the majority of these cities. As Cuberes suggested in 3[32], the evolution of city growth is sequential and though further analysis could reveal addi- tional information. As far as the regression is concerned, OLS seems to be acceptable, but it can be observed by the results, that there isn’t an absolute linear relationship between popu- lation and rank-size for the upper tail of dataset. This observation is inline with other related works 3[16],3[33]. The analysis of the urbanization process along with the validation of the Zipf’s law is useful information for pol- icy makers, urban scientists, infrastructure designers, etc. Especially as the debate for power, transport and telecom infrastructure development is increasing, in the light of measures for information society development, this kind of information is particularly useful for more effective broadband population coverage, creation of broadband development, transport design, firms installation (as dis- cussed by Fujiwara et al. 3[34]), power networks etc. 6. Conclusions Based on the assumption that population characteristics, such as density and growth, contain useful information to be used for decision making of networks’ deployment,  Applying Zipf’s Power Law over Population Density and Growth as Network Deployment Indicator Copyright © 2011 SciRes. JSSM 139 the present work evaluated the application of Zipf’s power law over urban cities in Greece. The purpose was the provision of qualitative and quantitative criteria, to both the public and the private sector, in order to decide the development of networks. Results indicated that public policies regarding the de- ployment of infrastructures such as telecommunications networks should applied in line with population concen- tration, not only in terms of public initiatives but from the private sector as well. The private sector should take into account the examined characteristics of the popula- tion, in order to estimate the future demand for the of- fered services and develop the appropriate infrastructures, thus avoiding over or undersupply. Apart from this, the study provides additional results, according to the distribution of population density and population differentiations during the last decades. It is proved that the considered sample plays a crucial role to the final conclusions, since the acceptance or the rejec- tion of the law depends on it. Moreover, important in- formation regarding the deployment of networks are re- vealed and discussed. The approach described in this work can be used as a driver and an input for the construction of strategic plans regarding the deployment of telecommunication or simi- lar type networks. REFERENCES [1] European Commission, “e-Europe 2005, an Information Society for All,” European Information Society, 2003. [2] European Commission, “i2010 - A European Information Society for growth and employment,” European Informa- tion Society, 2005. [3] European Commission, “Digital Agenda,” European In- formation Society, 2010. [4] K. Pigg and L. Crank, “Do Information and Communica- tion Technologies Promote Rural Economic Develop- ment?” Journal of the Community Development Society, Vol. 36, No. 1, 2005, pp. 65-76. 3Udoi:10.1080/15575330509489872 [5] Y. M. Ioannides and H. G. Overman, “Zipf’s Law for Cities: An Empirical Examination,” Regional Science and Urban Economics, Vol. 33, No. 2, 2003, pp. 127-137. 4Udoi:10.1016/S0166-0462(02)00006-6 [6] D. Black and J. V. Henderson, “Urban Evolution in the USA,” Journal of Economic Geography, Vol. 3, No. 4, 2003, pp. 343-373. 5Udoi:10.1093/j eg /lbg017 [7] J. V. Henderson, “Cities and Development,” Journal of Regional Science, Vol. 50, No. 1, 2010, pp. 515-540. 6Udoi:10.1111/j.1467-9787.2009.00636.x [8] G. K. Zip’f, “Human Behavior and the Principle of Least Effort,” Addison-Wesley Press, Cambridge, 1949. [9] K. Krugman, “Development, Geography, and Economic Theory,” MIT Press, Cambridge, 1995. [10] L. K. Ha, E. I. Sicilia-Garcia, J. Ming and F. J. Smith, “Extension of Zipf’s Law to Words and Phrases,” Coling 2002: Proceedings of the 19th International Conference on Computational Linguistics, Taipei, 26-30 August 2002 pp. 315-320. [11] L. A. Adamic and B. A. Huberman, “Zipf’s Law and the Internet,” Glottometrics, Vol. 3, 2002, pp. 143-150. [12] T. Lu, M. C. Costello, P. Groucher, R. Häsler, G. Deuschl and S. Schreiber, “Can Zipf’s Law be Adapted to Nor- malize Microarrays?” BMC Bioinformatics, Vol. 6, 2005, p. 37. 7Udoi:10.1186/1471-2105-6-37 [13] G. Kosmopoulou, N. Buttry, J. Johnson, et al., “Sub-ur- banization and the Rank-Size Rule,” Applied Economics Letters, Vol. 14, No. 1, 2007, pp. 1-4. 8Udoi:10.1080/13504850500425675 [14] V. Nitsch, “Zipf Zipped,” Journal of Urban Economics, Vol. 57, No. 1, 2005, pp. 86-100. 9Udoi:10.1016/j.jue.2004.09.002 [15] K. T. Soo, “Zipf’s Law for Cities: A Cross-Country In- vestigation,” Regional Science and Urban Economics, Vol. 35, No. 3, 2005, pp. 239-263. 1Udoi:10.1016/j.regsciurbeco.2004.04.004 [16] X. Gabaix and Y. M. Ioannides, “The Evolution of City Size Distributions,” Vol. 4, In: J. V. Henderson and J. F. Thisse, Eds., Handbook of Regional and Urban Econom- ics, Elsevier, London, 2004, pp. 2341-2378. [17] Y. Sato and K. Yamamoto, “Population Concentration, Urbanization, and Demographic Transition,” Journal of Urban Economics, Vol. 58, No. 1, 2005, pp. 45-61. 1Udoi:10.1016/j.jue.2005.01.004 [18] R. E. Lucas, “On the Mechanics of Economic Develop- ment,” Journal of Monetary Economics, Vol. 22, No. 1, 1988, pp. 3-42. 1Udoi:10.1016/0304-3932(88)90168-7 [19] K. Head and T. Mayer, “The Empirics of Agglomeration and Trade,” Cities and Geography: North-Holland, Am- sterdam, 2004. [20] M. B. Cunningham, J. P. Alexander and A. Candeub, “Network Growth: Theory and Evidence from the Mobile Telephone Industry,” Information Economics and Policy, Vol. 22, No. 1, 2010, pp. 91-102. 1Udoi:10.1016/j.infoecopol.2009.11.005 [21] G. M. Moutafides and A. A. Economides, “Demand for Broadband Access in Greece,” Telematics and Informat- ics, Vol. 28, No. 2, 2011, pp. 125-141. 1Udoi:10.1016/j.tele.2010.10.003 [22] F. Guérin-Pace, “Rank-Size Distribution and the Process of Urban Growth,” Urban Studies, Vol. 32, No. 3, 1995, pp. 551-562. 1Udoi:10.1080/00420989550012960 [23] Hellenic Statistical Authority (El.Stat), 2010. http://statistics.gr/portal/page/portal/ESYE. [24] B. Gompertz, “On the Nature of the Function Expressing of the Law of Human Mortality,” Philosophical Transac- tions of the Royal Society, Vol. 36, 1825, pp. 513-585. [25] C. Urzúa, “A Simple and Efficient Test for Zipf’s Law,” Economics Letters, Vol. 66, 2000, pp. 257-260.  Applying Zipf’s Power Law over Population Density and Growth as Network Deployment Indicator Copyright © 2011 SciRes. JSSM 140 [26] R. Kali, “The City as a Giant Component: A Random Graph Approach to Zipf’s Law,” Applied Economics Let- ters, Vol. 10, No. 11, 2003, pp. 717-720. 1Udoi:10.1080/1350485032000139006 [27] M. Ripeanu, I. Foster and A. Iamnitchi, “Mapping the Gnutella Network: Properties of Large-Scale Peer-to-Peer Systems and Implications for System Design,” IEEE Internet Computing Journal Special Issue on Peer-to-Peer Networking, Vol. 6, 2002, pp. 50-57. [28] “Special Issue on Peer-To-Peer Networking,” Internet Computing Journal, Vol. 6, 2002, pp. 50-57. [29] “Systems and Implications for System Design,” IEEE Internet Computing Journal, Vol. 6, 2002, pp. 50-57. [30] U. Kamecke, “Testing the Rank-Size Rule Hypothesis with an Efficient Estimator,” Journal of Urban Econom- ics, Vol. 27, No. 2, 1990, pp. 222-231. 1Udoi:10.1016/0094-1190(90)90016-G [31] T. K. Rosen and M. Resnick, “The Size Distribution of Cities: An Examination of the Pareto Law and Primacy,” Journal of Urban Economics, Vol. 8, No. 2, 1980, pp. 165-186. 1Udoi:10.1016/0094-1190(80)90043-1 [32] D. Cuberes, “Sequential city growth: Empirical evi- dence,” Journal of Urban Economics, Vol. 69, No. 2, 2011, pp. 229-239. 1Udoi:10.1016/j.jue.2010.10.002 [33] L. Ellis and D. Andrews, “City Sizes, Housing Costs, and Wealth,” Research Discussion Paper, Economic Research Department: Reserve Bank of Australia, 2001. [34] Y. Fujiwara, C. Di Guilmi, H. Aoyama, M. Gallegati and W. Souma, “Do Pareto-Zipf and Gibrat Laws Hold True? An Analysis with European Firms,” Physica A, Vol. 335, No. 1-2, 2004, pp. 197-216. 2Udoi:10.1016/j.physa.2003.12.015H
|