Paper Menu >>
Journal Menu >>
 Wireless Sensor Network, 2009, 2, 61-121 doi:10.4236/wsn.2009.12011 lished Online July 2009 (http://www.SciRP.org/journal/wsn/). Copyright © 2009 SciRes. Wireless Sensor Network, 2009, 2, 61-121 Pub On the Performance of Blind Chip Rate Estimation in Multi-Rate CDMA Transmissions Using Multi-Rate Sampling in Slow Flat Fading Channels Siavash GHAVAMI, Bahman ABOLHASSANI School of Electrical Engineerin g, Iran University of Science and Technology, Tehran, Iran Email: sghavami@ee.iust.ac.ir, abolhassani@iust.ac.ir Received March 7, 2009; revised March 19, 2009; accepted March 20, 2009 Abstract This paper considers blind chip rate estimation of DS-SS signals in multi-rate and multi-user DS-CDMA systems over channels having slow flat Rayleigh fading plus additive white Gaussian noise. Channel impulse response is estimated by a subspace method, and then the chip rate of each signal is estimated using zero crossing of estim ated differential channel i mpulse response. For chip rate estim ation of each user, an algorithm which uses weighted zero-crossing ratio is propos ed. Maximum value of the weighted zero cros sing ratio takes place in the Nyquis t rate sam pling frequen cy, which equ als to the twice of the chip rate. Furth ermor e, bit time of each user is estimated using fluctuations of autocorrelation estimators. Since code length of each user can be obtained using bit time and chip time ratio. Fading channels reduce reliability factor of the proposed algo- rithm. To overcome this problem, a receiver with multiple antennas is proposed, and the reliability factor of the proposed algorithm is analyzed over both spatially correlated and independent fading channels. Keywords: Multi-Rate Sampling, Chip Time, Multi-Rate CDMA, Blind Estimation 1. Introduction Direct-sequence code division multiple accesses (DS- CDMA) systems are nowadays of increasing importance in wireless cellular communications because of their in- clusion in most of the proposals about both terrestrial and satellite based standards for third-generation (3G) wire- less networks [1,2]. On the other hand, direct sequence spread spectrum (DS-SS) signals are well-known and are used in secure communication for their low probability of interception, their statistics are similar to those of noise; furthermore, they are usually transmitted below the noise level. One of the salient features of 3G cellular systems is the capability of supporting transmission data as diverse as voice, packet data, low-resolution video, and com- pressed audio. Since these heterogeneous services pro- duce digital information streams with differen t da ta rates, their implementation requires the use of multi-rate CDMA systems where each user may transmit his data at one among a set of available data rates. An easy way to view the multi-rate CDMA transmission is to consider the variable spreading length (VSL) technique where all users employ sequences with the same chip period; moreover, the data rate is tied to the length of the spreading code of each user. Another way to view a multi-rate CDMA transmission is to consider a constant spreading length where users employ sequences with different chip periods. In general, chip time and spread- ing sequence l e n gth of users can be sel ec t ed variable. Two recent systems are often applied in military sys- tems based on spread spectrum. In the literature, differ- ent methods have been presented for chip time estima- tion, many number of those methods are based on cyclic cumulant method, which have been presented in litera-  S. GHAVAMI ET AL.69 Copyright © 2009 SciRes. Wireless Sensor Network, 2009, 2, 61-121 tures [3-7]. Cyclic cumulant method in multi-rate and multi-user system doesn’t exhibit good performance be- cause cyclic frequencies of different users overlap and chip time estimation of different users is difficult. In [8] we proposed a blind chip time estimation algorithm based on multi-rate signal processing. In this paper, blind chip time estimation technique is considered, which is based on channel impulse response estimation using singular value decomposition of esti- mated received signal covariance matrix. For spreading sequence estimation in slow flat Rayleigh fading channel plus additive white Gaussian noise (AWGN), length of code must be determined. Bit time and chip time must be estimated, for length of code estimation. In the proposed method in this paper, chip time is determined using multi-rate sampling of channel impulse response. Maxi- mum number of zero crossing in differential of channel impulse response take places in sampling frequency twice of the chip rate. Therefore, number of zero cross- ing is obtained as a function of sampling rate. Then bit time is determined using fluctuations of correlation esti- mator. Code length of each user is determined using their corresponding chip times and bit times. Finally, per- formance of the proposed method is analyzed in fading channels and a receiver with multiple antennas is pro- posed for performance improvement in fading channels. Estimated parameter using this method is useful and ap- plicable in noted systems in pervious paragraph in very low signal to noise ratio (SNR) (negative SNR in dB). This needs no prior knowledge about transmitter in the receiver side; it is typically the case in blind signals in- terception in the military field or in spectrum surveil- lance. The remaining of this paper is organized as follows. In Section 2, System model are introduced. In Section 3, subspace methods for channel impulse response estima- tion are reviewed. Section 4 proposed blind chip time estimation based on multi-rate sampling. Blind bit time estimation is considered in Section 5. In Section 6, the performance of the proposed chip rate estimation algo- rithm will be analyzed over spatially correlated and non correlated flat fading channels. Simulation results are expressed in Section 7. Finally conclusions are per- formed in Section 8. 2. System Model We consider the down link scenario of a multi-rate DS-CDMA network. The base station transmits signals and a mobile station receives a combined signal of K active users, which is given by ,, 11 ()[ ]()(), i i K S kk kis ki ikj rtAd jhtjTnt (1) where k A , , , [] k dj () k ht i s T and ,ki are the receiv- ed amplitude, jth data symbol, convolution of channel impulse response and spreading sequence waveform, symbol time and delay of kth user in ith rate respectively. Also, Ki is number of active users in ith rate, S is the number of available rates, and is additive white Gaussian noise. In the down link scenario, (nt) ,ki s are equal, and the is expressed by ,ki h()t 1 1/2 ,, 0 ()( ) i i L kiiki ic j ht LcptjT (2) where is the spreading sequence length, i Li c T i s i TL is the chip time of ith rate, is explained in the next paragraph, is the value of the mth chip and ith rate with () i pt ,[] ki cm ,ki cm[] 1. Data symbols of [] k dj different users have independent identically distributions (i.i.d.). In this paper, channel model is considered slow flat Rayleigh fading plus AWGN. We assume that the channel in the duration of one processing window re- mains approximately constant. In (2), is the total channel impulse response of the kth user in ith rate, it is convolution of the transmitter filter , channel filter () i pt )(et () s tand receiver filter() g t i.e. ()()()* () i ptetstgt (3) where these filters have unit energy. () ()()k j t k st te ()t , k s have Rayleigh distribution and k s have uniform distribution, * operation denotes convolution operation. We assume that 1) Channel model is slow flat Rayleigh fading plus AWGN. 2) Signal power is lower than noise power (SNR < 0 in dB). 3) A symbol time is equal to the spreading sequence length, i.e. ii cs TTL i (i.e. short spreading code). 4) Symbols have zero mean and are uncorrelated. 3. Estimation of Channel Impulse Response Covariance matrix of the received signal can be written as HHH rx EEE RrrxxnnR n R (4) where r is vector of received signal, x is vector of re- ceived signal when noise is absent , H denotes hermitian operation, and n is vector of additive white Gaussian  S. GHAVAMI ET AL. 70 Copyright © 2009 SciRes. Wireless Sensor Network, 2009, 2, 61-121 noise. Furthermore, x R andn show covariance ma- trix of the received signal when no ise is absent and noise covariance matrix, respectively. Covariance matrix of the received signal can be written as [9] R 1 200*11 0(1)()( ) K nkkkkkk k k R vvv vI * (5) where, 2 n is noise variance, kk T , , 2 ki ksig T 2 ni s T , in which is power of signal of kth user in ith rate. and are normalized eigenvector of the estimated covariance matrix of received signal, they correspond to kth asynchronous user in ith rate, is the sampling period, and is the identity matrix. , 2 ki sig 1 k v I 0 k v T In the downlink scenario, when signal of one user are synchronized all user are synchronized (k s =0) and covariance matrix of the received signal is given by 1 2 1 * { K nkkk k R vv I} (6) 4. Blind Chip Rate Estimation In singular value decomposition of the received signal covariance matrix, if the chip rate is less than half of the sampling frequency, estimated eigenvector of the re- ceived signal covariance matrix (corresponds to maxi- mum eigenvalue) is the convolution of , ()et () s t, () g t and spreading sequence of synchronized user. If the impulse response of transmitter and receiver filters have been assumed ideal, and channel is constant in the duration of one processing window, estimated eigenvec- tor will be the multiplication of spreading sequence of synchronized user in constant value. Hence for estimat- ing spreading sequence from estimated impulse response of channel by subspace method i.e., ch ip rate must be known exactly. k v Sampling ratio is defined as s c F mR (7) The total impulse response of the channel related to each user, (2), can be written as follows c ,, 0 ()( ). i mL m ki ki j T ht cptj m (8) If the sampling frequency is known, by estimation using eigenvector of synchronized signal and relation between sampling time and chip time (i.e. ,() ki ht ec TTm ), we can obtain chip rate of the signal. Hence we focus on the estimation of sampling ratio (SR). First, we calculate sign of to obtain the nor- malized spreading sequence, it is performed due to bi- nary phase shift keying (BPSK) spreading assumption of transmit signal. Sign of is given by ,() ki ht t ,() ki h cc ,, 0 sgn(( ))((1))() i mL m ki ki j TT htcutjutj mm (9) where is the unit step function. Then, the differen- tial of is calculated with respect to t to es- timate the number of zero crossings of the spreading se- quence, which is given by ()ut sgn( ,( )) ki ht ,1/2 c , 0 sgn(( ))[]() i mL m ki ki j dht T Ncmtj dt m (10) , sgn(()) ki dhtdt includes impulse sequences by zero crossings at times c tjTm . It is obvious that in sam- pling frequencies greater than the Nyquist rate, by in- creasing the sampling frequency, number of zero cross- ings on differential of spreading sequence remains con- stant. Figure 1(a) shows a sequence with length of 63, and Figure 1(b) shows the same sequence with the SR of 4. Figure 1(c) shows the differential of the sequence shown in Figure 1(a) and Figure 1(d) is similar to Figu re 1(c) for differential of sequence which has been shown in Figure 1(b). It can be seen in this figure, the number of zero crossings remains constant in differential of each sequence by over sampling greater than the Nyquist rate. Figure 2(a) shows the number of zero crossings of the differential of sequence in terms of different sampling frequencies. Bandwidth of signal is considered 10 MHz and it can be seen the number of zero crossings remains constant for sampling frequency greater than 20 MHz. Zero crossing ratio is defined as the following Number of zero crossings Length of diffre ntiate d Sequence ZCR (11) Figure 2(b) shows the number of zero crossings ratio of the differential sequence in terms of sampling fre- quency. It is obvious that for sampling frequencies greater than the Nyquist rate, Z CR reduces by increas- ing the sampling frequency and the maximum value of ZCR occurs at the sampling frequency equal to the chip rate of the sequence (i.e. length of 63). But for sampling frequencies less than the Nyquist rate, for loss of some data samples and decreasing length of differential  S. GHAVAMI ET AL.71 Copyright © 2009 SciRes. Wireless Sensor Network, 2009, 2, 61-121 Figure 1. (a) Spreading sequence (length of 63). (b) Over sampled spreading sequence (length of 63) and SR = 4. (c) Differential of Spreading sequence (length of 63). (d) Dif- ferential of Over sampled spreading sequence (length of 63) and SR = 4. sequence, ZCR may be greater than ZCR corresponding to the Nyquist rate. In Figure 2(b) an example of this situation can be seen. Sampling frequencies less than Nyquist rate losses some of data samples and decrease length of differential of sequence, it causes ZCR in- creases for sampling frequency lower than the Nyquist rate. Since, by weighting ZCR, it is possible to reduce ZCR for sampling frequencies less than the Nyquist rate. Therefore, we propose weighted zero crossing ratio, which is defined as The Number of zero crossingsWZCR ZCR (12) Figure 2(c) shows weighted zero crossing ratio in terms of frequency sampling, it can be seen the maxi- mum of WZCR corresponds to the sampling frequency is equal to the chip rate. Figure 2. (a) Number of Zero crossing in terms of sampling frequency in MHz. (b) Zero crossing ratio in terms of sam- pling frequency. (c) Weighted zero crossing ratio in terms of sampling frequency. Increasing the code length increases the computational complexity of subspace decomposition of the received signal covariance matrix due to increasing the dimension of covariance matrix, instead, output SNR in output of covariance matrix estimator increases by the factor of 21 NN, as, 2 1 2 1 out out SNR N NSNR (13) where and are spreading sequence lengths corresponds to and , respectively. Therefore by increasing code length it is possible to es- timate spreading sequence of active users in lower SNR values. 2 N1 N SNR 2 out 1 out SNR 5. Blind Bit Rate Estimation For blind bit rate estimation, we use fluctuation of corre- lation estimator [10]. To compute the fluctuations, we divide the received signal into M temporal windows with duration of TF for each window. Then, a correlation es- timator is applied to each window prior to the computa- tion. For the mth window, an estimation of the autocorre- lation for any signal r(t) is given by * 0 1 ˆ()() () F T m rmm F Rrtrt Tdt (14) where is the signal sample over the mth window. Replacing in (14) with the mth window of , and taking expectation of () m rt m r()t()rt ˆ() m r R for M windows, lead to the following equation, which can be used for both the uplink (asynchronous user) and downlink (synchronous) transmission, ˆˆˆ ()()() rsn RRR (15) where ˆ() n R is autocorrelation of noise and , 1 00 ˆ () (). i ki K S s ik RR s (16) In (16), , ˆ() ki s R is the noise-unaffected estimation of the autocorrelation for the (k, i)th signal. Indeed, since the fluctuations are computed from many ran- domly-selected windows, th ey do not depend on th e rela- tive delays of signals. The use of M windows allows us to estimate the second-order moment of the estimated correlation ˆ() m r R as 1 22 0 1 ˆˆ ˆ () ()() M r m ER R Mr (17)  S. GHAVAMI ET AL. 72 Copyright © 2009 SciRes. Wireless Sensor Network, 2009, 2, 61-121 where is the estimated expectation of ˆ E() . Hence, () is a measure of the fluctuations of ˆ( m r R) . The difference between the successive and equal amplitude peaks in (16) determines symbol time for each rate [10]. 6. Performance of the Proposed Chip Rate Estimation Algorithm In the proposed chip rate estimation algorithm, if the eavesdropping receiver fallen in the deep fading; the estimated chip rate is not valid. In this section, effect of fading channel is analyzed on the performance of the proposed chip rate estimation algorithm. This analysis is first done for a receiver using a single antenna. Second, the analysis is done for a receiver using multiple anten- nas to overcome fading. The threshold value of SNR for chip rate estimation algorithm is defined as , which is the minimum SNR for achieving a reliability factor (RF) of chip rate estimation greater than 0.99. is obtained using computer simulation in non-fading channels and its value depends di r ec t ly on the sprea d ing factor. min SNR min SNR By assuming Rayleigh distribution for the channel, the probability that the received signal voltage r is less than a given the threshold R, which is corresponding value of , found from the following equation min SNR 2 0 Pr( )1exp() R rR prdr (18) where is the probability density function (PDF) of the Rayleigh distribution , and ()pr rms RR is the value of the specified level R, normalized to the local rms ampli- tude of the fading duration envelope, hence 2min SNR SNR SNR . The chip rate estimation algorithm is failed, when in M processing blocks of signal is less than . SNR min So, the for AWGN channels is ch anged to d P 2 1Prexp(). fading RFRFr RRF (19) From the above equation, it is obvious that the reli- ability factor of chip rate estimation algorithm reduces by the factor of 2 exp( ) when all M processing win- dows have be en faded. Table 1 shows the for achieveing a greater than 0.99 in terms of spreading factor (SF) over AWGN channels. These results are extracted using computer simulations. It can be seen, by 3 dB increase in SF, the increases by 3 dB. min SNR RF min SNR Table 1. min S NR for achieving a R F greater than 0.99 in terms of SF over AWGN channels. SF [dB] 15 18 21 24 27 30 min SNR [dB] -5 -8 -11 -14 -17-20 Figure 3. in terms of received SNR for different values of SF. fading RF Figure 3 shows in terms of SNR in flat fading channels with Rayleigh distribution for different values of SF. It can be seen that the is greater than 0.95 for SNR = 8 dB in SF = 15 dB. It is obvious that the performance of the proposed algorithm degraded 13 dB with respect to that of AWGN channels. RF RF Now, we propose a solution to overcome effect of fading channels on the performance of the proposed al- gorithm. If the distance between two neighboring anten- nas in eavesdropping receiver is large enough and com- munication environment is rich scattering, fading chan- nels experienced by these antennas are independent. So, the reliability factor of the proposed chip rate estimation algorithm improves. So that 1Pr, m L fading RFRFr R (20) where denotes reliability factor of the proposed chip rate estimation algorithm with L receiving antennas in eavesdropping receivers over independent fading channels. Figure 4 shows in terms of SNR for spreading factor of 15 dB and different numbers for re- ceiving antennas in eavesdropping receiver. It can be seen from this Figure that by increasing the number of receiving antennas from 1 to 4, increases from 0.53 to 0.95 at SNR = -3 dB. m fading RF m fading RF RF m fading In practice, assuming independent channel gains for receiving antennas is not realistic due to limitation size 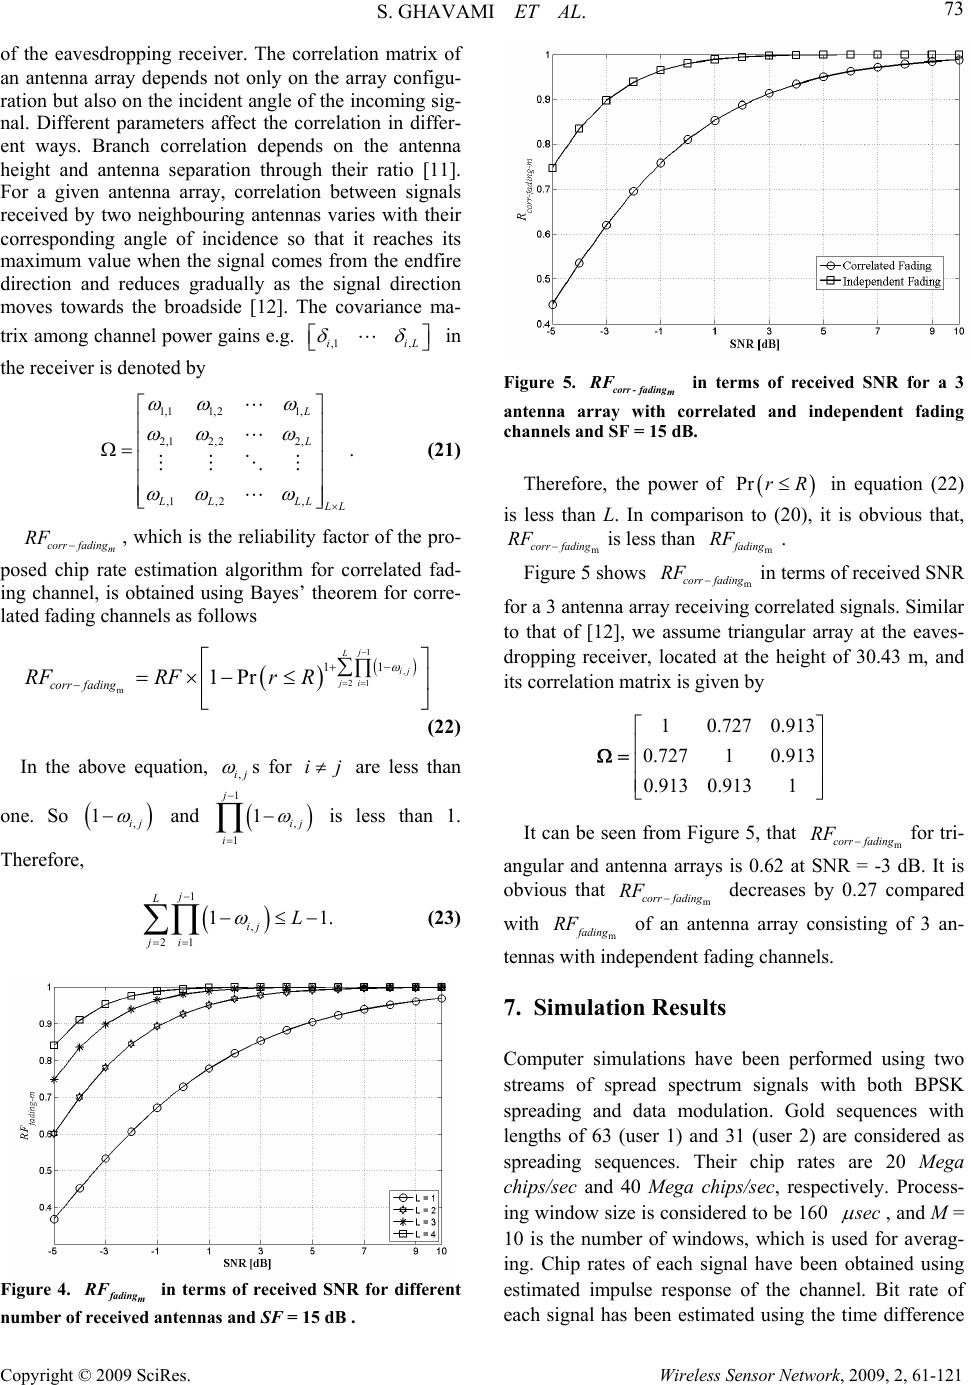 S. GHAVAMI ET AL.73 Copyright © 2009 SciRes. Wireless Sensor Network, 2009, 2, 61-121 L of the eavesdropping receiver. The correlation matrix of an antenna array depends not only on the array configu- ration but also on the incident angle of the incoming sig- nal. Different parameters affect the correlation in differ- ent ways. Branch correlation depends on the antenna height and antenna separation through their ratio [11]. For a given antenna array, correlation between signals received by two neighbouring antennas varies with their corresponding angle of incidence so that it reaches its maximum value when the signal comes from the endfire direction and reduces gradually as the signal direction moves towards the broadside [12]. The covariance ma- trix among channel power gains e.g. in the receiver is denoted by ,1 ,ii 1,1 1,21, 2,1 2,22, ,1 ,2, . L L LL LL L L (21) m corr fading RF , which is the reliability factor of the pro- posed chip rate estimation algorithm for correlated fad- ing channel, is obtained using Bayes’ theorem for corre- lated fading channels as follows 1 , 21 m 11 1Pr j L ij ji corr fading RFRFr R (22) In the above equation, ,ij s for are less than one. So and is less than 1. Therefore, ij ij 1 1. ,ij , 1 1 1 j i 1 , 21 1 j L ij ji L (23) Figure 4. in terms of received SNR for different number of received antennas and SF = 15 dB . m fading RF Figure 5. in terms of received SNR for a 3 antenna array with correlated and independent fading channels and SF = 15 dB. m corr -fading RF Therefore, the power of in equation (22) is less than L. In comparison to (20), it is obvious that, is less than . Pr rR m fading m corr fading RF RF Figure 5 shows in terms of received SNR for a 3 antenna array receiving correlated signals. Similar to that of [12], we assume triangular array at the eaves- dropping receiver, located at the height of 30.43 m, and its correlation matrix is given by m corr fading RF 10.727 0.913 0.727 1 0.913 0.9130.9131 It can be seen from Figure 5, that for tri- angular and antenna arrays is 0.62 at SNR = -3 dB. It is obvious that decreases by 0.27 compared with of an antenna array consisting of 3 an- tennas with independent fading channels. m corr fading RF m corr fading RF m fading RF 7. Simulation Results Computer simulations have been performed using two streams of spread spectrum signals with both BPSK spreading and data modulation. Gold sequences with lengths of 63 (user 1) and 31 (user 2) are considered as spreading sequences. Their chip rates are 20 Mega chips/sec and 40 Mega chips/sec, respectively. Process- ing window size is considered to be 160 s ec , and M = 10 is the number of windows, which is used for averag- ing. Chip rates of each signal have been obtained using estimated impulse response of the channel. Bit rate of each signal has been estimated using the time difference 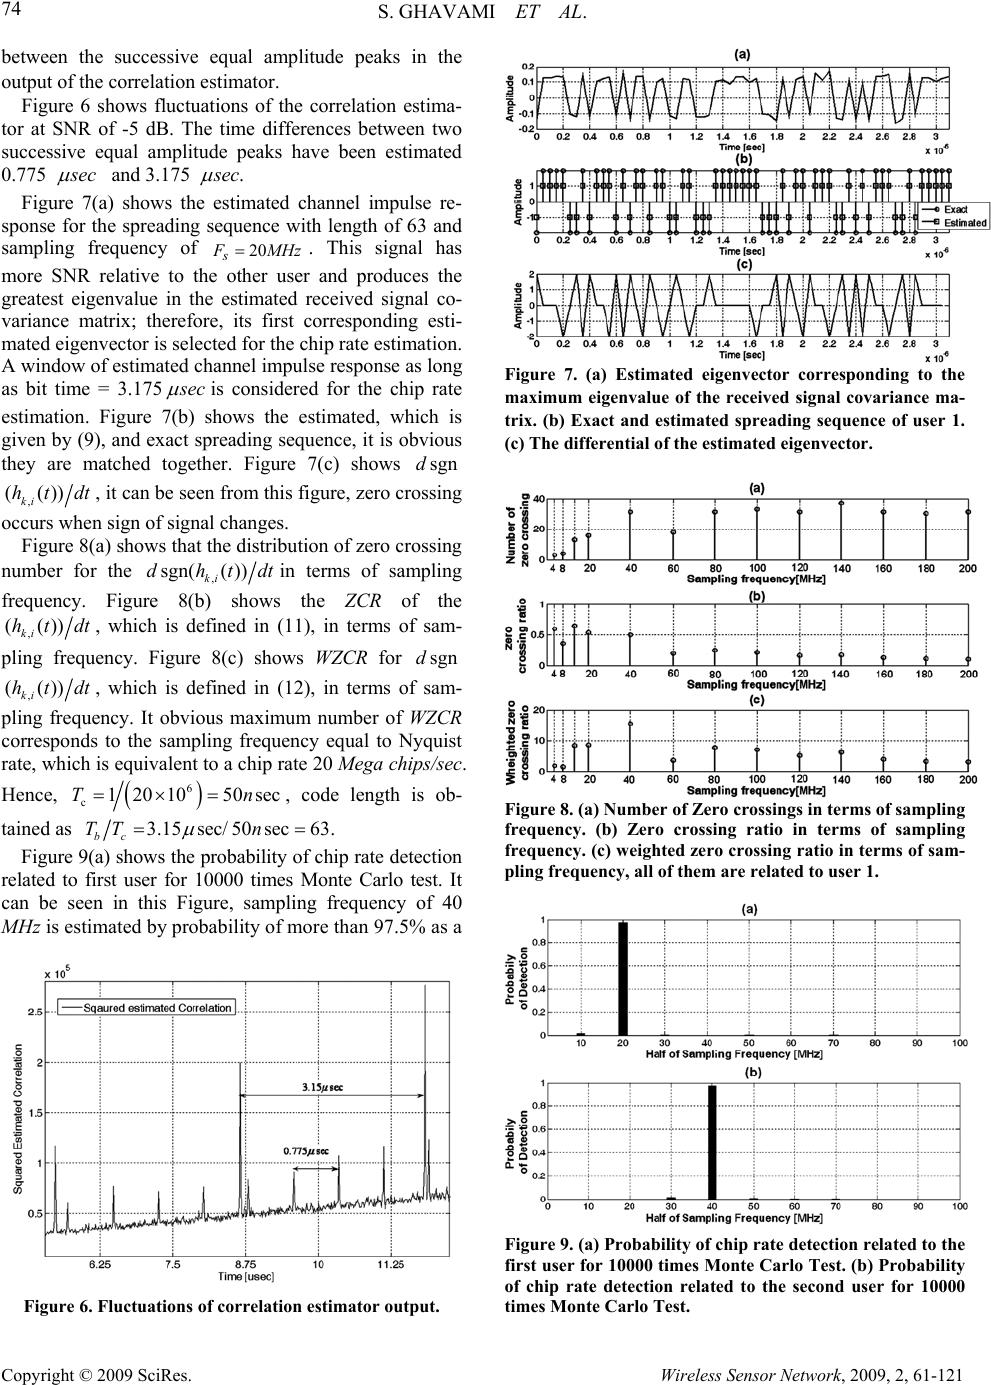 S. GHAVAMI ET AL. 74 Copyright © 2009 SciRes. Wireless Sensor Network, 2009, 2, 61-121 between the successive equal amplitude peaks in the output of the correlation estimator. Figure 6 shows fluctuations of the correlation estima- tor at SNR of -5 dB. The time differences between two successive equal amplitude peaks have been estimated 0.775 s ec and 3.175 s ec . Figure 7(a) shows the estimated channel impulse re- sponse for the spreading sequence with length of 63 and sampling frequency of 20 s F MHz. This signal has more SNR relative to the other user and produces the greatest eigenvalue in the estimated received signal co- variance matrix; therefore, its first corresponding esti- mated eigenvector is selected for the chip rate estimation. A window of estimated channel impulse response as long as bit time = 3.175 s ec is considered for the chip rate estimation. Figure 7(b) shows the estimated, which is given by (9), and exact spreading sequence, it is obvious they are matched together. Figure 7(c) shows sgnd , (()) ki htdt , it can be seen from this figure, zero crossing occurs when sign of signal changes. Figure 8(a) shows that th e distribu tion of zero cro ssing number for the , sgn(( )) ki dhtdtin terms of sampling frequency. Figure 8(b) shows the ZCR of the , (()) ki htdt, which is defined in (11), in terms of sam- pling frequency. Figure 8(c) shows WZCR for sgnd , (()) ki htdt, which is defined in (12), in terms of sam- pling frequency. It obvious maximum number of WZCR corresponds to the sampling frequency equal to Nyquist rate, which is equivalent to a chip rate 20 Mega chips/sec. Hence, 6 c12010 50secTn, code length is ob- tained as 3.15sec/50sec63 bc TT n . Figure 9(a) shows the probability of chip rate detection related to first user for 10000 times Monte Carlo test. It can be seen in this Figure, sampling frequency of 40 MHz is estimated by probability of more than 97.5% as a Figure 6. Fluctuations of correlation estimator output. Figure 7. (a) Estimated eigenvector corresponding to the maximum eigenvalue of the received signal covariance ma- trix. (b) Exact and estimated spreading sequence of user 1. (c) The differential of the estimated eigenvector. Figure 8. (a) Number of Zero crossings in terms of sampling frequency. (b) Zero crossing ratio in terms of sampling frequency. (c) weighted zero crossing ratio in terms of sam- pling frequency, all of them are related to user 1. Figure 9. (a) Probability of chip rate detection related to the first user for 10000 times Monte Carlo Test. (b) Probability of chip rate detection related to the second user for 10000 times Monte Carlo Test. 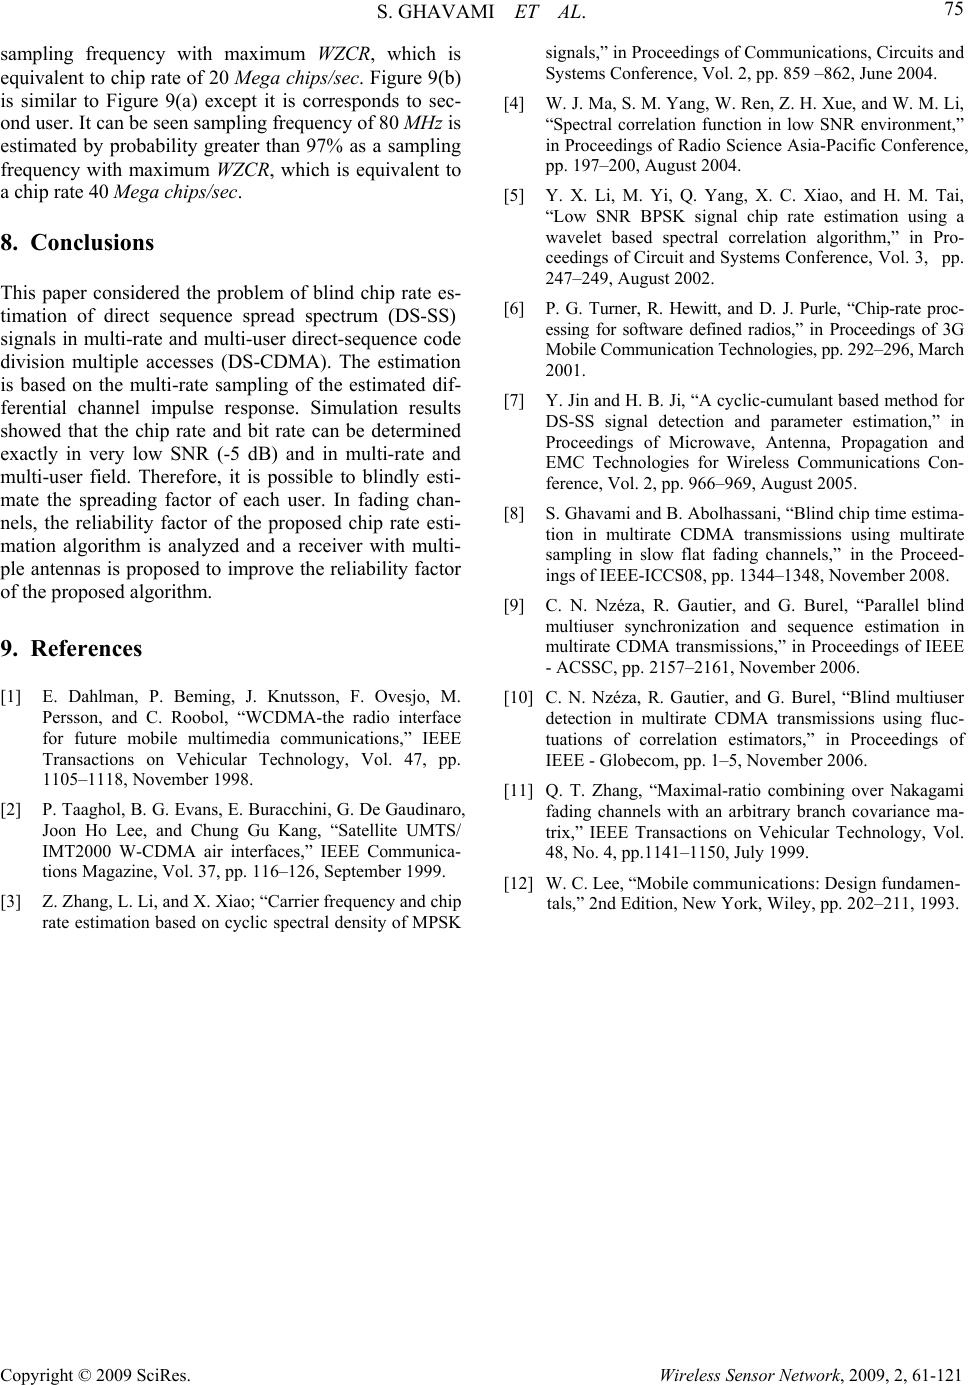 S. GHAVAMI ET AL.75 Copyright © 2009 SciRes. Wireless Sensor Network, 2009, 2, 61-121 sampling frequency with maximum WZCR, which is equivalent to chip rate of 20 Mega chips/sec. Figure 9(b) is similar to Figure 9(a) except it is corresponds to sec- ond user. It can be seen sampling frequency of 80 MHz is estimated by probability greater than 97% as a sampling frequency with maximum WZCR, which is equivalent to a chip rate 40 Mega chips/sec. 8. Conclusions This paper considered the problem of blind chip rate es- timation of direct sequence spread spectrum (DS-SS) signals in multi-rate and multi-user direct-sequence code division multiple accesses (DS-CDMA). The estimation is based on the multi-rate sampling of the estimated dif- ferential channel impulse response. Simulation results showed that the chip rate and bit rate can be determined exactly in very low SNR (-5 dB) and in multi-rate and multi-user field. Therefore, it is possible to blindly esti- mate the spreading factor of each user. In fading chan- nels, the reliability factor of the proposed chip rate esti- mation algorithm is analyzed and a receiver with multi- ple antennas is proposed to improve the reliability factor of the proposed algorithm. 9. References [1] E. Dahlman, P. Beming, J. Knutsson, F. Ovesjo, M. Persson, and C. Roobol, “WCDMA-the radio interface for future mobile multimedia communications,” IEEE Transactions on Vehicular Technology, Vol. 47, pp. 1105–1118, November 1998. [2] P. Taaghol, B. G. Evans, E. Buracchini, G. De Gaudinaro, Joon Ho Lee, and Chung Gu Kang, “Satellite UMTS/ IMT2000 W-CDMA air interfaces,” IEEE Communica- tions Magazine, Vol. 37, pp. 116–126, September 1999. [3] Z. Zhang, L. Li, and X. Xiao; “Carrier frequency and chip rate estimation based on cyclic spectral density of MPSK signals,” in Proceedings of Communications, Circuits and Systems Conference, Vol. 2, pp. 859 –862, June 2004. [4] W. J. Ma, S. M. Yang, W. Ren, Z. H. Xue, and W. M. Li, “Spectral correlation function in low SNR environment,” in Proceedings of Radio Science Asia-Pacific Conference, pp. 197–200, August 2004. [5] Y. X. Li, M. Yi, Q. Yang, X. C. Xiao, and H. M. Tai, “Low SNR BPSK signal chip rate estimation using a wavelet based spectral correlation algorithm,” in Pro- ceedings of Circuit and Systems Conference, Vol. 3, pp. 247–249, August 2002. [6] P. G. Turner, R. Hewitt, and D. J. Purle, “Chip-rate proc- essing for software defined radios,” in Proceedings of 3G Mobile Communication Technologies, pp. 292–296, March 2001. [7] Y. Jin and H. B. Ji, “A cyclic-cumulant based method for DS-SS signal detection and parameter estimation,” in Proceedings of Microwave, Antenna, Propagation and EMC Technologies for Wireless Communications Con- ference, Vol. 2, pp. 966–969, August 2005. [8] S. Ghavami and B. Abolhassani, “Blind chip time estima- tion in multirate CDMA transmissions using multirate sampling in slow flat fading channels,” in the Proceed- ings of IEEE-ICCS08, pp. 1344–1348, November 2008. [9] C. N. Nzéza, R. Gautier, and G. Burel, “Parallel blind multiuser synchronization and sequence estimation in multirate CDMA transmissions,” in Proceedings of IEEE - ACSSC, pp. 2157–2161, November 2006. [10] C. N. Nzéza, R. Gautier, and G. Burel, “Blind multiuser detection in multirate CDMA transmissions using fluc- tuations of correlation estimators,” in Proceedings of IEEE - Globecom, pp. 1–5, November 2006. [11] Q. T. Zhang, “Maximal-ratio combining over Nakagami fading channels with an arbitrary branch covariance ma- trix,” IEEE Transactions on Vehicular Technology, Vol. 48, No. 4, pp.1141–1150, July 1999. [12] W. C. Lee, “Mobile communications: Design fundamen- tals,” 2nd Edition, New York, Wiley, pp. 202–211, 1993. |