 Journal of Applied Mathematics and Physics, 2014, 2, 1039-1046 Published Online November 2014 in SciRes. http://www.scirp.org/journal/jamp http://dx.doi.org/10.4236/jamp.2014.212118 How to cite this paper: Oparin, V.N., Usoltseva, O.M., Tsoi, P.A. and Semenov, V.N. (2014) Evolution of Stress-Strain State in the Structural Heterogeneities Geomaterials under Uniaxial and Biaxial Loading. Journal of Applied Mathematics and Physics, 2, 1039-1046. http://dx.doi.org/10.4236/jamp.2014.212118 Evolution of Stress-Strain State in the Structural Heterogeneities Geomaterials under Uniaxial and Biaxial Loading V. N. Oparin, O. M. Usoltseva*, P. A. Tsoi, V. N. Semenov Institute of Mining, Russian Academy of Sciences, Siberian Branch, Novosibirsk, Russia Email: *usoltseva57@mail.ru Received August 2014 Abstract The aim of this study was to analyze distribution and development of st ress-stress state in struc- tured rock specimens subject to uniaxial and biaxial loading to failure using digital speckle corre- lation method. Within the experimental analysis of wave processes in the block-hierarchy struc- ture of geomedia (uniaxial and biaxial compression and shearing of prismatic geomaterial speci- mens), the authors revealed the fact of initiation of low-frequency micro-deformation processes under slow (quasi-static) disturbances. The estimation of the deformation-wave behavior of geo- materi als as the “summed” contributions made by elements of the scanned surfaces with differ- ent-oriented (in-phase and anti-phase) oscillations has been performed using the energy ap- proach that is based on the scanning function R, analogous to the “center of mass” in the classical mechanics. Keywords Laboratory Exp erime nt, Digital Speckle Correlation Method, Rock Mass, Hierarchical Block Structure, Microstrains, Deformation-Wave Processes 1. Introduction Dynamic advance of the theory of pendulum-type waves in stressed geomedia with block-hierarchical structure [1]-[3] has initiated a new research trend concerned with focal areas/sources of disastrous events (earthquakes, rock bursts etc.). This trend is called “geomechanical thermodynamics”. In a sense, this is an equivalent of clas- sical thermodynamics where molecules are replaced by large clusters (from submolecular to macroblocks in size), taking into account the oscillating motion (translational and rotational) of these clusters approximately as- sumed as rigid bodies. This statement constitutes the phenomenological basis of the theory of pendulum waves that are transferred by structural elements of rocks and rock masses at different hierarchical levels [4]. The mechanical model of a self-stressed rock mass was first proposed in [5] [6]. The mechanical conditions of interaction between structural elements of a constrained rock mass were replaced by nonlinear springs nested within each other (according to Sadovsky’s concept) [7]. This mechanical model allowed explaining some very *  V. N. Oparin et al. important experimentally observed features of evolution of harmonic acoustic signals in loaded blocky media with a cylindrical cavity (simulating stress concentrator or would-be source area), such as [8]: 1) the presence of rigid correlation between the loading stages in a medium with structure and the ampli- tude-frequency characteristics of harmonic signals recorded in blocks composing geomedium models; 2) the frequencies of resonant acoustic oscillations of blocks of the model, that significantly differ from each other at early stages of loading and exhibit convergence at the prefailure stage; 3) at the prefailure stage in a blocky geomedium, both the convergence of resonant frequencies of geoblocks and the amplification of amplitudes of harmonic signals take place due to the transition of elastic potential energy accumulated by geoblocks into oscillatory (kinetic) energy of acoustic waves radiation; this breaks the classical law of attenuation of harmonic signals with distance from their source. In essence, it has for the first time been found experimentally that the modeled would-be destruction source is able to evolve into acoustically active geomedium that acts as a self-oscillating or a “geomechanical laser” sys- tem under critical loading. However, it is not a monochromic system as distinguished from classical optical laser systems, the acoustic radiation spectrum assumes the discrete-canonical form: ( ) ( ) 00 2, 0,1,2,; 2 i ip ff ifV== ±±=∆ where is the P-wave velocity in geoblocks and Δ is the diameter of geoblocks. It is important to mention that [9] presents the first simplest model describing conditions of the canonical spectrum of acoustic waves assuming that the rigidity of interaction between structural blocks (“springs”) is the nonlinear function of their relative displacements. 2. Macro- and Microstrains in Artificial Geomaterial Specimens under Biaxial Loading to Failure The template is used to format your paper and style the text. All margins, column widths, line spaces, and text fonts are prescribed; please do not alter them. You may note peculiarities. For example, the head margin in this template measures proportionately more than is customary. This measurement and others are deliberate, using specifications that anticipate your paper as one part of the entire journals, and not as an independent document. Please do not revise any of the current designations. The authors have previously performed tests on rock spe- cimens with structural inhomogeneity [10]. These tests were aimed at studying peculiarities of distribution and evolution of microlevel stress-strain state on work surfaces of the specimens under uniaxial loading to failure using speckle photography method. It was found out that: 1) the uniaxial loading of prismatic specimens made of sandstone, marble and sylvinite by slow (quasistatic) force ((Instron 8802 testing system, stiff loading, movable grip velocity of 0.02 - 0.2 mm/min) generates low-frequency inner microstrains at a certain stress level; 2) the amplitude of these deformation–wave processes depends significantly on the level of macroloading; at the stage of elastic deformation, when stresses are under 0.5 of ultimate strength of the geomaterial, the oscilla- tions of microdeformation components are almost absent; at the stage of nonlinear elastic deformation, under stresses in the range from 0.5 to 1 of specimen’s ultimate strength, the amplitudes of microstrain oscillations significantly increase, including the descending stage; at the stage of residual strength, the oscillation amplitudes the microdeformation components decrease drastically (3 - 5 times) as compared to the previous stages; 3) in the elements of scanned surface of a rock specimen, which cover the area of a future crack, amplitudes of the microstrain velocities έу several times exceed the microstrain velocity amplitudes on the surface areas of an undisturbed geomaterial. Sometimes the deformation velocities increase under load increment. The objective of this work is to define the influence of the type of loading on the behavior of deformation processes in artificial geomaterials right down to peak loading. The artificial specimens were made of alabaster and water: 60% of alabaster, 35% of water, 5% of Neolit glue; the inclusions were presented by balls 3 - 4 mm in diameter made of silicium dioxide (silica gel) annealed with additives by stages. For the inclusions, the ultimate compression strength was 10.6 МPа; for the binder, the ul- timate strength 5.4 MPa under axial compression and 10.5 MPa biaxial compression (under biaxial compression, , where is the ultimate strength of material). The prismatic specimens were 60 × 60 × 11 mm in size (Figure 1). 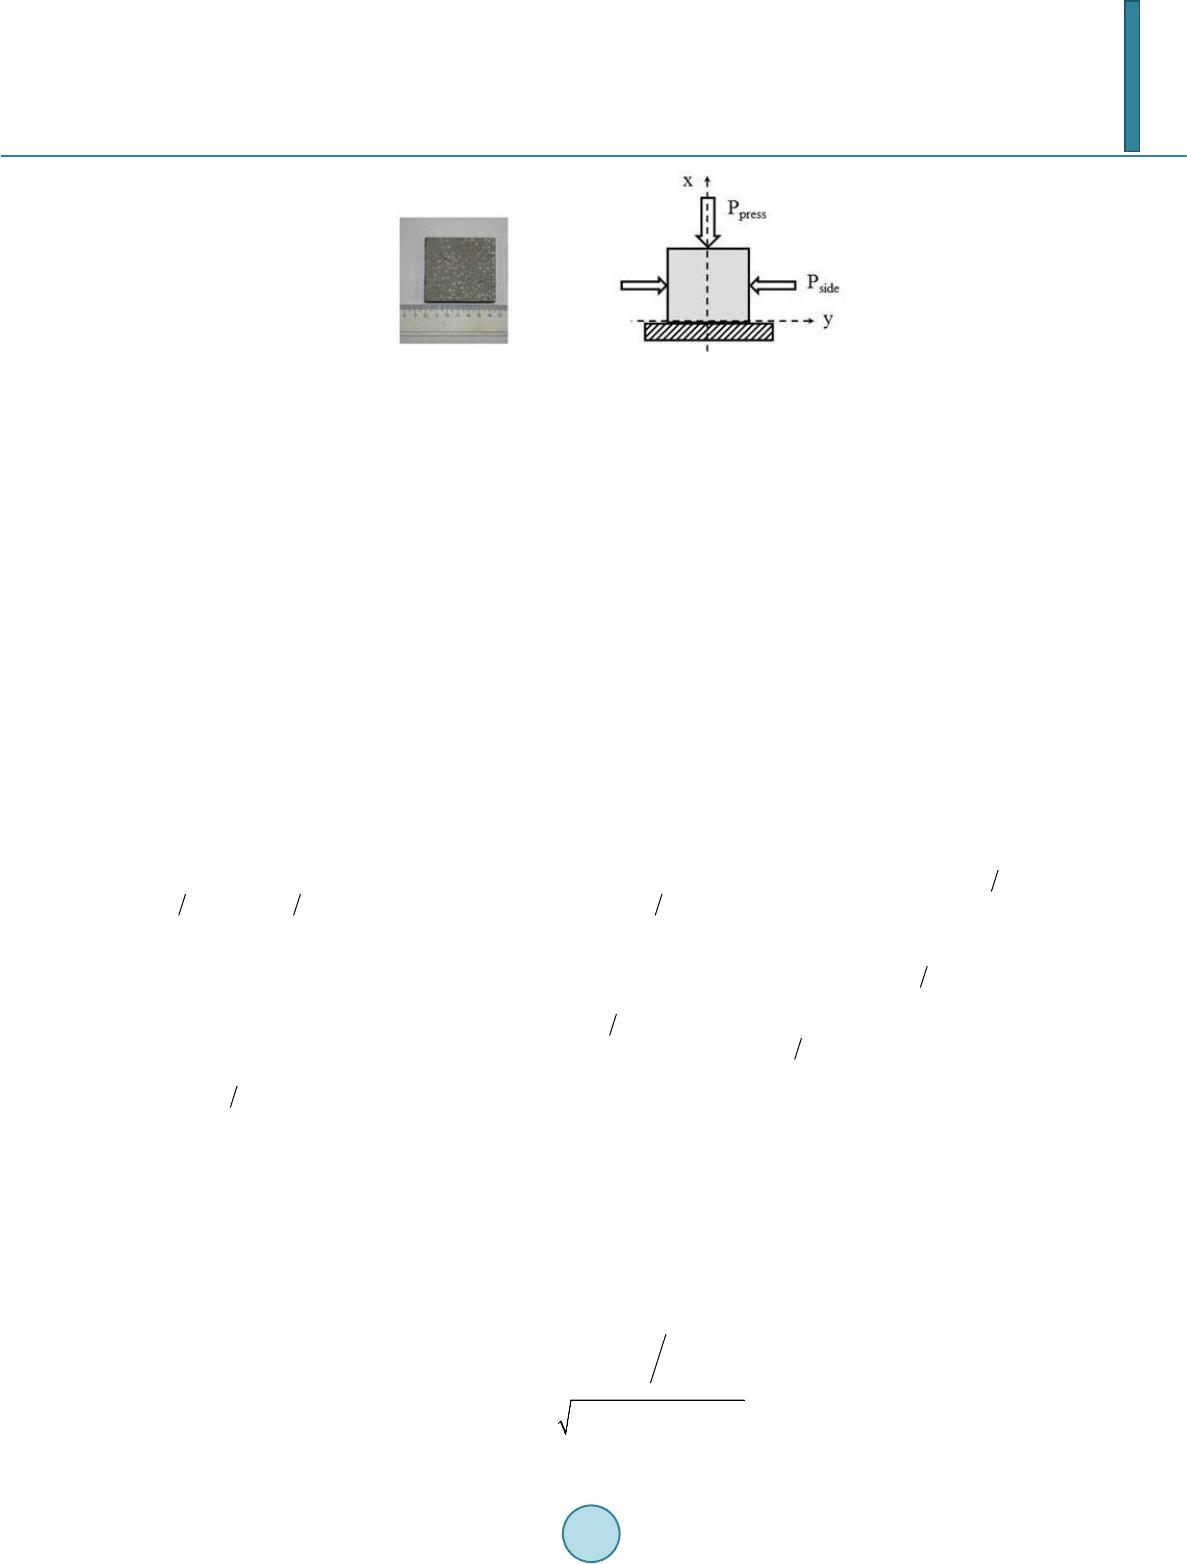 V. N. Oparin et al. (a) (b) Figure 1. The artificial specimen (a) ; the loading diagram (b). The tests of the geomaterial specimens were conducted on servohydraulic press Instron-8802, which allowed loading at the assigned rate of force and displacement. Biaxial loading was implemented by a special device creating additional (press independent) lateral loading of the prismatic specimen. The force of the additional lat- eral compression of the specimen, displacement of the press cross-head and the press force were continuously recorded during the experiments. The maximum press force was set at a fixed cross-head rate of 1 mm/min. Mi- crostrains on the work surface of the prismatic specimens were registered with the help of the automated digital speckle-photography analysis system ALMEC-tv [11]. A series of tests on uniaxial and biaxial stiff compression (to failure) of prismatic specimens made of artificial geomaterials under uniaxial and biaxial stiff compression (to failure) was conducted. Figure 2 shows the “macrodeformation” results. The comparative analysis of microdeformation processes in the specimen was performed for the scanned areas of various size: 1—areas of failure, 2—areas of undisturbed material. The sizes of the tested areas were varied in the range from 0.1 to 0.5 of the size of the scanned surface (Figure 3). Below the representative expe- rimental data on the biaxial compression are analyzed. On the work surface of the specimen, rectangular areas of the same size were chosen (Figure 3), and total microstrains were calculated for these areas in longitudinal , transverse and shear directions— , and , respectively. Figures 4(а)-(c) shows the plots of total microstrains (red color—the failure area (1), blue color—the undisturbed area (2) of the specimen surface; black color shows the relation of stress and time under loading up to ultimate strength of the specimen in the dimensionless coordinates and , where corresponds to the peak loading . The plots exhibit the following behavioral features of the microdeformation components: • the microstrains in areas 1 and 2 have almost the same values right down to ultimate strength; • the microstrains in areas 1 and 2 show almost the antiphase change, especially at and on- ward, and differ significantly; • the plots of in areas 1 and 2, starting from , are significantly cophased. However, the dif- ference in their absolute values increases up to the ultimate strength: at in area 2 and in area 1; • at in all deformation components there appear high-frequency oscillations. The amplitude of oscillations is significantly higher in area 2 as compared to area 1. The evaluation of deformation-wave behavior of the artificial geomaterials as the “sum” of contributions of the scanned surface elements with counter-directional (cophase and antiphase) oscillations used the energy ap- proach as in [10]. The energy approach to evaluation of deformation-wave processes is based on the scanning function R that is equivalent to the notion of the “center of mass” in the classical mechanics, and describes the way of determining the reduced center of seismic energy release for a given period of time within the limits of a given volume of a rock mass. For these experiments, the coordinates of R and the mechanical trajectory of the reduced center of deforma- tion energy release are respectively given by: (1) (2)  V. N. Oparin et al. Figure 2. The uniaxial (1) and biaxial (2) compression; the time of the crack initiation is t = 130 s under the uniaxial com- pression and t = 140 s under the biaxial compression. Figure 3. The scanned specimen surface in the biaxial com- pression test after failure (time t = 140 s); 1—areas of failure, 2—areas of undisturbed material. Figure 4. The microstrains , and (a, b, c) and scanning functions , and (d, e, f) for the microstrains , and versus time in the dimensionless coordinates , in the test on biaxial loading of artificial geomaterial specimen.  V. N. Oparin et al. where is the strain at the point , , is the coordinate origin (the geometric center of the specimen work surface), N is the number of measuring points on the work surface of the specimen; summing is conducted at the time (image ) and the known Р. Figures 4(d)-(f) shows the plots of the scanning functions and , for (1), separately for each microdeformation component , under loading of the specimen to ultimate strength, in the dimensionless coordinates and , where tlim corresponds to the peak loading . The calculations were performed using the dimensionless coordinates , where is the maximum size of in the longitudinal direction of the specimen. According to the plots, , and have the following features: • the function in areas 1 and 2 up to remains almost unaltered. However, at - 0.7 it undergoes significant alternating change. The oscillatory process for keeps up to the ultimate strength, and the amplitude of oscillation of in area 1 essentially exceeds its oscillation amplitude in area 2; • the function in area 1 changes drastically at - 0.4, and then takes on a constant value; in area 2 the oscillatory changes of appear at - 0.87, with further decrease; • the function in area 1 keeps almost constant values, except for the interval - 0.73; in area 2 it oscillates with the growing amplitude up to the ultimate strength. Based on the analysis of the behavior of the functions , , , , and , the fol- lowing pre-failure features are definable in the specimens: 1) the components of same deformation (the microstrains , ) in areas 1 and 2 differ significantly; 2) the amplitude of oscillation of the microdeformation components in the area of failure significantly exceeds their oscillation amplitude in the undisturbed area, which implies the higher deformation velocity and the change of the strain state type (it is also observed for the microstrains , ); 3) the scanning functions have oscillatory character, which gives evidence оf inhomogeneity of the inner strain state of geomaterial. However, coming to the peak loading before the crack formation , the scanning functions , take on the constant values. Such behavior of the scan- ning functions , in combination with the increase in values of the microstrains , and their oscillation amplitudes implies the localization of deformation peak values and the narrowing of the area where the microstrains are concentrated. On the basis of the abovesaid, we conclude that the microstrains , are responsible for failure. The area of macrofailure formation can clearly be seen. Figure 5 shows the picture of the specimen surface de- struc t ed under post-limit loading at . A cleavage crack has stepped surface and forms angles of 20 - 40˚ with the direction of the axial force, i.е. it creates combination of microcracks in the directions of and . 3. Test of the Artificial Geomaterial Specimen under Uniaxial Loading to Failur e The uniaxial compression test of the specimen made of artificial geomaterial was carried out to be compared to the case described above. On the basis of the described criteria, the authors will make an attempt to evaluate the type of future failure by the time behavior of the microstrains , and as well as the behavior of the scanning functions , and . For this type of loading, the behavior of is almost the same in areas 1 and 2 of the scanning surface (Figure 6(а)) within the limits of the test accuracy. The scanning functions (Figure 6(а)) also behave the same way in areas 1 and 2 and coincide at ; further there appear high-frequency oscillations of deformations right down to ultimate strength at . The microstrains behave drastically different in areas 1 and 2 (Figure 6(b)). Their change is practically antiphase. At their values are more than 10 times different (0.002 and 0.02). The amplitude of high -frequency oscillations of is much higher than the oscillation amplitudes of and . The function in area 2 (Figure 6(e)) oscillates at high frequency right down to ultimate strength, whereas the function in area 1 takes on a constant value at - 1. The behavior of the scanning functions for (Figur e 6(c)) significantly differs in areas 1 and 2 (anti- phase). However, their absolute value decreases under loading up to ultimate strength. The scanning functions in areas 1 and 2 (Figure 6( f)) also have oscillatory character but they differ drastically in structure (am-  V. N. Oparin et al. Figure 5. The picture of the specimen surface after failure under biaxial compression at the time . Figure 6. The microstrains , and (a, b, c) and scanning functions , and (d, e, f) for the microstrains , and versus time in the dimensionless coordinates , in the test on uniaxial loading of artificial geomaterial specimen. plitude–frequency spectrum) at . The features found in the behavior of microcharacteristics of deformation indicate the direction is the most hazardous in terms of failure as higher values of the microstrains and their change velocities are ob- served in this direction. The steady state of denotes the narrowing of zone of their localization. Accor- dingly, macrofailure is expected by the component . The features found in the behavior of microcharacteristics of deformation indicate the direction is the most hazardous in terms of failure as higher values of the microstrains and their change velocities are ob- served in this direction. The steady state of denotes the narrowing of zone of their localization. Accor- dingly, macrofailure is expected by the component . Indeed, Figure 7 shows that the crack formed mainly in the direction of at . The tests of artificial geomaterials under biaxial and uniaxial loading allowed determination of the behavior of the microstrains , and and their scanning functions , and . These behavioral features of microstrains can be used as the testing parameter for finding the time, location and type of an inci- pient crack. It should be mentioned that [9] [12] present the general patterns of deformation localization at the stage of  V. N. Oparin et al. Figure 7. The picture of the surface of the artificial geomaterial specimen after its failure under uniaxial compression, the test time . pre-failure in sylvinite, marble and sandstone specimens obtained using the speckle-photography method. The autowave behavior of inelastic deformation under compression of rocks has been emphasized. Auto wave veloc- ity is of the order of 10-5 - 10-4 m/s. 4. Conclusions The experimental studies on the specimens made of artificial geomaterials with structural inhomogeneity in the form of inclusions have allowed the detailed testing of the peculiarities of distribution and evolution of their mi- crolevel stress–strain state on work surfaces of the rock specimens under uniaxial and biaxial loading to failure using speckle photography method. Within the limits of the experimental study of wave processes in the geome- dia with structural hierarchy of blocks, the earlier found phenomenon of low-frequency microdeformation gen- erated by slow (quasistatic) force has been confirmed. The energy approach has been used to evaluate the deformation-wave behavior of geomaterials as the “sum” of contributions of scanned surface elements with counter-directional (cophased and antiphase) oscillations. The energy approach to evaluation of deformation-wave processes is based on the scanning function R that is the equivalent of the notion of the “center of mass” in the classical mechanics, and describes the way of determining the reduced center of seismic energy release for a set period of time within the limits of a given volume of rock mass . The authors have defined the features of the behavior of the scanning functions for the microstrains , and (in longitudinal, transverse and shear directions) under loading to failure. These behavioral features can be used as the testing parameter for locating a nucleating main fracture. The research findings are of practic- al importance as applied to monitoring of geomechanical-geodynamic safety in mines on the basis of integrated usage of seismic-deformation data. Acknowledgem ents The work was supported by partly the Russian Academy of Sciences, project ONZ-RAN 3.1, grant no. 12-05-01057. The equipment is kindly provided by the Shared Geomechanical, Geophysical and Geodynamic Measurement Center of the Siberian Branch of the Russian Academy of Sciences. References [1] Adushkin, V.V. and Oparin, V.N. (2012) From the Alternating-Sign Explosion Response of Rocks to the Pendulum Waves in Stressed Geomedia. Part I. Journal of Mining Sciences, 2, 203-222. http://dx.doi.org/10.1134/S1062739148020013 [2] Adushkin, V.V. and Oparin, V.N. (2013) From the Alternating-Sign Explosion Response of Rocks to the Pendulum Waves in Stressed Geomedia. Part II. Journal of Mining Sciences, 2, 175-209. http://dx.doi.org/10.1134/S1062739149020019 [3] Oparin, V.N. and Simonov, B.F. (2010) Nonlinear Deformation-Wave Processes in the Vibrational Oil Geotechnolo- gies. Journal of Mining Sciences, 2, 95-112. http://dx.doi.org/10.1007/s10913-010-00 14 -9 [4] Kur lenya, M.V., Opa r i n, V.N. and Vos tri kov, V.I. (19 93 ) On the Formation of Elastic Wave Packets under Pulsed Ex- citation Block Media. Waves Pendulum Vμ. Reports of Academy of Sciences, 333, 515-521. [5] Kurlenya, M.V. and Oparin, V.N. (1990) The Phenomenon of Alternating Reactions of Rocks on the Dynamic Effects.  V. N. Oparin et al. Journal of Mining Sciences, 4, 3-13. [6] Kur lenya, M.V. , Oparin, V.N., Revuzh enko, A.F. and Shemyakin, E.I. (1987) On Some Peculiarities of the Reaction of Rocks on the Explosive Impact in the Near Field. Reports of Academy of Sciences, 29 3, 67-79. [7] Sa do vski, M.A. (1979) Natural Lumpiness of R ocks . Reports of Academy of Sciences, 24 7, 829-834. [8] Kurl enya, M.V., Oparin , V.N. and Jushkin, V.F. (1999) About Some of the Features of the Evolution of Harmonic Acoustic Signals during Loading Block Media with a Cylindrical Cavity. Journal of Mining Sciences, 6, 10-32. [9] Oparin, V.N., Usoltseva, O.M., Semenov, V.N. and Tso i , P.A. (2013) Evolution of Stress-Strain State in Structured Rock Specimens under Uniaxial Loading. Journal of Mining Sciences, 5, 3-14. [10] Kurl enya, M.V., Oparin, V.N. and E remenko, A.A. (1993) On a Method of Scanning Mine Seismological Information. Reports of Academy of Sciences, 333, 784-787. [11] Usoltseva, O.V. , Nazaro va, L. A. , Tso i , P . A. , Nazarov, L.A. and Semenov, V.N. (2013) Genesis and Evolution of Dis- continuities in Geomaterial s. Theory and Laboratory Experiment. Journal of Mining Sciences, 1, 3-10. [12] Zu ev, L. B., Baranniko va, S . A. , Nadezhkin , M .V . and Gorbatenko, V.V. (2014) Localization of Deformation and Prognostibility of Rock Failure. Journal of Mining Sciences, 1, 43-49. http://dx.doi.org/10.1134/S1062739114010074
|