Paper Menu >>
Journal Menu >>
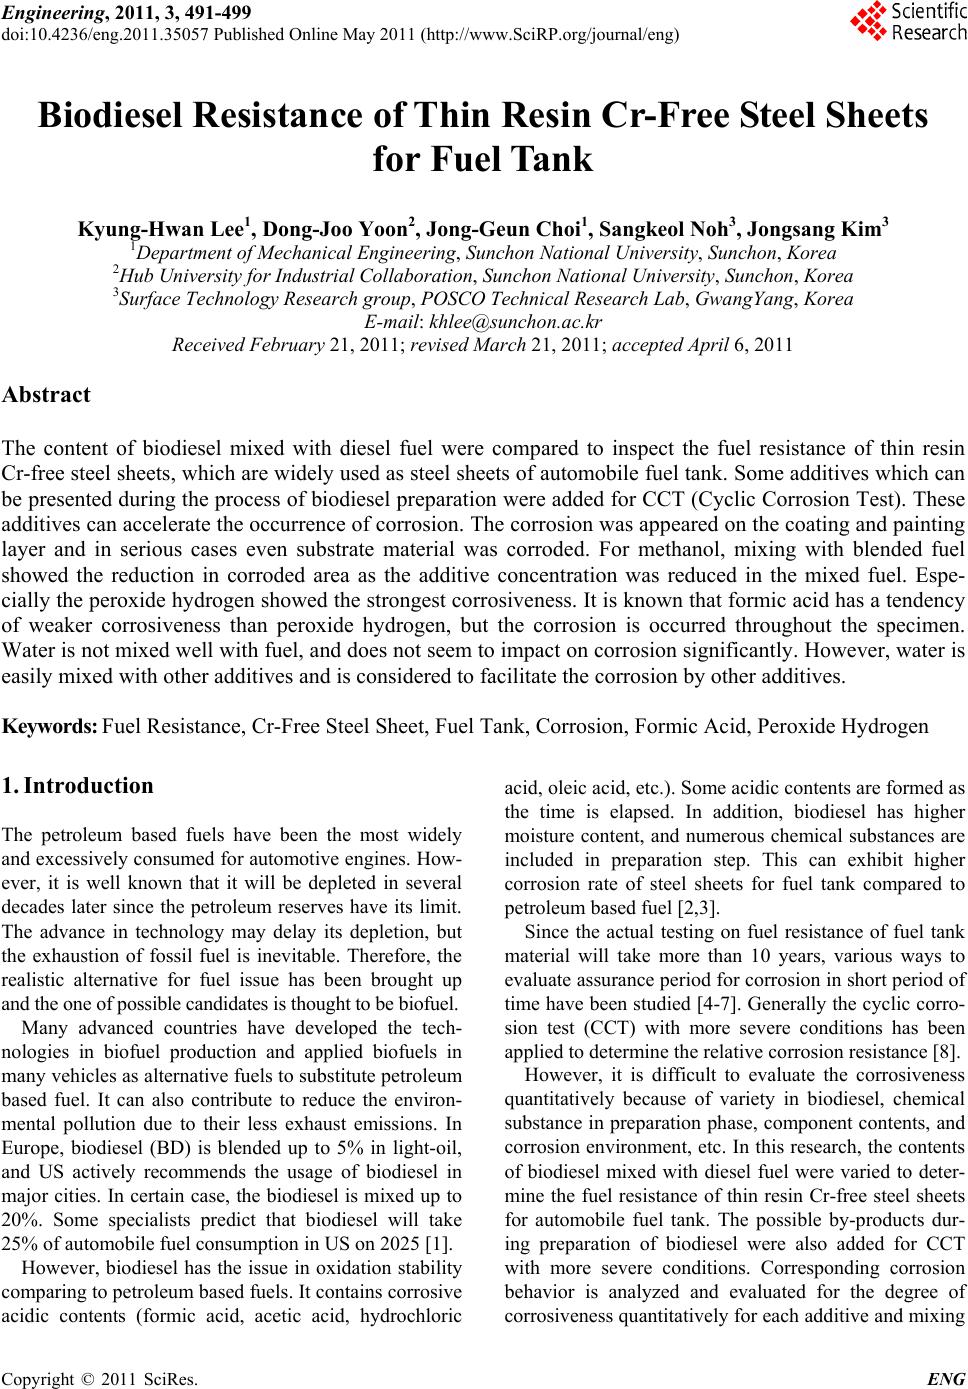 Engineering, 2011, 3, 491-499 doi:10.4236/eng.2011.35057 Published Online May 2011 (http://www.SciRP.org/journal/eng) Copyright © 2011 SciRes. ENG Biodiesel Resistance of Thin Resin Cr-Free Steel Sheets for Fuel Tank Kyung-Hwan Lee1, Dong-Joo Yoon2, Jo n g- Ge u n Cho i 1, Sangkeol Noh3, Jongsang Kim3 1Department of Mechanical Engineering, Sunchon National University, Sunchon, Korea 2Hub University for Industrial Collaboration, Sunchon National University, Sunchon, Ko rea 3Surface Technology Research group, POSCO Technical Research Lab, G w an gYang, Korea E-mail: khlee@sunchon.ac.kr Received February 21, 2011; revised March 21, 2011; acce pted April 6, 2011 Abstract The content of biodiesel mixed with diesel fuel were compared to inspect the fuel resistance of thin resin Cr-free steel sheets, which are widely used as steel sheets of automobile fuel tank. Some additives which can be presented during the process of biodiesel preparation were added for CCT (Cyclic Corrosion Test). These additives can accelerate the occurrence of corrosion. The corrosion was appeared on the coating and painting layer and in serious cases even substrate material was corroded. For methanol, mixing with blended fuel showed the reduction in corroded area as the additive concentration was reduced in the mixed fuel. Espe- cially the peroxide hydrogen showed the strongest corrosiveness. It is known that formic acid has a tendency of weaker corrosiveness than peroxide hydrogen, but the corrosion is occurred throughout the specimen. Water is not mixed well with fuel, and does not seem to impact on corrosion significantly. However, water is easily mixed with other additives and is considered to facilitate the corrosion by other additives. Keywords: Fuel Resistance, Cr-Free Steel Sheet, Fuel Tank, Corrosion, Formic Acid, Peroxide Hydrogen 1. Introduction The petroleum based fuels have been the most widely and excessively consumed for automotive engines. How- ever, it is well known that it will be depleted in several decades later since the petroleum reserves have its limit. The advance in technology may delay its depletion, but the exhaustion of fossil fuel is inevitable. Therefore, the realistic alternative for fuel issue has been brought up and the one of possible candidates is thought to be biofuel. Many advanced countries have developed the tech- nologies in biofuel production and applied biofuels in many vehicles as alternative fuels to substitute petroleum based fuel. It can also contribute to reduce the environ- mental pollution due to their less exhaust emissions. In Europe, biodiesel (BD) is blended up to 5% in light-oil, and US actively recommends the usage of biodiesel in major cities. In certain case, the biodiesel is mixed up to 20%. Some specialists predict that biodiesel will take 25% of automobile fuel consumption in US on 2025 [1]. However, biodiesel has the issue in oxidation stability comparing to petroleum based fuels. It contains corrosive acidic contents (formic acid, acetic acid, hydrochloric acid, oleic acid, etc.). Some acidic contents are formed as the time is elapsed. In addition, biodiesel has higher moisture content, and numerous chemical substances are included in preparation step. This can exhibit higher corrosion rate of steel sheets for fuel tank compared to petroleum based fuel [2,3]. Since the actual testing on fuel resistance of fuel tank material will take more than 10 years, various ways to evaluate assurance period for corrosion in short period of time have been studied [4-7]. Generally the cyclic corro- sion test (CCT) with more severe conditions has been applied to determine the relative corrosion resistance [8]. However, it is difficult to evaluate the corrosiveness quantitatively because of variety in biodiesel, chemical substance in preparation phase, component contents, and corrosion environment, etc. In this research, the contents of biodiesel mixed with diesel fuel were varied to deter- mine the fuel resistance of thin resin Cr-free steel sheets for automobile fuel tank. The possible by-products dur- ing preparation of biodiesel were also added for CCT with more severe conditions. Corresponding corrosion behavior is analyzed and evaluated for the degree of corrosiveness quantitatively for each additive and mixing 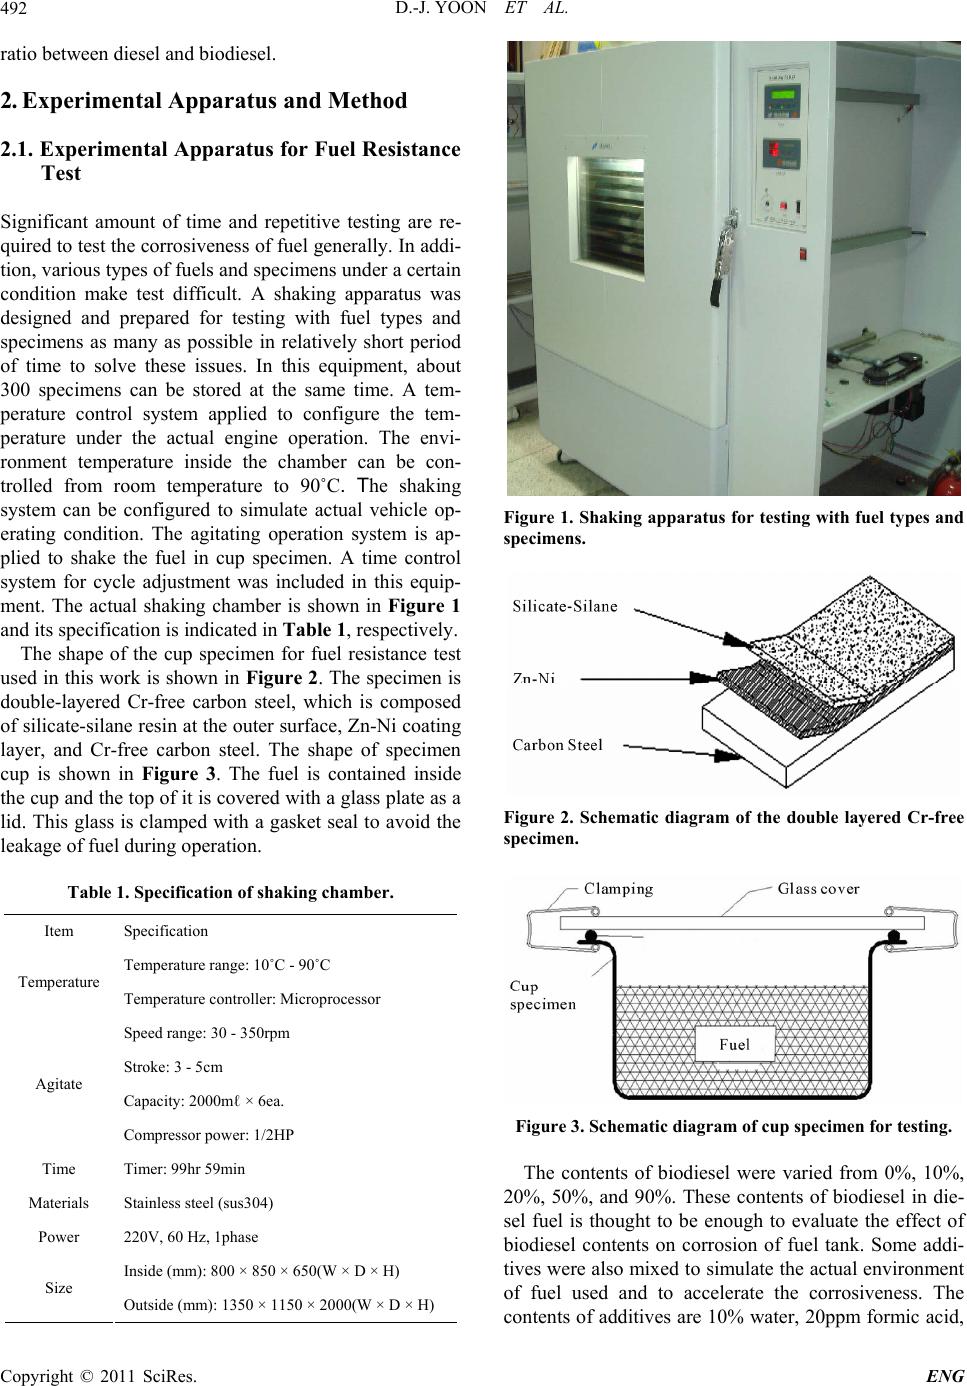 D.-J. YOON ET AL. 492 ratio between diesel and biodiesel. 2. Experimental Apparatus and Method 2.1. Experimental Apparatus for Fuel Resistance Test Significant amount of time and repetitive testing are re- quired to test the corrosiveness of fuel generally. In addi- tion, various types of fuels and specimens under a certain condition make test difficult. A shaking apparatus was designed and prepared for testing with fuel types and specimens as many as possible in relatively short period of time to solve these issues. In this equipment, about 300 specimens can be stored at the same time. A tem- perature control system applied to configure the tem- perature under the actual engine operation. The envi- ronment temperature inside the chamber can be con- trolled from room temperature to 90˚C. The shaking system can be configured to simulate actual vehicle op- erating condition. The agitating operation system is ap- plied to shake the fuel in cup specimen. A time control system for cycle adjustment was included in this equip- ment. The actual shaking chamber is shown in Figure 1 and its specification is indicated in Table 1, respectively. The shape of the cup specimen for fuel resistance test used in this work is shown in Figure 2. The specimen is double-layered Cr-free carbon steel, which is composed of silicate-silane resin at the outer surface, Zn-Ni coating layer, and Cr-free carbon steel. The shape of specimen cup is shown in Figure 3. The fuel is contained inside the cup and the top of it is covered with a glass plate as a lid. This glass is clamped with a gasket seal to avoid the leakage of fuel during operation. Table 1. Specification of shaking chamber. Item Specification Temperature range: 10˚C - 90˚C Temperature Temperature controller: Microprocessor Speed range: 30 - 350rpm Stroke: 3 - 5cm Capacity: 2000mℓ × 6ea. Agitate Compressor power: 1/2HP Time Timer: 99hr 59min Materials Stainless steel (sus304) Power 220V, 60 Hz, 1phase Inside (mm): 800 × 850 × 650(W × D × H) Size Outside (mm): 1350 × 1150 × 2000(W × D × H) Figure 1. Shaking apparatus for testing with fuel types and specimens. Figure 2. Schematic diagram of the double layered Cr-free specimen. Figure 3. Schematic diagram of cup specimen for testing. The contents of biodiesel were varied from 0%, 10%, 20%, 50%, and 90%. These contents of biodiesel in die- sel fuel is thought to be enough to evaluate the effect of biodiesel contents on corrosion of fuel tank. Some addi- tives were also mixed to simulate the actual environment of fuel used and to accelerate the corrosiveness. The contents of additives are 10% water, 20ppm formic acid, Copyright © 2011 SciRes. ENG 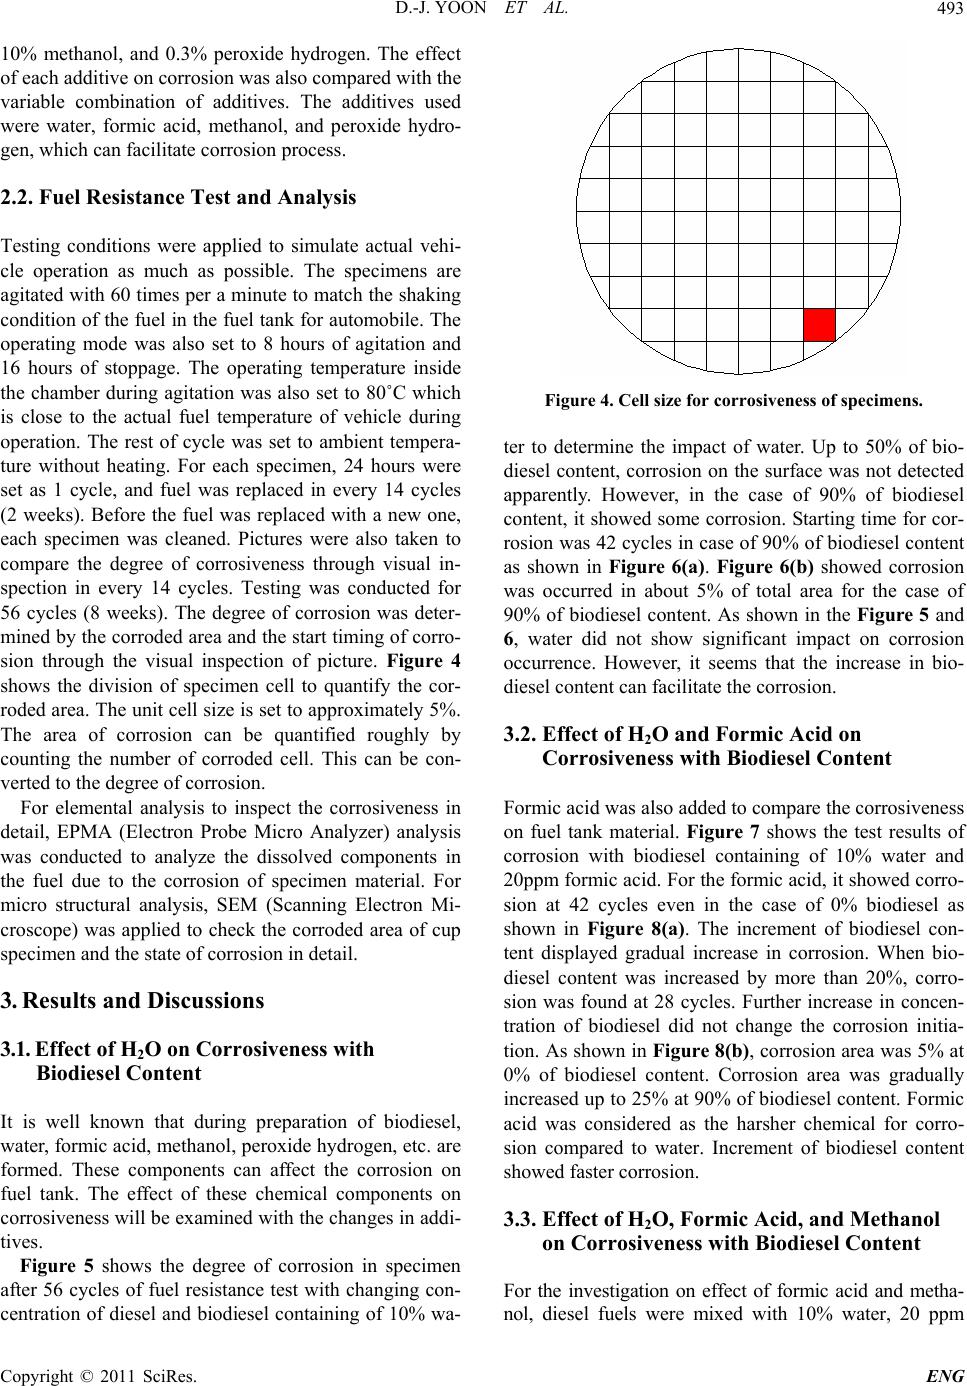 D.-J. YOON ET AL.493 10% methanol, and 0.3% peroxide hydrogen. The effect of each additive on corrosion was also compared with the variable combination of additives. The additives used were water, formic acid, methanol, and peroxide hydro- gen, which can facilitate corrosion process. 2.2. Fuel Resistance Test and Analysis Testing conditions were applied to simulate actual vehi- cle operation as much as possible. The specimens are agitated with 60 times per a minute to match the shaking condition of the fuel in the fuel tank for automobile. The operating mode was also set to 8 hours of agitation and 16 hours of stoppage. The operating temperature inside the chamber during agitation was also set to 80˚C which is close to the actual fuel temperature of vehicle during operation. The rest of cycle was set to ambient tempera- ture without heating. For each specimen, 24 hours were set as 1 cycle, and fuel was replaced in every 14 cycles (2 weeks). Before the fuel was replaced with a new one, each specimen was cleaned. Pictures were also taken to compare the degree of corrosiveness through visual in- spection in every 14 cycles. Testing was conducted for 56 cycles (8 weeks). The degree of corrosion was deter- mined by the corroded area and the start timing of corro- sion through the visual inspection of picture. Figure 4 shows the division of specimen cell to quantify the cor- roded area. The unit cell size is set to approximately 5%. The area of corrosion can be quantified roughly by counting the number of corroded cell. This can be con- verted to the degree of corrosion. For elemental analysis to inspect the corrosiveness in detail, EPMA (Electron Probe Micro Analyzer) analysis was conducted to analyze the dissolved components in the fuel due to the corrosion of specimen material. For micro structural analysis, SEM (Scanning Electron Mi- croscope) was applied to check the corroded area of cup specimen and the state of corrosion in detail. 3. Results and Discussions 3.1. Effect of H2O on Corrosiveness with Biodiesel Content It is well known that during preparation of biodiesel, water, formic acid, methanol, peroxide hydrogen, etc. are formed. These components can affect the corrosion on fuel tank. The effect of these chemical components on corrosiveness will be examined with the changes in addi- tives. Figure 5 shows the degree of corrosion in specimen after 56 cycles of fuel resistance test with changing con- centration of diesel and biodiesel containing of 10% wa- Figure 4. Cell size for corrosiveness of specimens. ter to determine the impact of water. Up to 50% of bio- diesel content, corrosion on the surface was not detected apparently. However, in the case of 90% of biodiesel content, it showed some corrosion. Starting time for cor- rosion was 42 cycles in case of 90% of biodiesel content as shown in Figure 6(a). Figure 6(b) showed corrosion was occurred in about 5% of total area for the case of 90% of biodiesel content. As shown in the Figure 5 and 6, water did not show significant impact on corrosion occurrence. However, it seems that the increase in bio- diesel content can facilitate the corrosion. 3.2. Effect of H2O and Formic Acid on Corrosiveness with Biodiesel Content Formic acid was also added to compare the corrosiveness on fuel tank material. Figure 7 shows the test results of corrosion with biodiesel containing of 10% water and 20ppm formic acid. For the formic acid, it showed corro- sion at 42 cycles even in the case of 0% biodiesel as shown in Figure 8(a). The increment of biodiesel con- tent displayed gradual increase in corrosion. When bio- diesel content was increased by more than 20%, corro- sion was found at 28 cycles. Further increase in concen- tration of biodiesel did not change the corrosion initia- tion. As shown in Figure 8(b), corrosion area was 5% at 0% of biodiesel content. Corrosion area was gradually increased up to 25% at 90% of biodiesel content. Formic acid was considered as the harsher chemical for corro- sion compared to water. Increment of biodiesel content showed faster corrosion. 3.3. Effect of H2O, Formic Acid, and Methanol on Corrosiveness with Biodiesel Content For the investigation on effect of formic acid and metha- ol, diesel fuels were mixed with 10% water, 20 ppm n Copyright © 2011 SciRes. ENG  D.-J. YOON ET AL. Copyright © 2011 SciRes. ENG 494 (a) (b) (c) (d) (e) Figure 5. Corrosion behavior of cup specimens with increasing of biodiesel containing of H2O, (a) BD 0%; (b)BD 10%; (c) BD20%; (d) BD 50%; (e) BD 90%. (a) (b) Figure 6. Corrosion test result for containing of 10% H2O, (a) Start timing of corrosion; (b) Corroded cell area. formic acid, and 10% methanol with varied content of biodiesel. Figure 9 shows the corrosion state on speci- men after 56 cycles. The addition of formic acid and methanol showed relatively low increment in corrosion initiation compared to the case of containing formic acid only as shown in Figure 8(a) and 10(a). Less than 10% of biodiesel did not show significant corrosion. At 20% of biodiesel content, 42 cycles showed the first corrosion. The start timing was advanced to 28 cycles at 50% of biodiesel content, which was the earliest time of corro- sion occurrence. At 80%, corrosion initiation was oddly delayed. The reason for delay was considered that the mixing of methanol and biodiesel would lower the corro- siveness compared to formic acid addition. As shown in  D.-J. YOON ET AL.495 (a) (b) (c) (d) (e) Figure 7. Corrosion behavior of cup specimens with increasing of biodiesel contents containing of H2O and formic acid, (a) BD 0%; (b)BD 10%; (c) BD20%; (d) BD 50%; (e) BD 90%. (a) (b) Figure 8. Corrosion test result for containing of H2O and formic acid, (a) Start timing of corrosion, (b) Corroded cell area. Figure 8(a) and 10(a), corroded area was relatively low at formic acid and methanol mixture. The corroded area in the cases of more than 20% of biodiesel contents was approximately 10%. Formic acid tends to be mixed well with water rather than diesel or biodiesel. However, in the fuel mixed with formic acid, biodiesel, and methanol, the formic acid is thought to be mixed with the mixture of biodiesel and methanol more actively than water. This will decrease the acidity of formic acid, and corroded area would be decreased accordingly. 3.4. Effect of H2O, Formic Acid, Methanol, and Peroxide Hydrogen on Corrosiveness with Biodiesel Content In this case, the effect of peroxide hydrogen was applied Copyright © 2011 SciRes. ENG  D.-J. YOON ET AL. 496 (a) (b) (c) (d) (e) Figure 9. Corrosion behavior of c up specime ns with increasing of biodiesel c ontaining of H2O, formic acid, and methanol, (a) BD 0%; (b)BD 10%; (c) BD20%; (d) BD 50%; (e) BD 90%. (a) (b) Figure 10. Corrosion test result for containing of H2O, formic acid, and methanol, (a) Start timing of corrosion; (b) Cor roded cell area. to accelerate the corrosion behavior. Diesel fuel was mixed with 10% water, 20ppm formic acid, 10% metha- nol, and 0.3% peroxide hydrogen with varied contents of biodiesel. Figure 11 shows the results of diesel contain- ing of these additives with changing content of biodiesel. Peroxide hydrogen is the compound with 2 oxygen atom, which is connected through single covalent bonding. It is usually used as bleach, polymerization agent, hydrogen peroxide hydrogen, etc. Peroxide hydrogen is added as bleach during biodiesel preparation process. Peroxide hydrogen is known to have very strong corro- siveness compared to water, formic acid, and methanol. As shown in Figure 12(a), all specimens showed corro- sion at 14 cycles regardless of biodiesel content. From Copyright © 2011 SciRes. ENG  D.-J. YOON ET AL.497 this result, peroxide hydrogen would be considered as extremely harsh condition. As shown in Figure 12(b), corrosion cell area was 55% at 0% and 10% of biodiesel content. At 20% and 50% of biodiesel content, corroded cell area was reduced to 35%, and 90% showed 20% of corroded area. As biodiesel content increases, its corro- sion area is reduced. The increase in biodiesel content will promote the mixing with peroxide hydrogen, and its corrosive intensity would be gradually reduced. To determine the area of corrosion generation, the evaluation with the image through SEM was conducted as shown in Figure 13 and 14. Figure 13 is the SEM (a) (b) (c) (d) (e) Figure 11. Corrosion behavior of cup specimens with incre asing of biodiesel contents containing of H2O, formic acid, metha- nol, and peroxide hydr oge n, (a) BD 0%; (b)BD 10%; (c) BD20%; (d) BD 50%; (e) BD 90%. (a) (b) Figure 12. Corrosion test result for containing of H2O, formic acid, methanol and peroxide hydrogen, (a) Start timing of cor- osion; (b) Corroded cell area. r Copyright © 2011 SciRes. ENG  D.-J. YOON ET AL. Copyright © 2011 SciRes. ENG 498 image of Cr-free steel sheet before corrosion. Typical SEM image of corroded area with BD50 containing of H2O, formic acid, methanol, and peroxide hydrogen is shown in Figure 14. The area (a) in Figure 14 shows the formation of lump in painting layer, and delamination of painting can be found in area (b). The Zn-Ni layer under the silicate-silane was found in the area shown in area (c) due to the corrosion of coating. Specimen was prepared from low carbon steel with Zn-Ni layer coating and silicate-silane over coating as shown in Figure 2. For the compositional analysis of corroded specimen, EPMA analysis was conducted. As shown in Figure 15, Ni content was reduced from 4% at area (a) to 2.3% at area (b), and Zn was eliminated from 22% at area (a) to 0% at area (b). On the contrary, Fe content was significantly increased from 1% to 75%. This could be explained by the exposure of low carbon steel substrate from the delamination of Zn-Ni coating layer by peroxide hydrogen. Composition ratio analyzed by EPMA is shown in Table 2. Through comprehensive evaluation of fuel resistance by additives, the strongest corrosiveness was found in peroxide hydrogen as shown in the previous figures. The next strong one was formic acid. Methanol and water itself did not significantly affect on corrosion, but they were considered to facilitate the activation of other addi- tives. 4. Conclusions In this study, corrosiveness evaluation of biodiesel on thin resin Cr-free steel sheets, which is currently used as fuel tank, was conducted, and the following results were deduced. 1) Peroxide hydrogen additive has the strongest corro- siveness. Coating and painting layer shows corrosion, and even substrate material is corroded with peroxide hydrogen. Figure 13. SEM image of Cr-free steel sheet before corrosion. Figure 14. Typical SEM image of corroded area in BD50 containing of H2O, formic acid, methanol, and peroxide hydrogen. (a) Corroded debris; (b) Substrate; (c) Zn-Ni layer. Figure 15. EPMA curves of specimen in BD50 containing of H2O, formic acid, methanol, and peroxide hydrogen. Table 2. EPMA analysis results of corroded area in Figure 13. (a) Corroded debris (b) Substrate Element Weight% Atomic% Weight% Atomic% C 51.82 73.36 14.38 40.04 O 16.54 17.58 6.53 13.65 Si 1.87 1.13 0.46 0.54 Ti 1.61 0.57 0.0 0.0 Fe 1 0.3 75.21 45.04 Ni 4.01 1.16 0.0 0.0 Zn 22.05 5.74 0.0 0.0  D.-J. YOON ET AL.499 2) For methanol, mixing with blended fuel shows the reduction in corroded area by reduction in the additive concentration. 3) Formic acid has weaker corrosiveness than peroxide hydrogen, but corrosion is occurred throughout all specimens. 4) Since water is not mixed well with fuel, it does not impact on corrosion significantly. However, water is eas- ily mixed with other additives and considered to facili- tate the corrosion by other additives. 5. Acknowledgements This work was supported by the POSCO research center. 6. References [1] M. G. Kang and J. H. Kim, “Biodiesel,” Auto Journal, Vol. 27, No. 2, 2005, pp. 12-19. [2] R. Umebayashi, N. Akao, N. Hara and K. Sugimoto, “Corrosion and Electrochemical Properties of Sn-8% Zn Alloy-Coated Steel in Methanol Containing of H2O, NaCl, and HCOOH,” Journal of The Electrochemical Society, Vol. 150, No. 7, 2003, pp. B295-B302. doi:10.1149/1.1574808 [3] R. Umebayashi, N. Akao, N. Hara and K. Sugimoto, “Corrosion and Its Mechanism of Al-10% Si Al- loy-Coated Steel in Methanol Containing of H2O, NaCl, and HCOOH,” Journal of The Electrochemical Society, Vol. 149, No. 3, 2002, pp. B75-B83. doi:10.1149/1.1447943 [4] K. Park and J. Jung, “A Study on Corrosion Characteris- tics of Suspension Material by Surface Processing,” Pro- ceedings of Korean Society of Automotive Engineering, No. 2, 2004, pp. 938-943. [5] J. Ryu and C. Shin, “A Study on the Properties of the Pre-sealed Steel Sheets Based on the Galvannealed Sub- strate for Automotive Body,” Proceedings of Korean So- ciety of Automotive Engineering, No. 3, 2005, pp. 1956-1961. [6] K. Kim and J. Park, “Automotive Body Steel Corrosion and Surface Treatment,” Journal of Corros. Sci. Soc. of Korea, Vol. 20. No. 1, 1991, pp. 103-119. [7] Y. Miyoshi and O. Maeda, “Fundamental Research on Corrosion Resistance of Precoated Steel Sheets for Automobiles,” Trans. ISIJ, Vol. 23, 1983, pp. 974-983. [8] T. Tsuchiya, “Japanese Standards for Diesel Fuel Con- taining of 5% FAME: Investigation of Acid Generation in FAME Blended Diesel Fuels and Its Impact on Corro- sion,” SAE Technical Paper, 2006-01-3303, 2006. Copyright © 2011 SciRes. ENG |