C. A. MANTILLA ET AL.
540
It is expected that the ensemble of updated models
matches better with the true data. However, in practice
when the updated models are again processed through
the flow simulator, the corresponding responses continue
to exhibit deviation from the measurements. This mis-
match reflects the inadequacy of the covariance-driven
updating scheme for capturing the non-linearity of the
transfer function (simulator) model. In order to achieve a
better match, the updating procedure is continued itera-
tively until a tolerable deviation is obtained. The whole
process is then repeated for the next time step (tk+1).
Once the deviation of updated model responses from the
measured data is acceptable, it is transferred to the opti-
mization module, and the well settings are re-evaluated
to maximize the production for the remaining time. The
wells are operated with the new operating conditions and
the monitoring/data acquisition step is continued.
The type and amount of data included in the responses
(d) plays an important role in the update of the uncertain
variable (K). More data assimilated not necessarily im-
prove the estimation. If the responses are highly corre-
lated to each other, as in the case of two downhole pres-
sure sensors located too close to each other, they can
bring redundant information with the natural noise asso-
ciated to a measurement without improving the estima-
tion. On the other hand, if few data are used, it becomes
difficult to update the model properly. This type of sensi-
tivity analysis would be useful to choose the best loca-
tion of the sensors that improves the updating process
without being redundant.
In this case, the types of data used are oil and water
rates. Intuitively, each type of data carries information
from different parts of the reservoir, for example water
rates are correlated to properties of an associated aquifer.
In other cases, data can be uncorrelated to the spatial
variations in reservoir properties and hence model up-
dated including such data will not necessarily improve
the predictability of the model. A sensitivity analysis on
the type of data is recommended to select the responses
according to the model updating objectives.
2. Synthetic Flow Model with a Horizontal
Well
2.1. System Description
A three dimensional rectangular synthetic reservoir was
created to run sensitivity cases on the type and amount of
data to be used for updating. Since water coning is a lo-
cal phenomenon unaffected by the pressure conditions in
the remaining reservoir, the near wellbore area is as-
sumed surrounded by a constant pressure boundary con-
dition. This is simulated by placing a set of oil injectors
replenishing the oil produced by the producers. The grid
is composed of 25 × 20 × 20 blocks in x, y and z direc-
tions respectively. Local grid refinement is performed
near the well. A constant porosity value equal to 0.1 is
set. A horizontal well is completed in the middle of the
layer and spans a length of six grid blocks in the x direc-
tion for a total length of 240 ft. The dimensionless well
length (Lwell/Lreservoir) is 0.1.
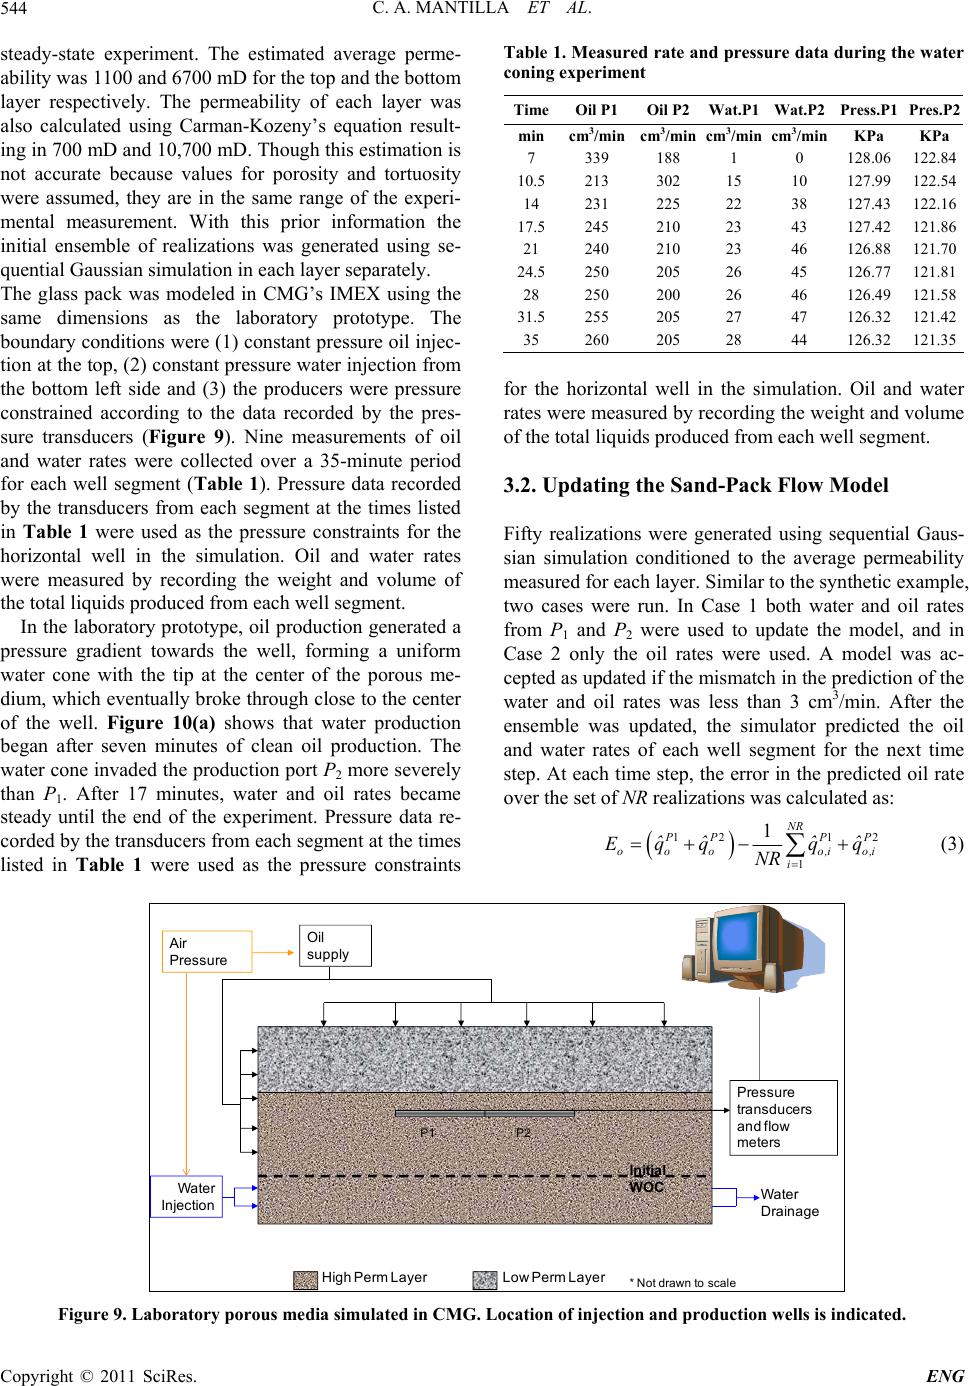
The well has 3 segments whose center points are
regularly spaced 80 ft apart. The well production is con-
strained by the bottomhole pressure in the toe (P1), and
the bottomhole pressure at the other two segments (P2
and P3) is calculated from frictional pressure gradient.
An active aquifer is beneath the oil reservoir, and the
oil and water rate data for each segment are used for up-
dating the prior geological model. The reservoir property
to be updated is the permeability value in all grid-blocks
which is spatially distributed using a semi-variogram
with a range of 15 grid-blocks in x. The average perme-
ability of the reference reservoir is 100 mD.
An initial suite of 40 realizations was generated using
sequential Gaussian simulation sampling from a log-
normal distribution with mean 180 mD and standard de-
viation 50 mD. The permeability field was updated in the
normal (log-transformed) space, so that it is guaranteed
to be positive after back-transformation to the original
space. As shown by Evensen [8], the distribution of the
variable of interest in Ensemble Kalman Filter should be
Normal for the updating equation to work properly.
2.2. Results and Discussion Synthetic Flow
Model
Water broke in the well after 726 days of net oil produc-
tion, initially through segment P2. Water arrives first to
the central perforation because the apex of the cone is
centered within the well path, as observed on the satura-
tion map shown in Figure 2. Once water breaks into P2,
the oil rate decreases as consequence of the reduction in
the relative permeability to oil in that grid-block (Figure
3); the other two segments maintain the oil rate for a
short time until water makes its way to those grid blocks.
The total duration of the simulation was 1500 days. Al-
though the reservoir simulator reports data every week,
for simplicity only 5 time steps of 300 days each were
used to update the model. Before water breakthrough the
model was updated by only using oil rates. Subsequently
water rates were also included as part of the sensitivity
analysis.
Effect of data type. Oil and water rates are the two
types of data available to update the model. The objec-
tive is to select the best data wo cases were to update. T
Copyright © 2011 SciRes. ENG