 Journal of Applied Mathematics and Physics, 2014, 2, 1009-1021 Published Online October 2014 in SciRes. http://www.scirp.org/journal/jamp http://dx.doi.org/10.4236/jamp.2014.211115 How to cite this paper: Fan, J.J., Guo, J.Q., Zhang, S.Q. and Ji, X.F. (2014) CO2 Geological Storage Suitability Assessment of Sichuan Basin. Journal of Applied Mathematics and Physics, 2, 1009-1021. http://dx.doi.org/10.4236/jamp.2014.211115 CO2 Geological Storage Suitability Assessment of Sichuan Basin Jijiao Fan, Jianqiang Guo, Senqi Zhang, Xiaofeng Ji Center fo r Hydrogeology an d Environmental Geology Su rvey , CGS, No.1305, Qiyi Middle Road, Baoding, 071051, Heb ei Province, Chin a Email: jiaxiaofengdaxia@163.com, gjq@vip.163.com, senqizhang@126.com Received August 2014 Abstract The paper choos es th e sec onda ry tecton ic u n its of Sichuan Basi n as th e e valua tion object , and con- siders regional crust al s t ability condi tio ns, basic geol ogic al condi tions, reservoir and cap roc k conditions , stora ge p ote n tial c onditio ns, geo the rmal co nditi ons, research d egree and po ten tial resources condi tions, soci al and economi c co ndition s as fi rst-lev el indexes . B ased on collec ted da- ta and a comprehensive a nalysis of 16 lev el-tw o ind exes and 9 level-three in dex es, and wi th th e application of compreh ensive index m eth od , the co nclusions reg arding th e s uitabili ty p arti ti on of the seco ndary tec tonic u n its of Sichuan Basi n a re as foll ows : Centr al Sichuan low-fla t stru ctu r al belt is highly suitable f or c arb o n dioxide geologic al s tor ag e, W est Sichuan low- slope structu r al b elt is relativel y suitabl e, and SW low-slope structur al bel t is unsui table f or carbon dioxide geological stora ge, South Sichuan low-slope struc tur al bel t is relativ ely unsu ita ble, whereas E as t Sichuan high-slope faulted fold b elt, and No rth Sichuan low-flat s tru ctu r al b elt are fa irly suitabl e for car- bon dioxide geological stor age. Based on th e a bov e, with a compreh ensive analy sis of co rre s- ponding hyd rog raph ic and geolog ical condit ions, and at the same time consid ering the non-c ov- ered oil or g as res ou rce s and the bu ried s tru ctu re , si x CO2 ge ologi cal targe t fo rmati ons are iden ti- fied, includ ing lowe r Jurassic Ziliujing Gr oup , upper Tri assic Xu j iah e Grou p , middle Triassic Lei- koupo Group , low er Triassic Jialingji ang Grou p and Feixian guan Group , an d lo wer Permian Qixia Group . Thi s paper provides an important guidance and referenc e for the selection crite ri a of CO2 geologi c s tora ge sites in Sichuan Basin. Keywords Suitability E valua tion, Sichuan Basin, Geologic al S to rag e of C ar bon D ioxide, Tectonic Un it 1. Introduction With the establishment of operational targets regarding controlling greenhouse gas emissions, as well as the ap- propriate policy measures and actions put forward by the State Council, Chinese enterprises with high energy consumption and high carbon dioxide emissio ns are facing tremendous pressure to reduce emissi ons. To alle- viate the pressure and to develop the green and low-carbon economy, some companies start to focus on carbon dioxide capture and storage by taking so me actions.  J. J. Fan et al. China CO2 emissions are approximately 8 billion tonnes per year. Therefore Chines e govern ment and compa- nies are playing an increasingly prominent role in assessment and development of CCS technologi es. The activi- ties in Chi na include indigenous research and development, colla borative research with i nt ernational entitie s, learning from other countrie s thr ough knowledge shar ing, and development of demonstration or full-scale projects. Between 2010 and 2012, China has carried out ca rbon dioxide geological stor age potential evaluation and suitabili ty assessment, and has finished CO2 geological storage suitabilit y assessment at both regional and basin-scales [1]-[5]. Potential and suitability assessment of CO2 geological storage was divided into five sta ges, with each stage focusing on a smaller scale area and increasing the level of precision for the storage capacity es- timate (Figure 1). The first stage is re gi onal-scale, and the study object is individual basin, the second sta ge is basin-scale, and the study object is the first or second tectonic units, and so on until completion of the inj ec- tion-scale assessment. The “ta rget scale” ser ves as a transition between the basin-scale and site-scale stages. For this article, t he basin scale research was based compilation of existing maps, devel op ment of some new maps, and calculatio n of stor age capacities. In general, the capacit y assessment was conducted using methodologies published under the Carbon Sequestration Leadership Forum (CSLF) as presented in [6]. The suitability assess- ment was conducted by othe r professors work [7]-[10]. Based on technical requireme nts of the project “natio nal CO2 geological stor age poten tial evaluation and suitability assessment” impleme nted between 2010 and 2012, this paper carried out t he basin-scale assessment in Sichua n Basin. CPI constructed the first domestic 10,000 ton level “CO2 capture and liquefaction p l ant” for their coal-fir ed power plant named Shuanghuai Plant in Hechuan Town (Figure 2) in November, 2009. The Hechuan Town lo- cated in the Cho ngqing Province in Sichuan Basin.The primary objective is to deter min e the feasibilit y for sto- rage of about 100,000 tons per year CO2. In addition, consideration is also given to the expansi on to about 1,000,000 tons per year as the future target [11]. During mid-2012, our team was selected by Battelle to assist them in geolo gic st orage assessment. 2. Study Area and Carbon Emission Sichuan Basin is located in Sichuan-Chongqing area, between 28˚ - 32˚40′ north latitude and 102˚30′ - 110˚ east longitude , with a total area of 260,000 km2. Sichuan Basin, one of the four largest basins in China, is also called Bashu Basin, Xinfeng Basin or Purple (Red) Basin. The outline of Sichuan Basin is of rhombus shape, Fig ure 1. Stages of CO2 geological sto rage asses s ment in China. 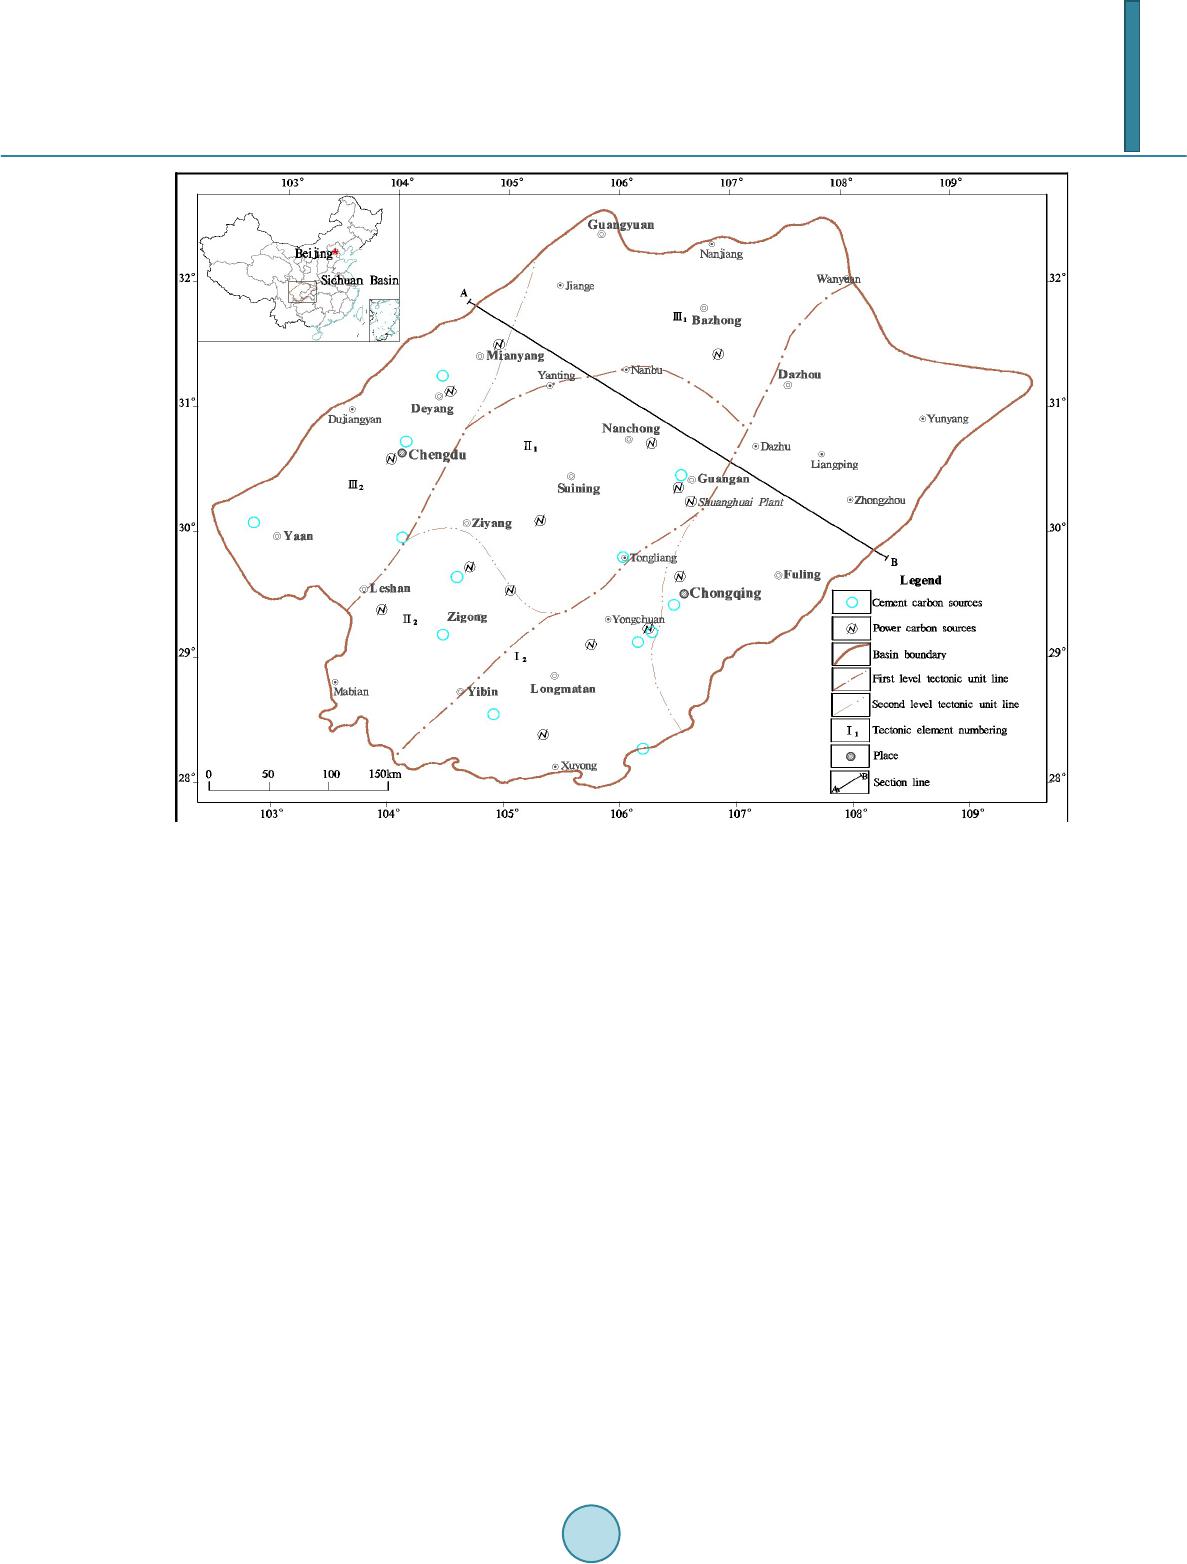 J. J. Fan et al. Figure 2. Location of the Sic h uan Basin and carbon sources. containing the east part of Sichuan Pr ovince, most of Chongqing and t he junction zone of three provinces: Hubei, Guizhou and Yunnan. Cons i dering its geo graphical variations, Sic huan Basin can also be divided into three parts: Chengdu Plain in the west of Sichuan, hilly areas in the middle, and parallel ridge-valley region in the eastern Sichuan. The Sichuan Basin is the most important gas-producing basin in China , the amounts of natural gas resources are the largest in China, accounting for about one -fourth of The total national gas production. It is also one of the most important hea vy industrial zones in China, having a large number of CO2 emissi on sources such as power plants, cement production plants, and steelworks. The main sources of carbon emissions are the two pro- vincial capitals (Chengdu and Chongqing) and the fourteen large cities (Ya’an, Meishan, Leshan, Ziyang, Zi- gong, Luzhou, Yinbi , Suining, Nanchong, Guanga n, Mianyang, Bazho ng, Dazhou and Guangyuan). Four para- meters (emission amount of power plants and cement production plants of Chen gdu and Chongqing) have been collected to assess the amoun t of carbon emission in the Sichuan Basin. Chongqing and Sichuan’ results are of the s ame order of 108 t magnitude according to China statis tic s yearbooks of 2008a (National Bureau of Statis- tics of China, 2008). The economic circle can be divided into Chengdu centered Western Sic huan economic zone (W estern Sichuan eco no mic belt), Chongqing centere d Chuanjiang eco no mic zone (Chuanjiang econo mic belt) and Nanc hong centered North-Central Sichuan economic zone. Compared with the experi mental, the total carbon emission is referring to the energy consumption related to economic development and GDP. Along with economic growth and people’s energy co nsumption demand increase, the carbon emission amou nt must be a rising tendency. It is one of the mos t rapidly developing areas with large energy consumption and CO2 emission, carbon capture and storage is probable and urgently needed. 3. Evaluation Method China’s CO2 geological stora ge suitability at basin scale could be classified as 7 first-level evaluation indexe s :  J. J. Fan et al. (1) regional crustal stability conditions, (2) basic geological conditions, (3) reservoir and cap-rock conditions, (4) potential conditio ns of storage, (5) geothermal geological conditions, (6) research degree and resource potential conditions, and (7) socio-economic conditions (Table 1). and 16 second-level indexes (Table 1) and 9 third- level indexes (Table 2, Table 3), and as shown at with 5 levels for each index as 9, 7, 5, 3 and 1, representing conditions of highly suitable, suitable, generally suitable, unsuitable and highly unsuitable (Tables 1-3). The synthetic al index for each secondary tectonic unit co uld be calculated according to the following formula [12]: where, P represents the synthetical index of CO2 geological storage suitability within second-order tectonic units in the basin; represents a given index of the ith evaluation factor, and here has values of 9, 7, 5, 3, or 1 as assigned as a evaluation result of each index through comparing with ranking conditions listed in Table 1-3, as described in chapter 4, that is, The indices of is given by professors group according to existing infor matio n. represents the weight of the ith index, which is given by professors group according to their experience value. Table 1. Carbon dioxide geological storage suitability evaluation system. Index lay er s Wei gh t Evaluation Index sub-lay er s Wei g h t Highly suitable Relatively suitable Fairly suitable Relatively unsuitable unsuita ble Crustal Stability 0.37 Crustal Stability 0.370 Stab le Basically stable Slightly unstable Less stable unstable Bas ic Geologic al Condition of tectonic unit 0.07 Ar e a/km2 0.033 S > 10000 5000 < S ≤ 10000 500 < S ≤ 5000 1 00 < S ≤ 500 S < 100 Sedimentary Depth/m 0.033 H > 3500 2500 < H ≤ 3500 2 500 < H ≤ 1500 1500 < H ≤ 800 H < 800 0.22 Seal 0.078 highly suitable suit ab le p oss ible unlikely unsuitable Reservoir stratum 0.078 highly suitable suit ab le p oss ible unlikely unsuitable Comb ination 0.067 Regional seal, Independent seal Regional seal, self-reserv oi r and self-sea l Local seal, Independent seal Local seal, self-reserv oi r and self-sea l NO Predicted potential 0.16 Pred i c t ed pot enti a l/10 8t 0.094 M > 50 25 < M ≤ 50 0.5 < M ≤ 25 0.02 < M ≤ 0.5 M < 0.02 Predicted potential per area/(10 4t·km −2) 0.063 m > 200 100 < m ≤ 200 50 < m ≤ 100 1 < m ≤ 50 m < 1 0.12 Geothermal gradient/ [˚C·(100 m) −1] 0.049 G < 2.0 2.0 < G ≤ 3.0 3.0 < G ≤ 4.0 4.0 < G ≤ 5.0 G > 5 Geothermal heat flow value(mW·m−2) 0.049 q < 54.5 54.5 < q ≤ 65 65 < q ≤ 75 75 < q ≤ 85 q > 85 Land Surface Tempera t ure/ ˚C 0.025 t < −2 −2 < t ≤ 3 3 < t ≤ 10 10 < t ≤ 25 t > 25 and 0.04 Exploration Degree 0.022 Devel o p men t High G en era l Low No Data supply 0.011 Full, reliable dat a Less full dat a General full data Not sufficient dat a No data Resources potential 0.004 large Relatively large G en era l Relatively less less Social & Econ omic Condi tion 0.02 Population density (Person/k m2) 0.013 P < 50 50 < P ≤ 100 100 < P ≤ 200 200 < P ≤ 1000 P > 1000 Land use types 0.009 Desert , lan d no using Grassland Woodland Arable land Sett lem en t s waterbody Score 9 7 5 3 1  J. J. Fan et al. Table 2. Reservoir ran ks. Reservoir Evalu ati on Index Weigh t Highly suitable Relatively suitable Fairly suitable Relatively unsuitable Unsu ita b le First reservoir lith olog y 0.25 Clastic rocks Mixed clastic and carbonate carbonate metamorphic rocks, salt dome etc. No depth 0.15 1500 ≤ H ≤ 2000 2000 < H ≤ 2500 2500 < H ≤ 3000 3000 < H ≤ 3500 H > 3500 Porosity (%) 0.3 φ ≥ 25 20 ≤ φ < 25 10 ≤ φ < 20 5 ≤ φ < 10 φ < 5 −3 2 0.3 K ≥ 1000 500 ≤ K < 1000 50 ≤ K < 500 1 ≤ K < 50 K < 1 Secon d r eser voi r stra tu m Same to First reservoir … Table 3. Seal ranks. Seal Evaluation Index Weigh t Highly suitable Relatively suitable Fairly suitable Relatively unsuitable Unsui tab le First seal Lithology 0.2 Gypsum, mudst on e, calc i lut ite Mudstone conta in aleurite, sand Arena c eo u s, siltstone mudst on e Argillaceous sandstone, Argillaceous siltstone Sha le, com pact limestone The distribution of continuity 0.25 continu ou s, stea d y more continuous, more steady Midd le Poorer conti nu ou s, poorer steady discontinuous single layer 0 .1 h ≥ 20 10 ≤ h < 20 5 ≤ h < 10 2.5 ≤ h < 5 h < 2.5 gross thickness 0.2 h ≥ 300 150 ≤ h < 300 100 ≤ h < 150 50 ≤ h < 100 h < 50 permeability 0.25 K < 0.001 0.001 ≤ K < 0.01 0.01 ≤ K < 0.1 0.1 ≤ K < 1 K > 1 Same to First seal … of every level indexes satisfy the condition: represents the total number of evaluation factors, and here n = 9 for third-level indexes, n = 16 for second- level indexes and n = 7 for first-level evaluation indexes. The results of synthet i cal index scores P of individual are in the ran ge of [1] [9], to make the results distri- butes mo re aver age between [0, 1], the synthetic al index scores P are normalized according to: , 1~6,1~6 , 1~6, 1~6,1~6 min max min ii ii ii ii ii PP PPP = = = = = − =− As a result of this process, each second-order tectonic units in Sichuan basin being screened and ranked by Table 4. 4. The Analys is of Suitable Conditions 4.1. Geologic Structure The interior Sichuan Basin is divided into six second-level tectonic units, includ i ng East Sichuan high -slope faulted fold belt, So uth Sichuan low-slope structural belt, Central Sichuan low-fla t struc tura l belt, SW low-slope struc tura l b elt, Nor th S ichuan low-flat structural belt, Nor th Sichuan low-flat struct ural belt and West Sichua n low-slope structural belt, with corresponding area and deposition thickness shown in Table 5 [13].  J. J. Fan et al. Table 4. Comparison table of number range of P valu e and evaluation result. Evaluation Result Highly suitable Relatively suitable Fairly suitable Relatively unsuitable unsuitable Number Range of P 0.8, 1 0.6, 0.8 0.4, 0.6 0.2, 0.4 0, 0.2 Table 5. Tectonics units in Sichuan Basin. No Secon d -level tectonic units Area (km2) Deposition thickness (m) I1 East Sichuan high-slope faulted fold belt 50,000 10,000 I2 South Sichuan low-slope structural belt 26,000 8000 II1 Central Sichuan low-flat structural belt 37,000 9000 II2 Southwestern low-steep fold belt 21,000 7000 III1 North Sichuan low-flat structural belt 34,000 12,000 III2 West Sichuan low-slope structural belt 32,000 10,000 4.2. Regional Crustal Stability According to Yang X.’s resea rch results [14], for the a vailable seismic network r ecord between1970 a nd 2010, the number of earthqua kes with ML ≥ 2.0 in Sichuan Basin and its periphery is 33646, and the number of earth- quake s with ML ≥ 2.0 in Sic huan Basin is 9058. The number of earthq uakes with focal depth record and with ML ≥ 2.0 in this basin is 4271, where in the shallowest one is 1 km, the deepest one is 60 km and the majority is within the range of 5 - 30 km, belonging to shallo w-focus eart hquake. According to the research of Zhang J. et al., the occurrence of the next ea rthqua kes with eight ma gnit udes in Sichua n should be between 2041 and 2042 [15], and it is substantially sufficient for the car bo n dioxide storage field to run for 30 years. According to GB18306-2001 [16], the ma p of Chinese seismic peak acceleration, it can be seen that seismic peak acceleration values from eastern high and steep fold belt are less tha n or equal to 0.05 g, values fr om southern low-steep fold belt are 0.05 g, va lues from middle gentle fold belt are less than 0.05 g, values from southwestern low-steep fold belt are within the range of 0.05 g and 0.1 g, values from nort hern low-steep fold belt was 0.05 g, and val ues from western low-steep fold belt are within the ran ge of 0.1 g and 0.2 g. Overall, t he central and eastern basin area has the highest stability level. The large-ma gnitud e earthqua ke wit h magni tude 8.0 occurred in Sichuan Wenchuan on May 12, 2008, with its significant influence along the Yingxiu-Bei chuan fault zone to Ningq i ang County in Shaanxi of Qingch uan fault zo ne [17]. A comprehe nsive analysis s howed that the crust stability conditio ns for carbo n dioxid e geological storage in Sichuan Basin is relatively high in Central S i chuan low-fla t s t ruct ural be lt, but the rest area, including East Si- chua n high-slope faulted fold belt, South Sic huan low-slope structural belt, North Sichuan low-flat structural belt, SW low-slope structural belt and West Sichuan low-slope structural belt is unsuitable for carbon dioxi de geological storage. 4.3. Reservoir-Cap Combination of CO2 Geological Storage Sichuan Basin is an Artesian Basin consisting of Permian and T riassic strata. The first set of regional seal cov- ering the whole basin is Jurassic Shaximiao Group, whereas the second set is Suining Group and Penglaizhen Group. According to field sur vey, shale cont ent in Shaximiao Group is mor e than 50%. The S uinin g Group mainly consis ts of b rown-red mudstone a nd sandy mudstone with siltstone thin layer. Pengl aizhen mainly con- sists of gray a nd sandy mudstone , as well as multiple la yers of marl and siltsto ne. These two sets of covering caps are relatively stable [18]. Jurass ic is distributed in southeast platea u area, middle gentle uplif t, and northwest dep ressions of Sichuan Basin. Some strata are mis sing in East Sichuan high -slope faulted fold belt, South Sichuan low-slope structur al belt and SW low-slope structural belt except for the middle and lower part. Considering the risk of leakage , only the lower part of Jurassic Ziliujing Group is considered as carbon dioxide geological stor age site. Specifically,  J. J. Fan et al. the lenticular sand body of lower part of Jurassic Ziliujing Group is considered as the exact site for carbon dio- xide geological storage. Water alternating phenomenon is strong around mountains at the edge of the basin or at the eastern separated file fold anticline area. Since it is the infiltration type of fresh wate r in these places, they are not appropriate for carbon dioxide storage. By contrast, the anci ent sealed water with sedimentary origin is found in the d eep p art of Triassic strata, and this is the right place for carbon dioxide geological storage [19]. According to the researc h of Wang J. [20] the average porosity of reservoir mat rix of fractured sand stone in Sichuan Basin is about 4%, the average porosity of carbonate matrix is less than 2%, a nd the average porosity of the porous carbonate reservoir is within the ran ge of 4% and 6%, with permeability mo re than 1 md. By contrast, sandstone porosity is approximately 4.5%, with per meability less than 0.01 md. Therefore, it could be concluded that t he distribution of the porosity and permeability in Sichuan Basin is 5 ≤ φ < 10 and K < 1, which represents less suitab le and unsuitable conditions, respectively. According to Zhang K. [21], based on thickness values of stora ge reservoirs in Sichuan Basin derived from corresponding contour maps and the areas of different tectonic unit, t he volume of secondary tectonic units coul d be obtained, among which eastern high and steep fold belt accounts fo r 25.21%, northern low-steep fold belt ac- counts for 21.25%, western low-steep fold belt accounts for 17.09%, southern low-steep fold belt accounts for 7.56%, southwestern low-steep fol d belt accounts fo r 8.99%, and middle gentle fo ld belt acco unts fo r 19.9%. A compr ehensive analysis of reservoir-cap in Sichuan basin shows tha t East Sichuan hi gh-slope faulted fold belt is relatively unsuitable for carbon dioxide geological sto rage. By contrast, Nor th Sichuan low-flat structur al belt, West Sichuan low-slope structural be lt, S outh Si chuan low-slope struc tura l b elt a nd SW lo w-slope struc- tural belt are relatively suitable, and Centra l Sichuan low-flat structur al belt is the best place for carbon dioxide geological storage. 4.4. Geothermal and Geological Conditions Geothermal gradient between middle ge ntle fol d belt and SW low-slope structural belt in Sichuan Basin is rela- tively high, ranging from 24 to 30˚C/km. The ge otherma l gr adie nt of Weiyuan tecto nic zone is more than 30˚C/km. The geothermal gradie nt b et ween East Sichua n high-slope faulted fold belt and North Sichuan low-flat struc tura l b elt gradually decreases to 20˚C/km. Also, the geothermal grad ient of the outer edge of the northe as- tern Sichuan is as low as 16˚C/km. On both sides of Central Sich uan low-flat s t ruct ural belt and West Sichuan low-slope structural belt, the geothermal gradient is maintained a round 20˚C/km. The piedmont fractured de- veloped in northeastern Sichuan could lead to the downward infiltration of gro undwater, which would future cause the reduction of local geothermal gradient so that it is much lower than the ave rage level. Terrestrial heat flow values in Sichuan Basin are within the range of 35.4 and 68.8 mw/m2, with the ave rage value as 53.2 mw/m2, which is similar with low heat flow character istics of other typical cratonic basins all over the word. As to the aspect of regional distribution, terrestrial heat flow is obviously affected by the base struc- ture. Terrestrial heat flow values of uplift area are within the ran ge of 60 and 70 mw/m2, val ues of depression area are below 60 mw/m2, a nd value s could be even less than 40 mw/m2 near the leading edge of the fold belt of Daba Mo unt ain, which is located in the northeastern Sichuan [22]. According to annual average temperature statis tics of the Si chuan Basin, Chongqing, Yibin and Chengdu be- tween 1997 a nd 2005, the derived average temperature in Sichuan Basin is 17.9˚C. Specifically, t he ave rage temperature in East Sichuan high-slope faulted fold belt or South Sic huan low-slope structural belt is 18.6˚C, the average temperature in Centr al Sichuan low-flat structural be lt or southwestern lo w-steep fold belt is 18. 3˚C, and the a verage temperature in North Sichuan low-flat structural belt or western low-ste e p fold be lt is 16.8˚C [23]. A comprehe nsive ana lysis of geothermal geological co nditions in Sichuan basin shows that East Sichuan high-slope faulted fold belt, Sout h Sichua n low-slope struc tura l belt, Central Sichuan low-flat structural belt and West S i chuan low-slope structural be lt is relat ively suitable for carbon dioxide geologic al storage. By contrast, SW low-slope structura l belt and North Sich uan low-flat structural belt are not suitable for carbon dioxide sto- rage purpose. 4.5. Storage Potential Conditions When CO2 geological storage potentials in deep saline aquifers are calculated, it is necessary to consider the vo-  J. J. Fan et al. lume of the aquifer, satura tion of CO2 trapped after formation water countercurrent, porosity of saline aquifer, densi ty of CO2 under the conditions of formation water, th e density of the initial formation water and the solu- bility of CO2 in saline aq uifers [6]. According to the distributed a rea and thickne ss of the reservoir described in 4.3, the reservoir volume of every reservoir located 800 m depth below in every secondary tectonic unit could be calculated, and the eval uation of D grade inferred potential of CO2 geological storage in deep saline aquifers of secondary tectonic units in Si- chua n Basi n is shown in Table 6. Based on parameters of CO2 geological storage potentials in deep saline aquifers, gr ade D constructive poten- tials of CO2 geological storage in every secondary tectonic unit of Sichuan Basin could be calculated, among which stora ge potentials of East Sichuan high-slope faulted fold belt reach the ma ximum value and account for 27.55% of the total stor age capacity of deep saline aquifers. Also, stora ge potentials of West Sic huan low-slope struc tura l belt account for 15.62% of the total storage capacity. Storage potentials of Central Sichuan low-flat structural belt account for 20.33% of the total storage capacity. Storage potentials of SW low-slope structural belt account for 7.48% of the total storage capacity. Storage potentials of North Sichuan low-flat structural belt account for 22.30% of the total storage capacity. By contrast, storage potentials of South Sichuan low-slope struc tura l belt have the minimum value and account for 6.72% of the total storage capacity. Storage potentials and per unit area storage potentials of the secondary tectonic units of Sichuan Basin are 0.5 < M ≤ 25 and 1 < m ≤ 50, respectively. A comprehensive analysis indicates that storage potential conditions of the secondary tectonic units in Si- chuan Basin are generally suitable. Table 6. Evaluation of D grade inferred potential of CO2 geological storage in deep saline aquifers of secondary tectonic units in Sichuan Basin. Type of storage Tectonic unit Saline aquifers high -slop e low-slop e low-fla t structura l low-fla t low-slop e D grade inferred potential of residual gas mech an i s m (×106t) Jurassic Ziliujing Formation 383.97 175.95 219 .77 128.80 227.79 208.00 The Upper Triassic Xujiahe Formation 455.83 226.34 276 .64 135.26 280.94 312.00 The Middle Triassic Leikoupo Formation 939.60 0.00 2433.17 988.01 1556.56 2273.52 The Middle Triassic Jialing River Formation 5972.84 1144.29 2852.89 864.51 3097.99 2614.89 The lower Triassic Feixianguan Formation 3127.35 1144.29 2093.66 864.51 3769.42 796.26 Lower Permian Qixia Formation - - - - - 142.10 total 10879.58 2690.86 7876.14 2981.10 8932.70 6346.77 Grade inferred potential of dissolution mech an i s m (×106t) Jurassic Ziliujing Formation 28.49 14. 70 14. 76 11. 83 8.95 8.93 the Upper Triassic Xujiahe Formation 19.04 10.64 15. 50 6.99 11.04 13.40 The Middle Triassic Leikoupo Formation 18.12 0.00 293.64 51.09 2 8.26 57. 43 The Middle Triassic Jia lin g River Formation 443.16 53. 81 222 .78 44. 71 121.79 1 12.31 The lower Triassic Feixianguan Formation 182.02 5 3.81 117 .31 44. 71 263.27 15.79 Lower Permian Qixia Formation - - - - - 3.59 total 690.82 132.97 663.98 159.34 433.31 211.45 Total (×106 t) 11570. 40 2823.83 8540.12 3140.43 9366.01 6558.22  J. J. Fan et al. 4.6. Research Levels and Resource Potentials The exploration of Sichuan basin co uld be considered as under a developmental state. Each secondary tectonic unit has its own drilling well control system so that the suit a b ility assessment could be done based on the infor- mation of local resource potentials. According to the latest resource evaluation results of 2002, oil resources are only founded in the middle, eastern and nort hern blocks of Sichuan basin, among which the middle block of the basin has the highest level of oil sto rage, accounting for 48% of total oil storage. By contrast, the eastern a nd nort hern blocks of Sichuan basin have 29% and 23% of total oil storage, respectively. By contrast, gas resources are found in all six blocks of the basin, among which the eastern block has the highe s t leve l of gas storage, ac- counting for 43.26% of total gas storage. For other blocks, ga s storage from the highest to the lowest level is in the order of western block (23.46%), middle block (12.43%), northern block (9.65%), southwestern block (6.22%) and southern block (4.98%) [24]. A compr ehensive anal ysis reveals that both the Centr al Si chuan low-flat structural be lt and the East Sichuan high-slope faulted fold belt are highly suitable in terms of research levels and resource potentials of the second- ary tectonic units. Similarly, North Sichuan low-flat structural belt is relative ly suitable, and West Sichua n low-slope structural belt is fairly OK. By contrast, South Sichuan low-slope structural beltand SW lo w-slope struc tura l belt are unsuitable. 4.7. Social and Economic Conditions According to the natio nal standard Land Use Classification [25], remot e sensin g t echnique has been app lie d to Sichuan basin in order to better understand current land use status, with land use status of six secondary tectonic units shown in Table 7. According to relevant report [26], the statistics of population density within different secondary tectonic units could be derived. The density of eastern high and steep fold belt is 350 persom/km2, the density of southern low-steep fold belt is 335 person/km2, the density of middle gentle fold belt is 490 person/km2, the density of southwestern low-steep fold belt is 418 person/km2, the density of North Sichuan low-flat structural belt is 275 person/km2, and the density of West Sichuan low-slope structural belt is 591 person/km2. 5. A Comprehensive Evaluation The partition evaluation results of Sichuan Basin seco nd-grade structural units’ suitability is as shown in F igure 3, Table 8 and Table 9. The subsurface reservoirs are Lower Jurassic Ziliujing Formation, Upper Triassic Xu- jiahe Formation, Middle Triassic system Leikoupo Formation, Lower Triassic system Jialingjiang Formation and Feixianguan Formation, and the Qixia Formation in the lower part of Permian System. There is a risk of leakage in Huanyin fault zone in the reservoir of Lower Jurassic Ziliujing Formation, Upper Triassic systems Xujiahe Formation and Triassic system Leikoupo formation, but due to the impact of the Longmenshan and Huanyin thrust fault smearing, the reservoir of Lower Triassic Jialingjiang Formation, Feixianguan For mation and the lower part of Permian Qixia Formation have a sealing effect for the goal reservoir to some extent (Figure 4). Table 7. Descriptions of land use area in Sichuan Basin. Tectonic units Agricultural acre age (km 2) Settlement (km 2) Woodland (km 2) Water body (km 2) Bare land (km 2) East Sichu an high-slo p e fa u lt ed fold belt 2712 4. 3 152.5 21518 742.7 South S ic hu an low-sl ope st ruct ural b elt 1 4945. 8 3 2.9 1 160 0.8 515.1 162.5 Cen t ra l S ich ua n low -flat structural belt 35242.9 4 9.6 335.1 1268.9 SW low-slope st ructu ral bel t 1 4928 8 0.2 5926 .4 371.5 133.5 North S ic hu an lo w-flat structural belt 2 278 2.7 2 7. 8 1076 1. 4 392.4 West Si ch u an low-slop e st ruc tura l belt 1 744 5.9 250.2 12869.9 1699 .8 902.3 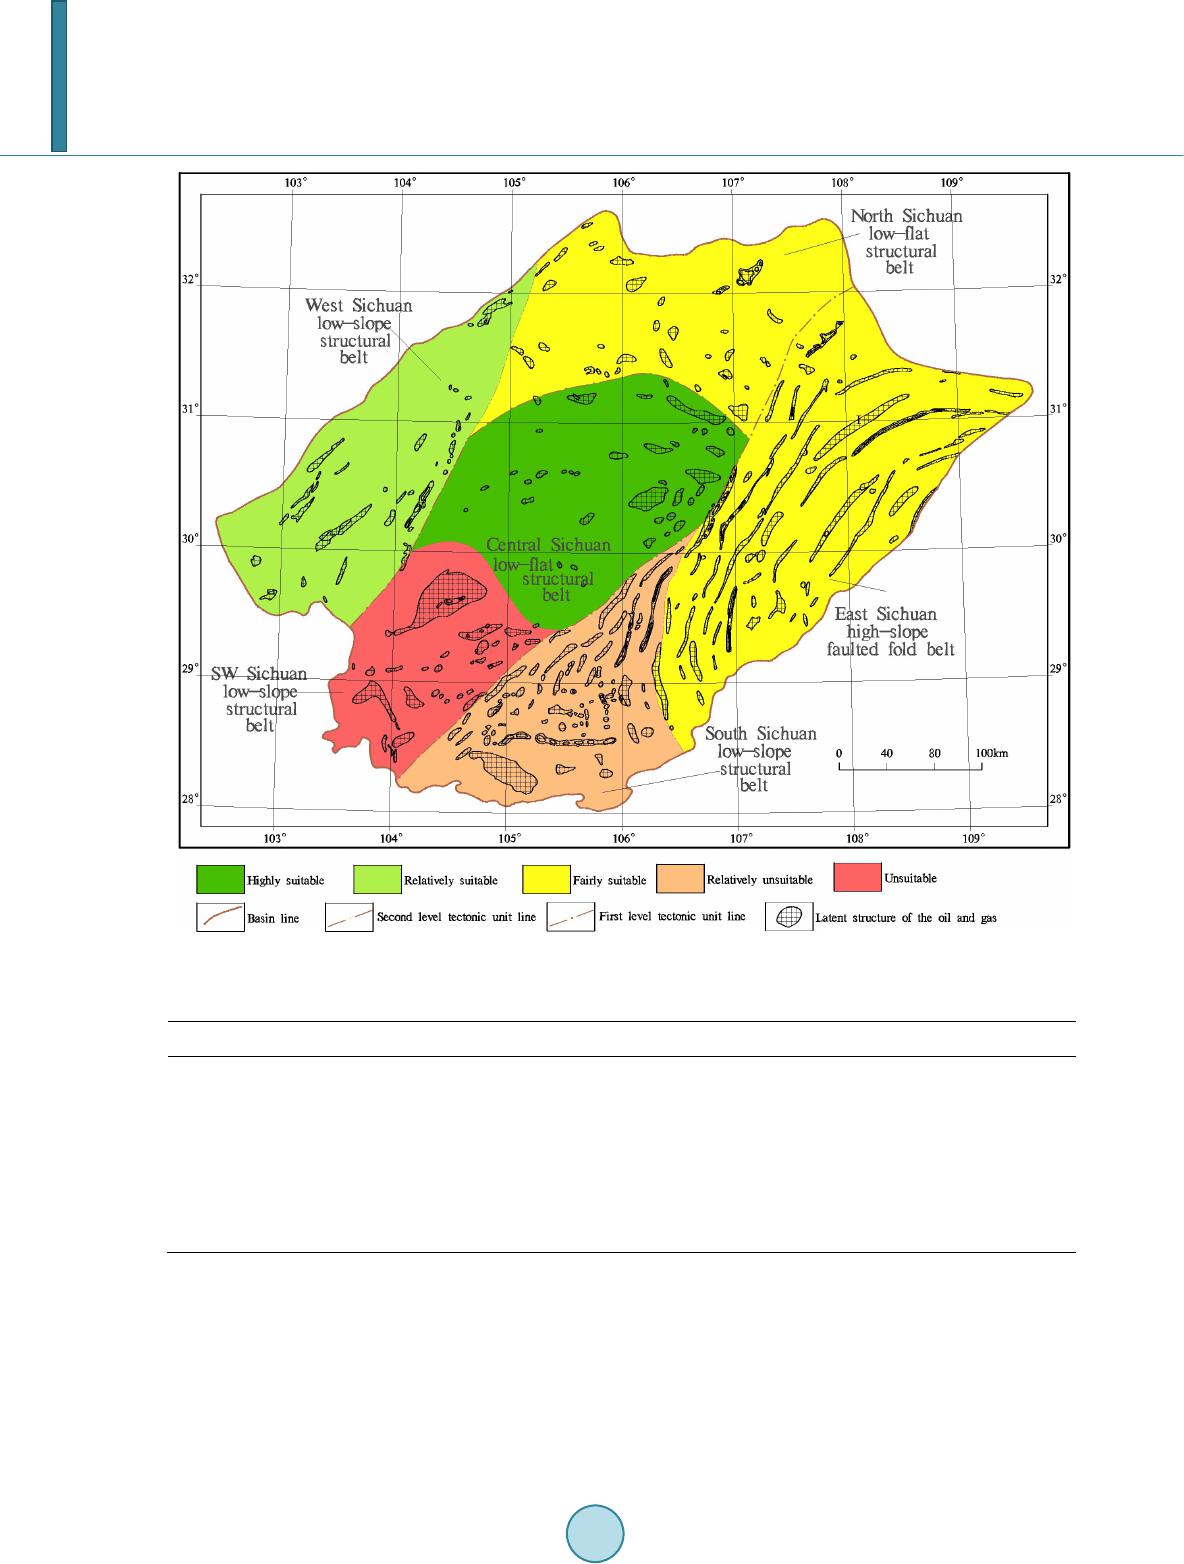 J. J. Fan et al. Figure 3. Map showing of a comprehensive evaluatio n r esu lt . Table 8. P value and Evaluation result table. Tectonic units P value Normalization result Evaluation result West Sichuan low-slope structural belt 5.24 0.079 Relatively suitable SW low-slope structural belt 5.06 0.000 Un sui ta b le South Sichuan low-slope structural belt 5.79 0.320 Relatively unsuitable East Sichuan high-slope faulted fold belt 6.03 0.425 Fairly suitable North Sichuan low-flat structural belt 6.42 0.596 Fairly suitable Central Sichuan low-flat structural belt 7.34 1.000 Highly suitable Fractured water-bearing formation of Carbonate rock is mainly developed in the east side of hanging wall in the Huanyin mountains fault, and the carbonate rock fissure cave water outcrops in the form of spring. The leaking of the fault spring in the west side are mainly far away from the fault, having nothing to do with the deep fault; and west side part which is near the fault, have no spring water dew point [27] [2 8 ] . It can be inferred that the footwall of the west side of Huanyin mountains fault has good water-blocking properties, and can produce fault sealing effect, so it is good for deep saline aquifers geological storage of carbon dioxide. Therefore, it can be determined that as for reservoir of the Lower Triassic Jialingjiang Formation, Feixianguan Formation  J. J. Fan et al. Table 9. Sichuan Basin geological storage of carbon dioxide suitability evaluation results. of first level Index layer Indicator Weight of Second level East Sichuan high-slope faulted fold belt South Sichuan low-slope structural belt Central Sichuan low-flat structural belt Decription Assignment Decription Assignment Decription Assignment 0.27 Basic geology 0.5 10000 9 1.22 8000 9 1.22 9 000 9 1.22 0.04 research degree and resource potential 0.75 developin g 9 0.27 developing 9 0.27 deve loping 9 0.27 Data support 0.13 7 0.04 7 0.04 7 0.04 0.12 plenty 3 0.01 plent y 3 0.0 1 plenty 3 0.01 0.02 socio-econom y population density 0.86 transition region 5 0.09 densely 1 0.02 densely 1 0.02 0.14 5 0.01 1 0.00 1 0.00 0.06 Thermal geology 0.14 18.6 3 0.03 18.6 3 0.03 18.3 3 0.03 Terrestrial heat flow (mW·m −2 0.14 50 9 0.08 50 9 0.08 70 5 0.04 gradient −1 0.71 2-2.5 7 0.30 2.5-3 7 0.30 2.5-3 7 0.30 0.1 storage Unit (104 t/km2) 0.17 23.1 3 0.05 10.9 3 0.05 23.1 3 0.05 0.17 Reservoir and cap-rock 0.43 20.9 5 0.37 21.2 5 0.37 17 3 0.22 0.43 6.7 7 0.51 6.7 7 0.51 8.2 9 0.66 cap-rock 0.14 mainly 5 0.12 mainly 5 0.12 re gional 9 0.21 level Index layer indicator weight of Second level SW low-slope structural belt North Sichuan low-flat structural belt West Sichuan low-slope structural belt Decription Decription assignment Decription 0.27 basic geology 0.5 7000 9 1.22 12000 9 1.22 10000 9 1.22 0.04 research degree and resource potential 0.75 de veloping 9 0.27 developing 9 0.27 developing 9 0.27 Data support 0.13 7 0.04 7 0.04 7 0.04 0.12 ple nty 3 0.01 less 1 0.00 plent y 3 0.01 0.02 socio-economy 0.86 1 0.02 sparsely 9 0.15 1 0.02 0.14 1 0.00 5 0.01 1 0.00 0.06 Thermal geology 0.14 18.3 3 0.03 16.8 3 0.03 16.8 3 0.03 Terrestrial heat flow (mW·m −2 0.14 70 5 0.04 50 9 0.08 70 9 0.08 gradient −1 0.71 3 - 3.5 5 0.21 1.5 - 2 9 0.38 2 - 2.5 7 0.30 0.1 Inferred storage potential 0.17 R eservoir and cap-rock Reservoir and cap-rock conditions 0.14 r egional 9 0.21 regiona l 9 0.21 regiona l 9 0.21 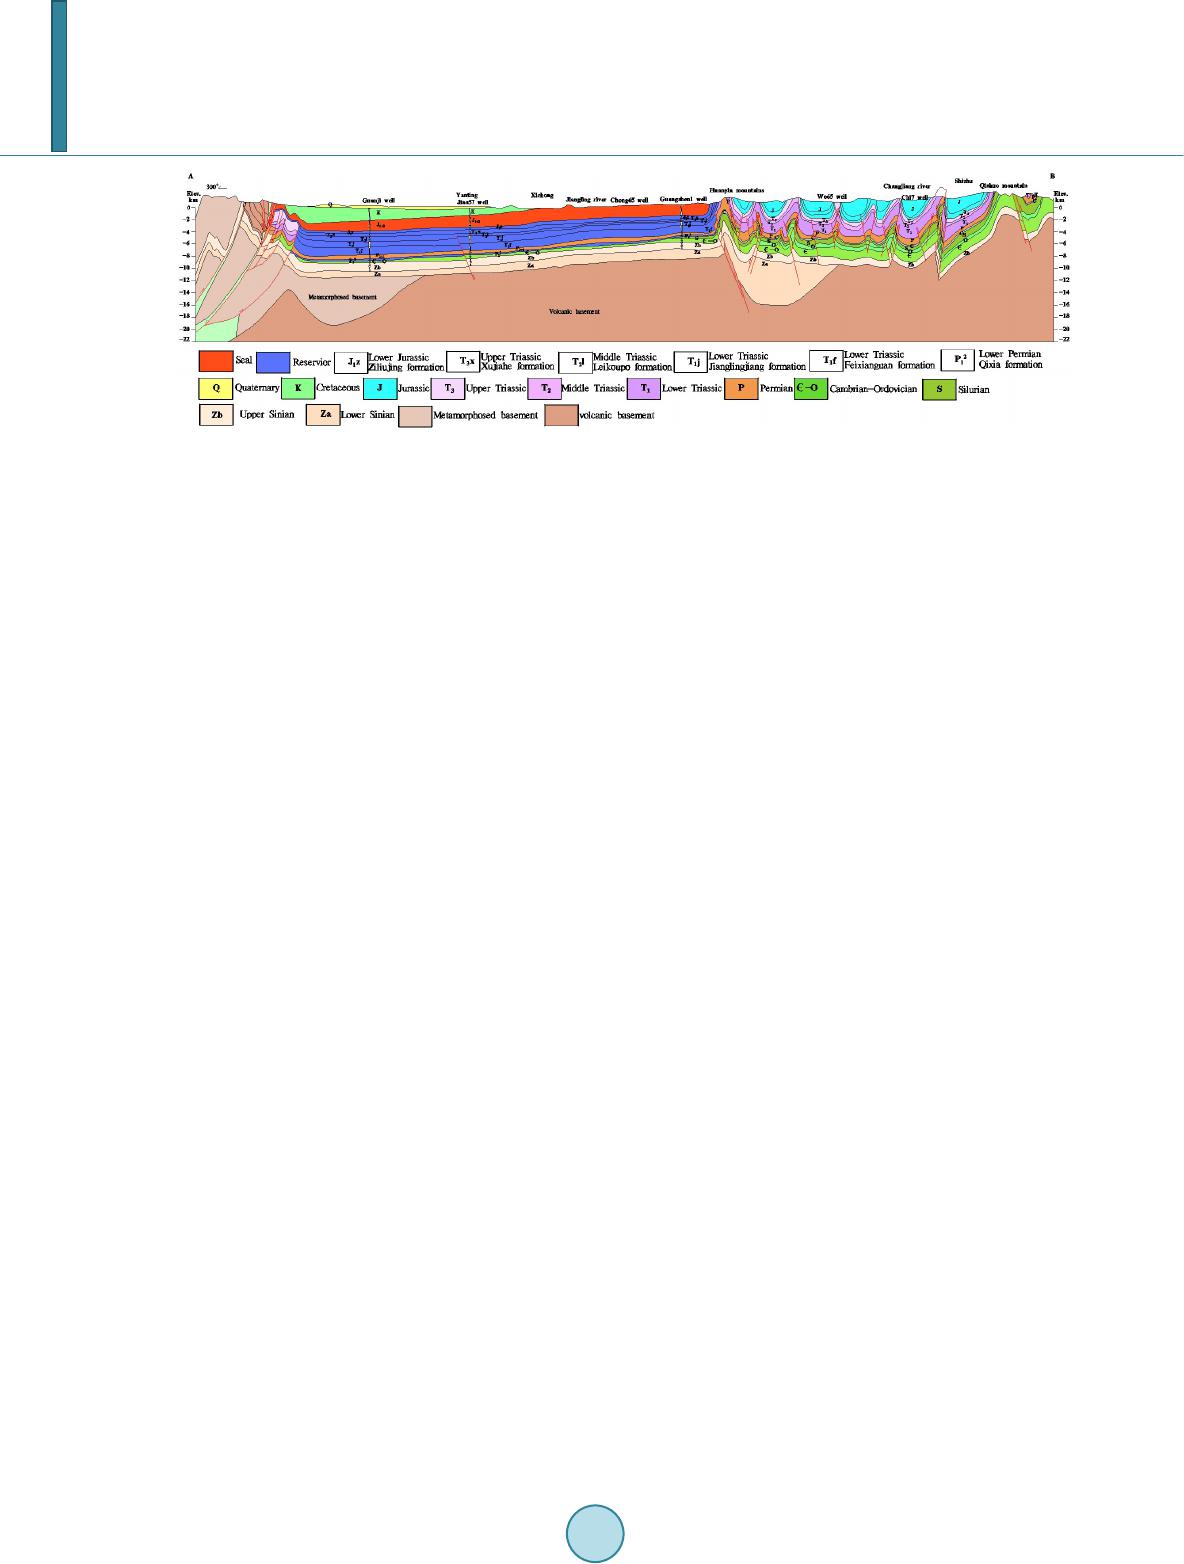 J. J. Fan et al. Figure 4. Geological profile across the basin along the line A-B in Figure 2 (Blue formations indicate the saline aquifers and red formation are the caprock seal). and Lower Permian Qixia Formation, the gently fold belt reservoir in the middle part of Sichuan can be used as geological goal targets. As for the reservoir of Lower Jurassic Ziliujing formation, Upper Triassic Xujiahe for- mation, and Triassic system Leikoupo Formation, where exists the risk of leakage in Huanyin mountains fault zone, the furthest areas from structure unit boundary faults zone should be selected for the best. 6. Discussion Since the secondar y tectonic uni ts within the basin are considered as research objects, the scope of correspond- ing evaluati on objects are narrowed to some extent. However, to achieve the goal tha t the storage of carbon dio- xide reaches the ultimate state, i.e., t he mineralized storage state, a completely enclosed space is required strictly. Regarding the closed space issues, the s mearing effect displayed by the fault rupture of Huan yin mounta in just has a sealing function theoretically for the lower Triassic Jialing group, Feixianguan and lower P ermian Qixia Formation reservoir, b ut its closed fracture feature is very complex and deserves more in-depth analysi s . For the six geological targets determined preliminarily, borehole data should be used to analyze the sedimen- tary microfacies of these six targets located at different geological laye rs. For area with less borehole data available, microfacies analysis sho ul d be applied in order to establish the physical model of geological targets and carry out corresponding numerical simulation work. 7. Conclusions The suitability assessment of the secondary tectonic units in Sichuan Basis sho ws that middle gentle fold belt is relatively suitable. Eastern high and steep fold belt, southwestern low-steep fold belt and North Sichua n low-flat struc tura l belt are quite unsuitable, and western and southwestern low-steep fold be lts are unsuitable. The underground reservoirs of six geological targets inc l ude lower Jurassic Ziliujing Group , upper Triassic Xujiahe Group, middle Triassic Leikoupo Group, lower Triassic Jialingjiang Group, lower Triassic Fei xi an guan Group and lower Permian Qixia Group. References [1] Fan, J., Jia, X. and Zhang, S. (2011) Methods and Assessments of CO2 Geological Storage Potentials and Suitability. Hydrogeology and Engineering Geology, 38, 108-112. (in Chinese) [2] Fan, J., Zhang, S. and Zheng, B. (2011) CO2 Geological Storage Potentials and Map Compilation Method for Suitabil- ity Assessment. Hydrogeology and Engineering Geology, 38, 101-105. (in Chinese) [3] Guo, J., Zhang, S. and Diao, Y. (2011) Site Selection Technology and Engineering Methods for Deep Saline Aquifer CO2 Geological Storage. Jilin University (Earth Science Edition), 41, 10 84-1091. (in Chinese) [4] Diao, Y., Zhang, S. and Guo, J. (2012 ) Selection and Evaluation of Deep Saline Aquifer Sites for Carbon Dioxide Geological Storage. Rock and Soil Mechanics, 33. (in Chinese) [5] Zhang, S., Guo, J. and Diao, Y. (2012) Selection Methods for Deep Saline Aquifer CO2 Geological Storage Sites at Large Scale. Chinese Geology, 38, 1640-1651. (in Chinese) [6] Bachu, S., Bradshaw, J., Bonijoly, D., Burruss, R., Holloway, S., Christensen , N.P. and Mathiassen, O-M. (2007) CO2 Storage Capacity Estimation: Methodology and Gaps. International Journal of Greenhouse Gas Control, 1, 430-443.  J. J. Fan et al. http://dx.doi.org/10.1016/S1750-5836(07)00086-2 [7] Bachu, S. (2003) Screening and Ranking of Sedimentary Basins for Sequestration of CO2 in Geological Media. Envi- ronmental Geology, 44, 277-289. http://dx.doi.org/10.1007/s00254-003-0762-9 [8] Oldenburg, C.M. (2008) Screening and Ranking Framework for Geologic CO2 Storage Site Selection on the Basis of Health, Safety, and Environmental Risk. Environmental Geology, 54, 1687 -1694. http://dx.doi.org/10.1007/s00254-007-0947-8 [9] Doughty, C., Frei feld, B.M. and Trau t z, R.C. (2008) Site Characterization for CO2 Geologic Storage and Vice Versa: The Frio Brine Pilot, Texas, USA as a Case Study. Environmental Geology, 54, 1635-1656 . http://dx.doi.org/10.1007/s00254-007-0942-0 [10] Meyer, R. and May, F. (2008) Regional Search, Selection and Geological Characterization of a Large Anticlinal Struc- ture, as a Candidate Site for CO2-Storage in Northern Germany. Environmental Geology, 54, 1607-16 1 8. http://dx.doi.org/10.1007/s00254-007-0939-8 [11] Gupta, N. and Cumming, L. (2013) Assessment of Carbon Dioxide Storage Sichuan Basin, Hechuan, China. Draft Fi- nal Report. [12] Xu, J., Ma, Z., Zhang, T. and Zhu, H. (2005 ) Fuzzy Indexes for Geological Environment Quality Evaluation in Bohai area, Shandong Province. Coastal Engineering Geological Environment and Urban Development, 262. (in Chinese) [13] Li, G. and Lu, M. (1988) Atlas of Chinese Petroliferous Basins. Petroleum Industry Press. (in Chinese) [14] Yang, X.K. (2012 ) Tectonic and Sedimentary Basin Evolution and Suitability Assessment of Carbon Dioxide Geolog- ical Storage Sites in China. (in Chinese). [15] Zhang, J. and Huang, Ch. (2009) Sichuan Earthquake Hazard Risk Analysis. Tropical Geography, 29, 280 -284. (in Chin ese) [16] Hu, Y. (2001) GB18306-2001 “Chinese Ground Motion Parameter Zoning Map” Publicizing Materials. Standard Press of China. (in Chinese) [17] Peng, H., Ma, X. and Jiang, J. (2009) Fault Stress Measurement and Stability Assessment in Northern Longmen Shan fault of Green River. Geom echan ics, 15, 114 -130. (in Chinese) [18] Wang, M., Bao, C. and Xiao, M.D. (1989) Petroleum Geology of China (Volume Ten)(in Chinese), Sichuan Oil and Gas District. [19] Lin, T. and Chen, S. (2008) Exploration and Development Prospect of Underground Brine in Sichuan. Salt Lake Re- search, 16, 1-7. (in Chinese) [20] Wang, J. (2004) Sichuan Petroleum Geology. Petroleum Geology, 26, 115-120. (in Chinese) [21] Zhang, K. and Zhang, S. (2007) Research on the Deposition in Sichuan Bas in . (in Chinese). [22] Xu, M., Zhu, C. and Tian, Y. (2011) Basin Borehole Temperature Measurements and Current Geothermal Features. Geophys, 54, 1052 -1060 . (in Chinese) [23] Fei, Y. (2007) The Change of Temperature Trends in Sichuan within Fifty Years. Plateau Mountain Meteorology Re- search, 27, 21-22. (in Chinese) [24] Ma, Y., Cai, X. and Zhao P. (2010 ) Distribution Patterns and Exploration Methods of Medium-Sized Gas Fields in Si- chuan Basin. Petroleum Technology, 31, 347-354. (in Chinese) [25] 2007 GB T. Land Use Classification Criteria, 2007. (in Chinese) [26] National Bureau of Statistics in 2010, the Sixth National Census Data Bulletin. China National Bureau of Statistics, Beijing, 2011. (in Chinese) [27] Chen, X.M. (1977) Chongqing Amplitude (H-48-23) 1/20 000 Regional Hydrogeological Investigation Report. [28] Xie, Y.X. (1981) Guang’an Amplitude (H-48-17) 1/20 000 Regional Hydrogeological Survey Report.
|