Journal of Materials Science and Chemical Engineering, 2014, 2, 1-8
Published Online October 2014 in SciRes. http://www.scirp.org/journal/msce
http://dx.doi.org/10.4236/msce.2014.210001
How to cite this paper: Haldar, M.K., Ghosh, C. and Ghosh, A. (2014) Studies on Synthesis and Characterization of Magnesia
Based Refractory Aggregates Developed from Indian Magnesite. Journal of Materials Science and Chemical Engineering, 2,
1-8. http://dx.doi.org/10.4236/msce.2014.210001
Studies on Synthesis and Characterization of
Magnesia Based Refractory Aggregates
Developed from Indian Magnesite
Manas Kamal Haldar*, Chandrima Ghosh, Arup Ghosh
Refractories Division, CSIR-Central Glass & Ceramic Research Institute, Kolkata, India
Email: *manashaldar@cgcri.res.in
Received Ju ly 2014
Abstract
The present work intends to study the properties of magnesia based refractory aggregates devel-
oped from Indian magnesite by changing lime/silica ratio. The material has been sintered in the
temperature range of 1550˚C - 1700˚C. The sintered samples are characterized in terms of bulk
density, apparent porosity, true density, percentage densification, mechanical, thermo-mechanical
properties like cold modulus of rupture, hot modulus of rupture and thermal shock resistance and
structural properties by XRD. The developed microstructures at different temperatures are stu-
died through FESEM study and compositional analysis of the developed phases is done by EDX
study.
Keywords
Sintering, M agnesi te, Mi cr ost ruc ture , Th e rmo-Mechanical Properties, Re fract ories
1. Introduction
Magnesia refractories are prepared in India mainly from naturally occurring magnesite. It is an important ma-
terial to the refractory industries. The importance of this basic oxide based refractories have increased consider-
ably over the years due to the rapid expansion and technology changes of iron and steel industry, cement and
glass industries. The main reasons of its success are high melting point (~2800˚C) and its excellent resistance to
attack by iron oxide, alkalis and high lime containing slags at working temperature of steel melting furnaces [1]
(1700˚C). Unlike its rivals (e.g. lime and dolomite), it does not suffer from hydration and is not toxic.
Though India has vast resources of natural magnesite, the refractory industries are mostly dependent on the
imported magnesia. This is due to the fact that Indian magnesite is rich in impurities, mainly SiO2, Fe2O3, CaO
which form low melting phases at elevated temperature causing poor refractory properties, e.g. high temperature
strength, corrosion resistance. One of the most important & critical parameters in magnesia refractory is
CaO/Si O2 ratio [2] which significantly affects the formation of low melting phases. In this background, an at-
tempt has been made to synthesis and study the properties of magnesia based refractory aggregates (by changing
the CaO/SiO2 ratio) developed from lean grade Indian magnesite.
*
Corresponding author.
M. K. Haldar et al.
2
2. Experimental
Natural Indian magnesite of Salem district in Tamilnadu (supplied by erstwhile Burn Standard Co. Ltd., pre-
sently SAIL Refractory Co. Ltd, India) was selected for the present study. The CaCO3 of S.D. Fine Chemical
Limited, India was selected for changing the CaO/SiO2 ratio of the batches. The chemical analysis of the magne-
site, as received, is delineated in Table 1. The analysis was done by standard wet chemical procedure. 0.25 g of
the solid powdered sample was taken into a platinum crucible and the sample was thoroughly mixed with borax
sodium carbonate fusion mixture and melted at around 900˚C for 1h. After melting, the mass was cooled down
and digested with nitric acid to obtain a solution. Fe2O3 and TiO2 were measured by colorimetric method. MgO,
Al2O3, CaO were determined by complexometric method using EDTA solution. Na2O and K2O were measured
by flame photometry using hydrofluoric acid and perchloric acid digested magnesite solution. SiO2 was meas-
ured by gravimetric method.
The structural characterization of the sintered aggregates in terms of phase identification and evaluation of
crystal structure parameters like crystallite size, lattice strain, lattice parameters, unit cell volume etc was per-
formed by X-ray diffraction technique. The XRD patterns of the samples were recorded in X’pert Pro MPD dif-
fractometer (PANalytical) by X’Celerator operating at 40 kV and 30 mA, using Ni-filtered CuKα radiation. The
XRD data were recorded with step size of 0.05˚ (2θ), step time of 75 sec, from 10˚ to 90˚. The magnesite ores
were crushed in a jaw crusher and hammered to pass through 100 mesh sieve. These powders were mixed with
CaCO3 to have a mole ratio of CaO:SiO2 = 2:1. The batch was attrition milled in attritor mill with isopropyl al-
cohol for 1h. The slurry thus obtained was dried at 50˚C ± 2˚C in a laboratory oven for 2 h and passed through
100 mesh sieve to get the desired powder. Powdered sample was mixed with 5% (w/v) of polyvinyl alcohol so-
lution as binder and subsequently granulated by sieving and uni-axially pressed at 140 MPa pressure into pellets
of 2.5 cm dia and 1 cm height for densification studies and bars of 80 mm × 8 mm × 8 mm for the rmo-mechan-
ical and mechanical studies and few bars were cold iso-statically pressed at 140 MPa for thermal shock studies.
All the pressed samples were dried at 110˚C ± 5˚C and sintered in the temperature range of 1550˚C - 1700˚C
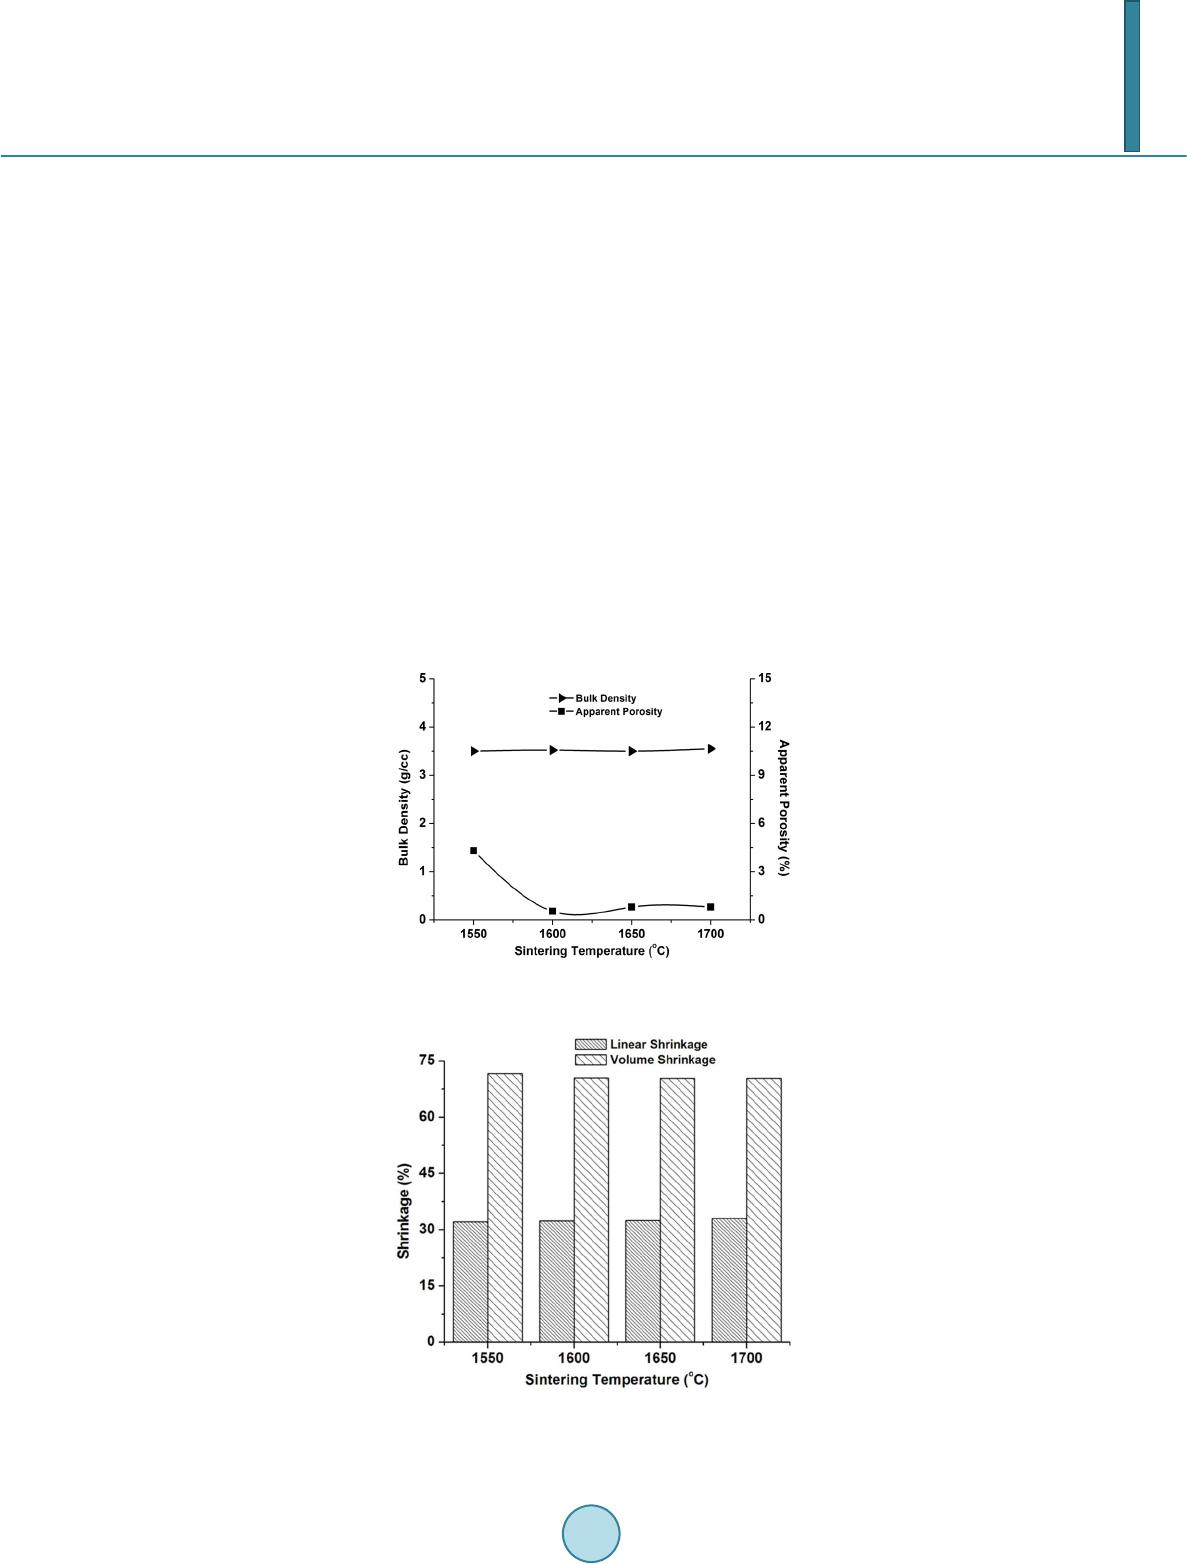
with 2 h of soaking at the peak temperature. Sintered samples were characterized in terms of bulk density, ap-
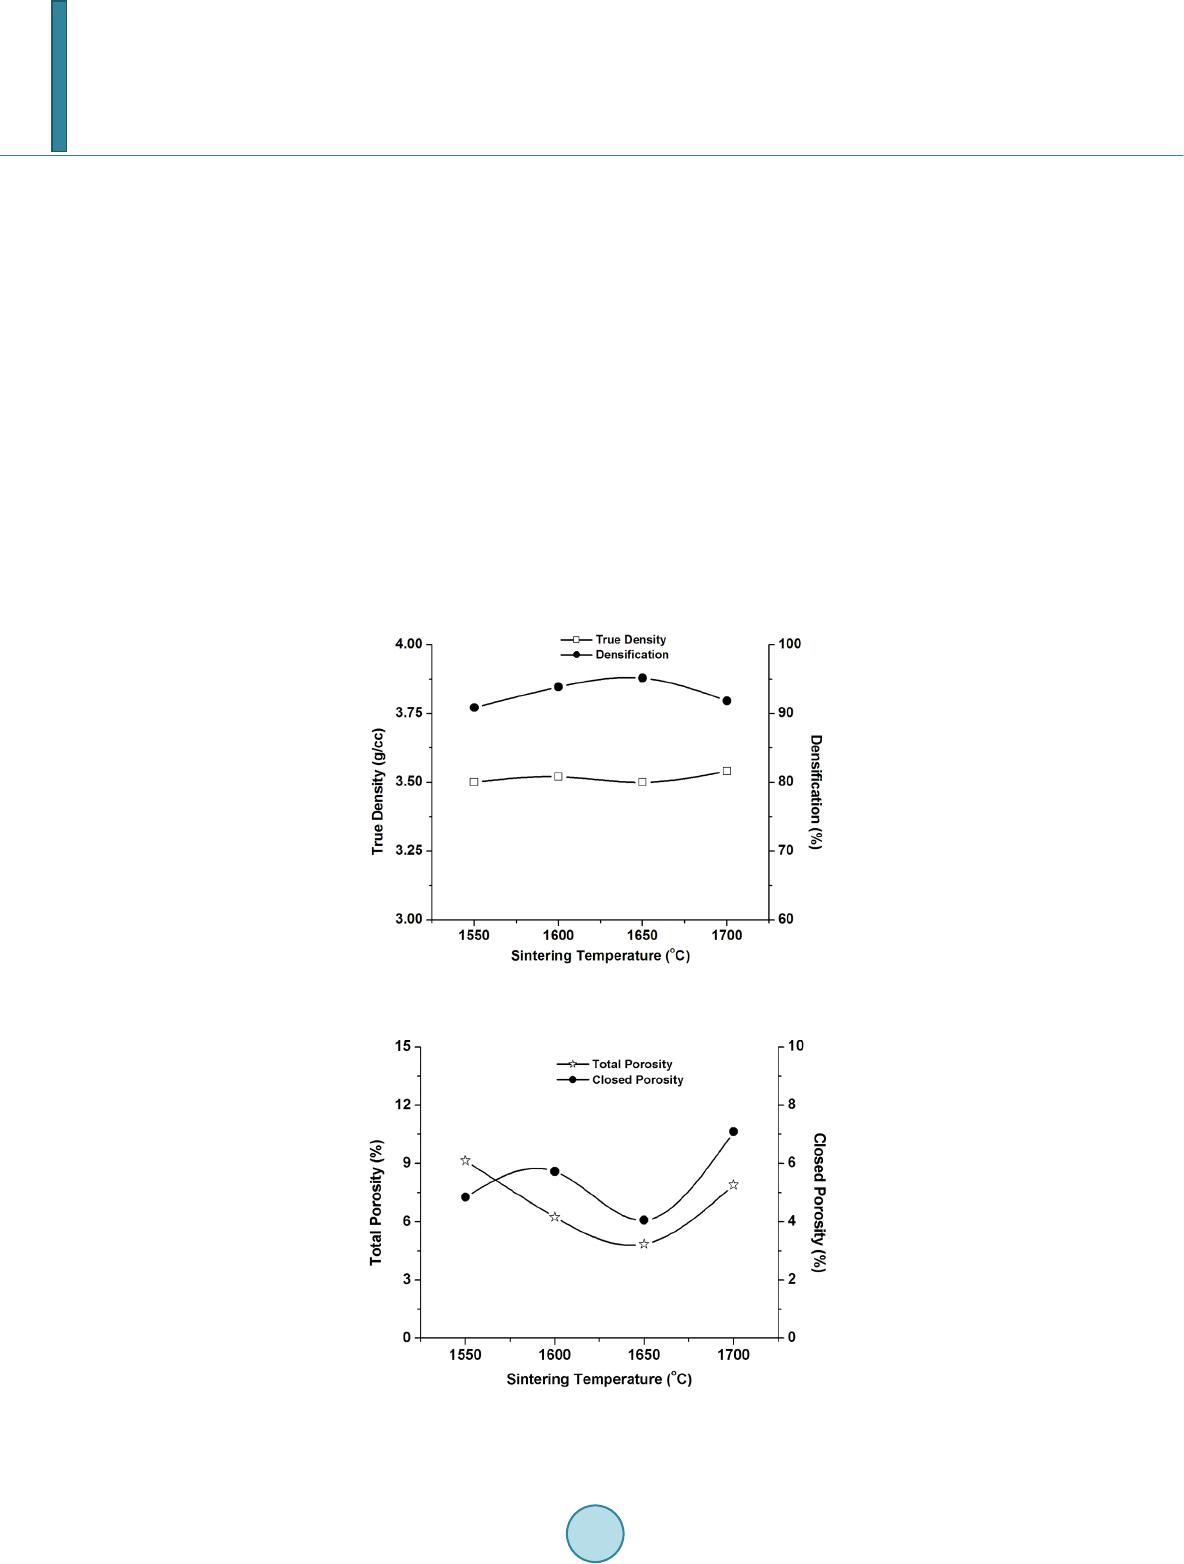
parent porosity, closed porosity, true density, relative density (percentage densification). The bulk density and
apparent porosity were measured by water displacement method using Archimedes’ principle. True density was
measured with powdered samples in a pycnometer bottle. From these two values, percentage densification of the
sintered samples was measured. Closed porosity was measured by subtracting apparent porosity values from to-
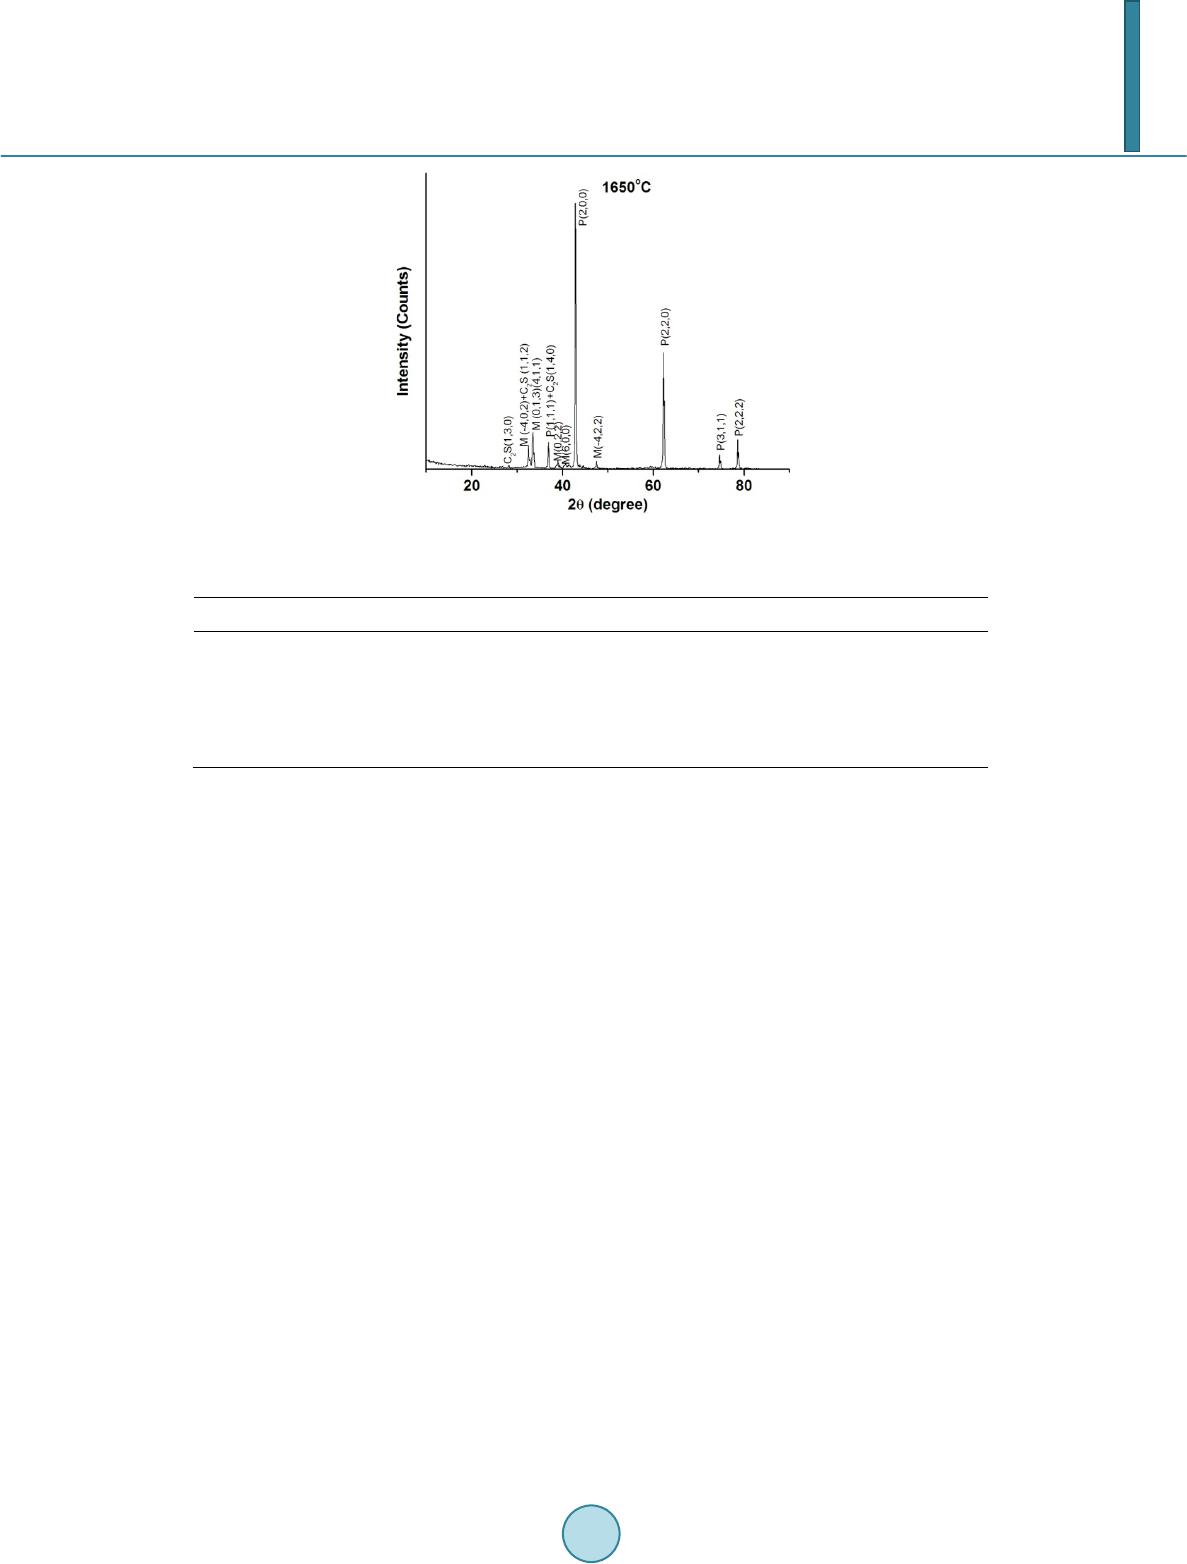
tal porosity. The linear shrinkage of the sintered samples was measured using digital slide calipers. Crystalline
phases of the sintered samples were identified from XRD patterns. Percentages of crystalline phases were esti-
mated for the samples from X-ray diffraction line profile analysis using Rietveld method [1] by X’Pert High
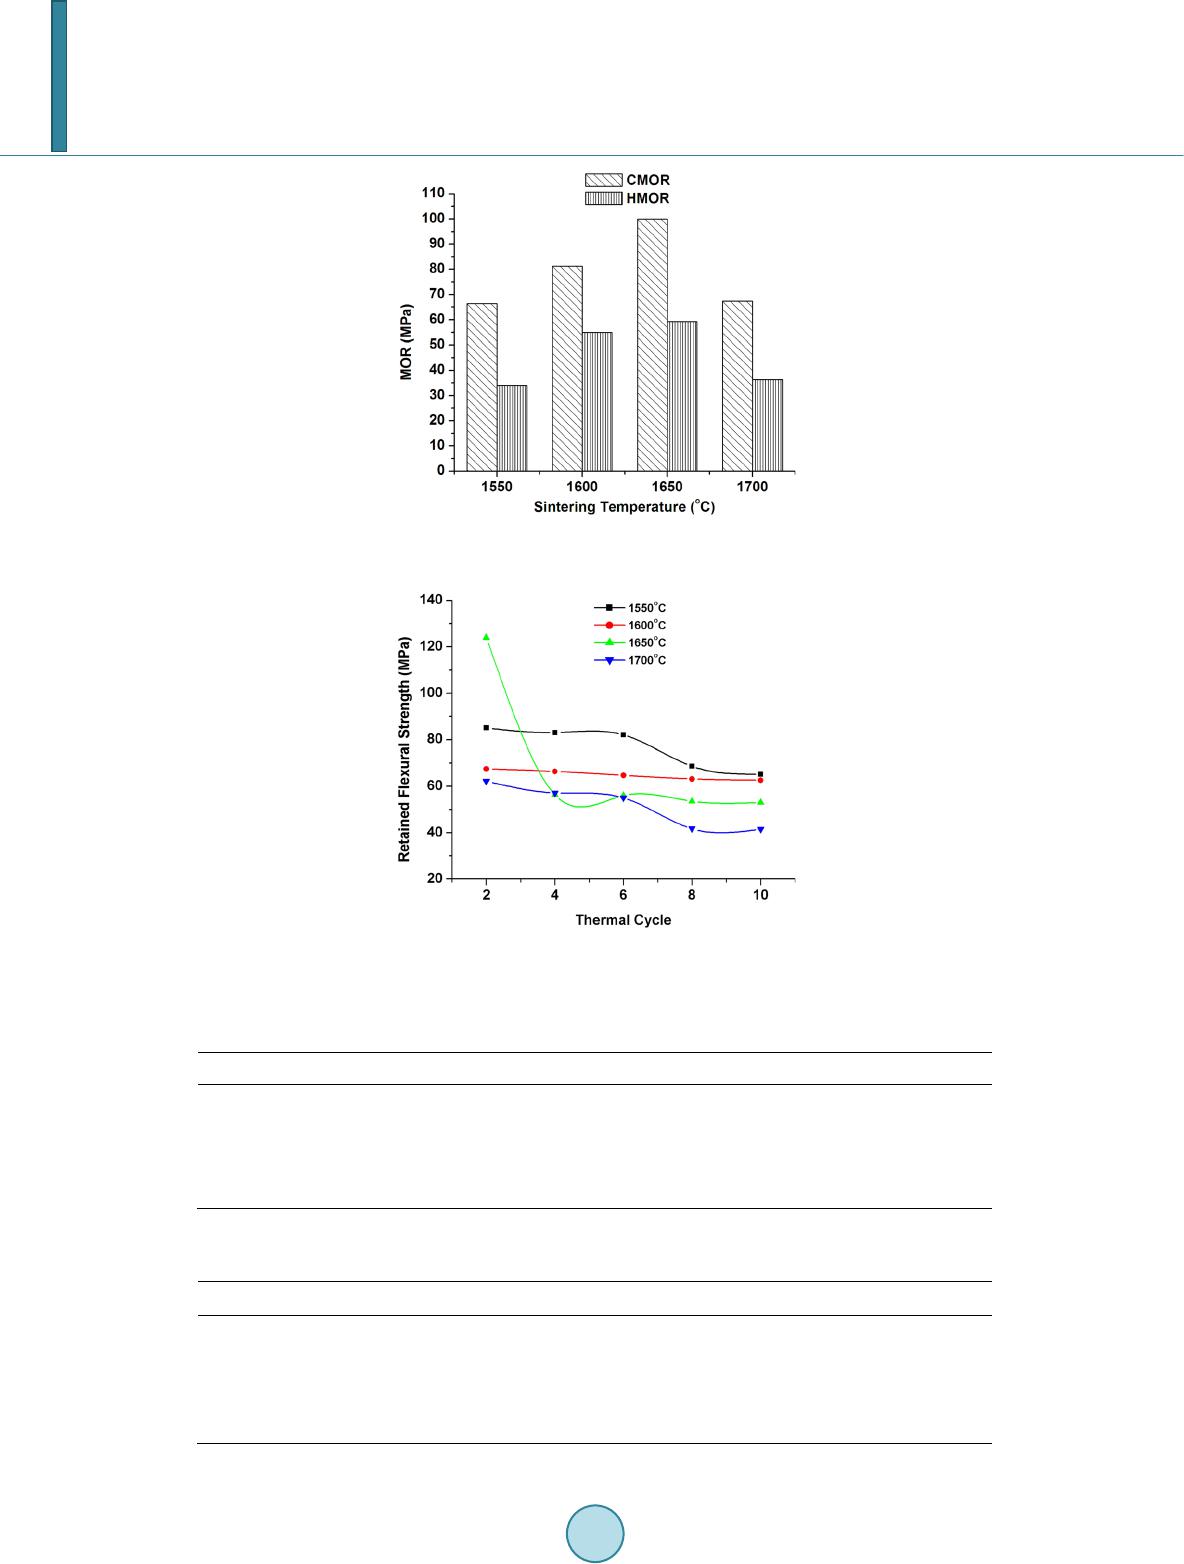
Score Plus software (PANalytical). The flexural strength at room temperature (cold MOR) of the sintered rec-
tangular bars was measured by three point bending method using an Instron-1185 universal testing machine. The
span of the bars was 40 mm and the cross head speed was 0.5 mm∙min1. The high temperature modulus of rup-
ture strength was measured at 1300˚C by an instrument supplied by Stedfast International Company Limited,
Table 1. Chemical analysis of as received magnesite.
Constituents Wt% Wt% (loss free basis)
SiO2 2.44 4.8
Al2O3 0.17 0.34
Fe2O3 0.24 0.48
TiO2 0.02 0.4
CaO 1.41 2.79
MgO 45. 68 90.49
Na2O 0.08 0.16
K2O 0.05 0.99
L.O.I. 49.52 -
M. K. Haldar et al.
3
India. The test was done under three point loading on a span of 45 mm during testing. The rate of temperature
rise was maintained at 5˚C /min and samples were allowed a soaking period of 30 min at test temperatures. The
load then applied at a rate of 0.5 mmmin1. Thermal shock resistance of the sintered samples was measured us-
ing the following test method. The sintered rectangular bars were heated up to 1200˚C with a soaking period of
30 minutes initially. Then they were exposed to normal room temperature air (without any draught in the sur-
roundings) for 10 minutes and again put into furnace for 10 minutes. These complete one cycle. These samples
are put up to ten cycles. The samples of second, fourth, sixth, eighth and tenth cycle were examined by measu r-
ing the retained flexural strength through three point bending method using an Instron-1185 universal testing
machine. The span was maintained at 45 mm and the cross head speed was 0.5 mm∙min1. Microstructure evalu-
ation of the sintered samples was done by scanning electron microscopy (Make Zeiss, Germany) on the polished
surface after thermal etching. Elemental analysis was done by EDX technique using sintered polished samples.
3. Results & Discussion
3.1. Characterization of Sintered Aggregates
3.1.1. Physical & Physico-Chemical Prop e rtie s
Figure 1 shows the effect of sintering temperature on the bulk density (BD) and apparent Porosity (AP) of the
sintered samples. The sample shows increase in the bulk density with increasing sintering temperature till
1650˚C. At 1700˚C, there is a slight decrease in BD. In case of AP, it is highest at 1550˚C and lowest at 1600˚C.
After 1600˚C it slightly increases at 1650˚C and remains the same at 1700˚C. Figure 2 depicts the effect of
Figure 1. Variation in bulk density and apparent poros-
ity with sintering temperature.
Figure 2. Variation in linear shrinkage and volume
shrinkage with sintering temperature.
M. K. Haldar et al.
4
sintering temperature on the linear shrinkage and volume shrinkage of the sintered magnesia samples. Linear
shrinkage is almost same throughout the temperature range and volume shrinkage is highest at 1550˚C. The
change in true density and densification with sintering temperature is shown in Figure 3. True density varies in
the range of 3.5 to 3.55 and densification is above 90% for all the samples sintered in between 1550˚C - 1700˚C
with highest densification achieved at 1650˚C. This result later corroborates the HMOR value which is also the
highest at 1650˚C. Figure 4 shows the change in total porosity and closed porosity with sintering temperature. It
is seen that in both the cases same trend is followed. Both the porosities are the lowest at 1650˚C which reveals
the development of compact microstructure as observed in scanning electron photomicrographs.
3.1.2. Mineralogical Properties
The powder X-ray diffraction pattern of the sample sintered at 1650˚C is shown in Figure 5. Examination of the
CaO-MgO-SiO2 phase diagram [3] shows that silicate phases that exist with C/S ratios between 0 and 1 are
forsterite (M2S) and monticellite (CMS), and between 1.5 and 2 are dicalcium silicate (C2S) and merwinite [4].
This proves that it is the C/S ratio and not simply the amount of CaO present that determines the silicate phases
[4] present. Table 2 shows the change in percentage of periclase phase with sintering temperature. Rietveld re-
finement analysis helps us in determining how the observed values fit with the theoretical values [5] [6]. Riet-
veld method is a full-pattern fit method. This is basically a non-linear least square method. The measured profile
is obtained by the variation of many parameters resulting in minimization of the difference between the two
Figure 3. Variation in true density and densification with sin-
tering temperature.
Figure 4. Variation in total porosity and closed porosity with
sintering temperature.
M. K. Haldar et al.
5
Figure 5. X-Ray diffraction of sample sintered at 1650˚C.
Table 2. Variation in Periclase content with increasing sintering temperature.
Sample Sintering Temperature (ºC) Periclase (%)
1550 65. 9
1600 71. 8
1650 74. 6
1700 76. 4
profiles and the calculated profile is compared and the least square refinements are carried out until the residuals
are minimized and best fit is achieved between the entire observed powder diffraction pattern taken as a whole
and the entire calculated pattern (based on simultaneously refined models for crystal structures, instrumental
factors, diffraction optics effects and other specimen characteristics like lattice parameters, size and strain para-
meters) as may be desired and can be modeled. Table 3 shows the change in lattice parameters of periclase with
sintering temperature. The quality of fit was assessed using various numerical criteria of best fit, namely the
profile residual factor (Rp), the weighted residual factor (Rwp), the expected residual factor (Rexp), weighted-
statistics (Dws) and the goodness of fit (GOF) as obtained from Rietveld analysis (all confirming good fit). The
values of the reliability parameters of the fit during Rietveld refinement are given in Table 4.
3.1.3. Mech anical/Thermo Mechanical Properties
In a multiphase material, mechanical strength depends mainly on the microstructure of the material. In other
words, the amount and distribution of the phases play an important role in determining the mechanical strength.
Figure 6 shows the effect of sintering temperature on the flexural strength of samples at ambient temperature
and 1300˚C. Flexural strength (Cold Modulus of Rupture & Hot Modulus of Rupture) is measured using the
three point bending method. The samples sintered at 1650˚C show appreciably higher CMOR & HMOR values
than the samples sintered at lower temperature which corroborates the results found for other basic refractories
[7]. Figure 7 shows the retained flexural strength of samples at ambient temperature after undergoing different
thermal cycles at 1200˚C. It is well known that the origin of thermal stresses is the difference in thermal expan-
sion of various parts of a body under conditions such that free expansion of each small unit of volume cannot
take place [8]. The samples show a decreasing trend of retained flexural strength with increasing thermal cycles
as expected.
3.1.4. Micro Structural Characterization
The inter-relation between microstructure and properties of a material is very important for the deeper under-
standing of material property and its improvement. The advantage of this correlation is that it may be applied to
develop materials with tailor made properties. Figur es 8-10 show the FESEM images of the thermally etched
P=Peric lase
M=Merwin ite
C
2
S=Dicalcium Silicate
M. K. Haldar et al.
6
Figure 6. Variation in Cold MOR and Hot MOR with
sintering temperature.
Figure 7. Retained Flexural Strength of samples after
different thermal cycles.
Table 3. The values of cell parameters and unit cell volume of periclase phase of samples after sintering at
different temperatures.
Sample Sintering Temperature (˚C) Periclase
1550 a = b = c = 4.212018 Å
1600 a = b = c = 4.212203 Å
1650 a = b = c = 4.213327 Å
1700 a = b = c = 4.213485 Å
Table 4. The values of reliability parameters as obtained by Rietveld analysis of samples after sintering at
different temperatures.
Sample Sintering Temperature (˚C) Rexp Rp Rwp Dst Dwst GOF
1550 14. 72158 16.23802 20.74131 0.80825 0.74349 1.9850 11
1600 14. 85615 14.65899 19.66928 0.94398 0.78592 1.75293
1650 14. 13249 17.23880 21.65164 1.17287 0.68589 2.34717
1700 11. 97883 16.30035 19.00794 0.52933 0.61202 2.51792
M. K. Haldar et al.
7
Figure 8. Scanning electron micrograph of sample sin-
tered at 1550˚C/2 h.
Figure 9. Scanning electron micrograph of sample sin-
tered at 1600˚C/2 h.
Figure 10. Scanning electron micrograph of sample
sintered at 1650˚C/2 h.
polished surfaces of the samples sintered at different temperatures for 2 h. In case of all the samples sintered in
the temperature range of 1550˚C to 1700˚C, it is found that microstructure mainly consists of subrounded to
rounded periclase grains (P) with the bonding material in between the grains [9]. These periclase grains are dark
in color and most of them are surrounded by siliceous bond [10]. Very few periclase grains are directly bonded.
It is being also found that the silicate bond phases are concentrated mainly in small triangular pockets, formed
close to periclase grains. The EDX analysis (Figure 11) of the samples reveals this interconnected phases are
mainly C2S with a small amount of merwinite. From EDX it is observed that at 1650˚C, the amount of C2S
phase is more which gives support to the HMOR results which is highest at 1650˚C.
M. K. Haldar et al.
8
Figure 11. EDX Analysis (Elemental Mapping) of sample sintered at 1650˚C.
4. Conclusion
The present investigation demonstrates that Indian natural magnesite can be sintered by changing C/S ratio to
2:1 in the temperature range of 1550˚C - 1700˚C with highest BD of 3.33 g/cc. The hot modulus of rupture val-
ues of sintered samples is considerably high. The microstructure reveals that the matrix consists of mainly pe-
riclase grains and C2S accompanied by merwinite as minor phase. Presence of C2S phase (desirable high tem-
perature phase) helps to increase the hot MOR value.
Acknowledgements
The authors wish to thank the Director, CSIR-CGCRI for his kind permission to publish this paper. The authors
are also thankful to Ministry of Mines, Govt. of India for providing financial assistance in carrying out this
work.
References
[1] Serry, M.A., Ha mmad, S.M. and Zawrah, M.F.M. (1997) Densification and Microstructure of Refractory Periclase
Grain s. I ntercera m, 46, 430-43 5.
[2] Lee , W.E. and Rainforth, W.M. (1994) Ceramic Microstructures Property Control by Processing. Chapman & Hall,
UK.
[3] Steijn, R.P. (1963) Sliding and Wear in Ionic Crystals. Journal of Applied Physics, 34, 419-428.
http://dx.doi.org/10.1063/1.1702624
[4] Staut, R. (1972 ) Effects of the Lime-Silica Ratio on the Physical Properties of Magnesia-Chrome Ore Composition.
Journal of the American Ceramic Society, 51, 901-905.
[5] Young, R.A. (1993) The Rietveld Method. Oxford University Press.
[6] De la Torre, A.G. , Valle, F.J. and De Aza, A.H. (2006) Direct Mineralogical Composition of a MgO-C Refractory Ma-
terial Obtained by Rietveld Metho dol ogy. Journal of the European Ceramic Society, 26, 2587-2592 .
http://dx.doi.org/10.1016/j.jeurceramsoc.2005.05.005
[7] Rigby, G. R. (1970) Mechanical Properties of Basic Bricks I. A Survey of the Magnesia-Chrome System. Transactions
and Journal of the British Ceramic Society, 69, 189-198.
[8] Timoshenko, S. (1934) Theory of Elasticity. McGraw-Hill Book Co, Inc, New York.
[9] Chaudhuri, M., Kumar, A., Bhadra, A.K. and Banerjee, G. (1990) Sintering and Grain Growth in Indian Magnesites
Doped with Titanium Dioxide. Interceram, 39, 26-30.
[10] Lampropoulou, P.G. and Katagas, C.G. (2005) Composition of Periclase & Calcium-Silicate Phases in Magnesia Re-
fractories Derived from Natural Microcrystalline Magnesite. Journal of the American Ceramic Society, 88, 1568-15 74 .
http://dx.doi.org/10.1111/j.1551-2916.2005.00263.x