Paper Menu >>
Journal Menu >>
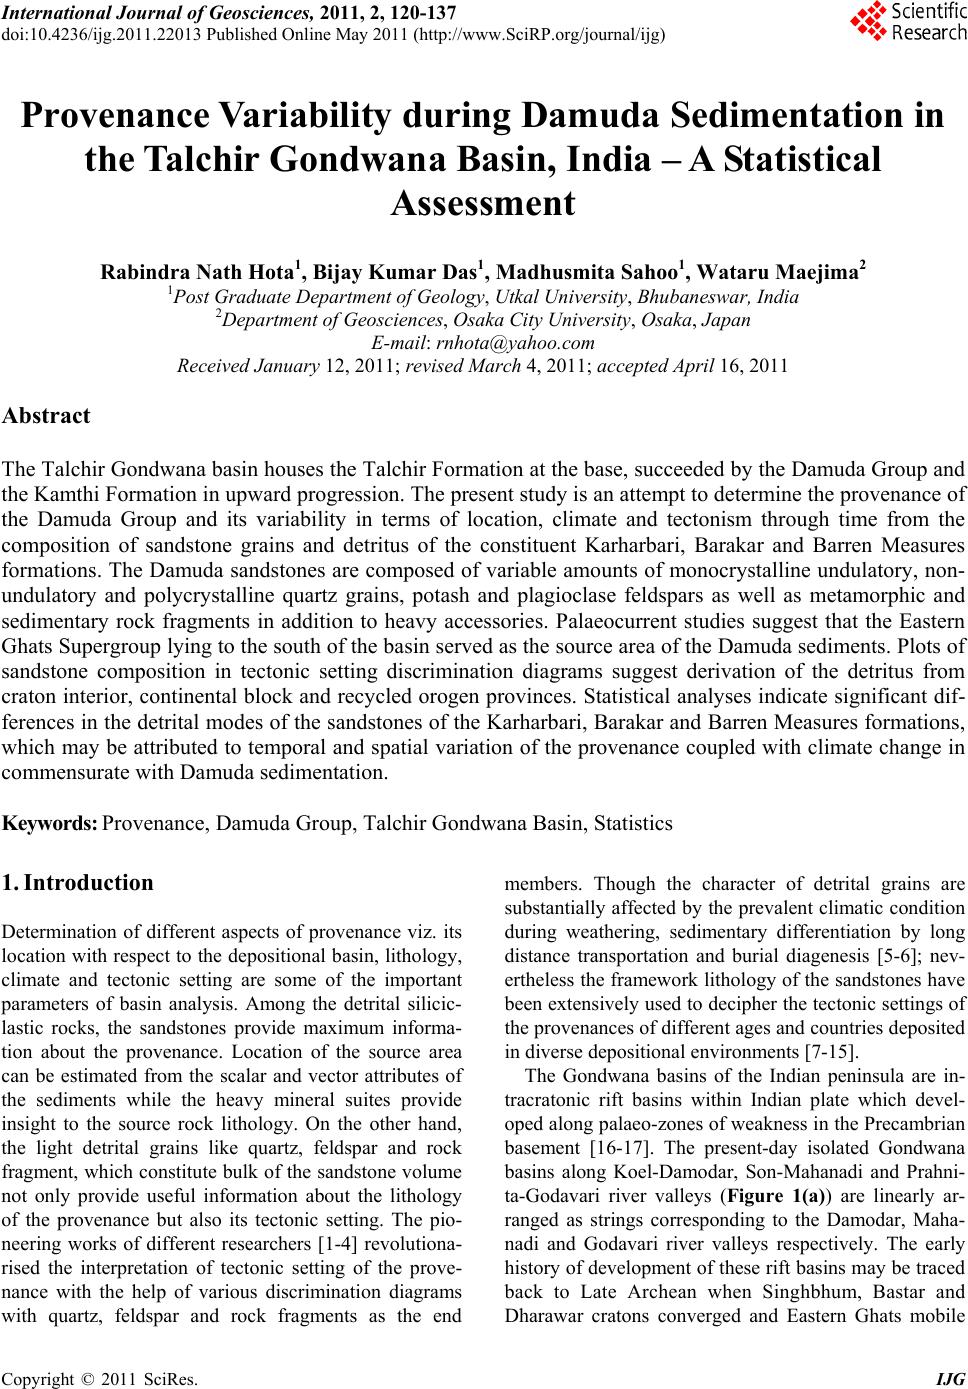 International Journal of Geosciences, 2011, 2, 120-137 doi:10.4236/ijg.2011.22013 Published Online May 2011 (http://www.SciRP.org/journal/ijg) Copyright © 2011 SciRes. IJG Provenance Variability during Damuda Sedimentation in the Talchir Gondwana Basin, India – A Statistical Assessment Rabindra Nath Hota1, Bijay Kumar Das1, Madhusmita Sahoo1, Wataru Maejima2 1Post Gradu ate Depart ment of Ge ology, Utkal University, Bhubaneswar, India 2Department of Geosciences, Osaka City University, Osaka, Japan E-mail: rnhota@yahoo.com Received January 12, 2011; revised March 4, 2011; accepted April 16, 2011 Abstract The Talchir Gondwana basin houses the Talchir Formation at the base, succeeded by the Damuda Group and the Kamthi Formation in upward progression. The present study is an attempt to determine the provenance of the Damuda Group and its variability in terms of location, climate and tectonism through time from the composition of sandstone grains and detritus of the constituent Karharbari, Barakar and Barren Measures formations. The Damuda sandstones are composed of variable amounts of monocrystalline undulatory, non- undulatory and polycrystalline quartz grains, potash and plagioclase feldspars as well as metamorphic and sedimentary rock fragments in addition to heavy accessories. Palaeocurrent studies suggest that the Eastern Ghats Supergroup lying to the south of the basin served as the source area of the Damuda sediments. Plots of sandstone composition in tectonic setting discrimination diagrams suggest derivation of the detritus from craton interior, continental block and recycled orogen provinces. Statistical analyses indicate significant dif- ferences in the detrital modes of the sandstones of the Karharb ari, Barakar and Barren Measures formations, which may be attributed to temporal and spatial variation of the provenance coupled with climate change in commensurate with Damuda sedimentation. Keywords: Provenance, Damuda Group, Talchir Gondwana Basin, Statistics 1. Introduction Determination of different aspects of provenance viz. its location with respect to the depositional basin, lithology, climate and tectonic setting are some of the important parameters of basin analysis. Among the detrital silicic- lastic rocks, the sandstones provide maximum informa- tion about the provenance. Location of the source area can be estimated from the scalar and vector attributes of the sediments while the heavy mineral suites provide insight to the source rock lithology. On the other hand, the light detrital grains like quartz, feldspar and rock fragment, which constitu te bulk of the sandston e volume not only provide useful information about the lithology of the provenance but also its tectonic setting. The pio- neering works of different researchers [1-4] revolutiona- rised the interpretation of tectonic setting of the prove- nance with the help of various discrimination diagrams with quartz, feldspar and rock fragments as the end members. Though the character of detrital grains are substantially affected by the prevalent climatic condition during weathering, sedimentary differentiation by long distance transportation and burial diagenesis [5-6]; nev- ertheless the framework lithology of the sandstones have been extensively used to decipher the tectonic settings of the provenances of different ages and countries deposited in diverse depositional environments [7-15]. The Gondwana basins of the Indian peninsula are in- tracratonic rift basins within Indian plate which devel- oped along palaeo-zones of weakness in the Precambrian basement [16-17]. The present-day isolated Gondwana basins along Koel-Damodar, Son-Mahanadi and Prahni- ta-Godavari river valleys (Figure 1(a)) are linearly ar- ranged as strings corresponding to the Damodar, Maha- nadi and Godavari river valleys respectively. The early history of development of these rift basins may be traced back to Late Archean when Singhbhum, Bastar and Dharawar cratons converged and Eastern Ghats mobile  R. N. HOTA ET AL. Copyright © 2011 SciRes. IJG 121 (a) (b) Figure 1. (a) Distribution of the Gondwana basins in the eastern part of the Indian peninsula and location of the Talchir ba- sin; (b) Geological sketch map of the Talchir Gondwana basin showing the study area (modified after Raja Rao, 1982). belt evolved in the Gondwanaland. The junction of these cratonic blocks acted as zones of weakness leading to the formation of intracratonic rift basins in response to crus- tal tension during Late Palaeozoic [18]. The Talchir Gondwana basin of Orissa is the remnant of a master Gondwana basin, which was existing within the Eastern Ghats mobile belt between Singhbhum craton to the north and Bastar craton to the southwest [19]. The Damuda Group of the Talchir Gondwana basin is divisible into Karharbari, Barakar and Barren Measures formations out of which former two are coal bearing. Due to its huge coal resource as well as unique sedimen- tary status, some works have been done on cyclicity of lithofacies, palaeontology and river metamorphosis of the Damuda Group [20-22]. It has been observed that basin tectonism has played a key role in controlling the changes in sediment dispersal pattern during Damuda sedimentation [22-23]. Hence, it is expected that the provenance might have undergone changes in spatial and temporal dimensions. The aim of the present study is to decipher the changes of the provenance in terms of loca- tion, climate and tectonism with advancement of Damu- da sedimentation from detrital grains of sandstones using empirical ternary plots and simple statistical techniques. 2. Geological Setting The area under study is located in the southeastern part of the Talchir basin (Figure 1(b)). The Gondwana sedi- ments in the study area represent a fairly contiguous succession of strata comprising a part of Damuda Group underlain by the Talchir Formation (Figure 2). Gross lithology of Talchir Formation is diamictites, sandstones, needle shales, interbedded sandstone and shale, siltstone and shale and marlstone and shale, which were deposited in predominantly lacustrine environment. This set of lithologies is followed upward by cross bedded fine to medium grained sandstone of glacio-fluvial origin [24]. The Damuda Group is unconformably overlain by the Kamthi Formation (Figure 1(b)), which is composed of conglomerate, fine to medium grained sandstones, grey and red shales [25]. The stratigraphic division of the Gondwana rocks of th e Talchir basin is presented in Ta- ble 1. The Damuda Group is disposed in a homoclinal fa- shion striking east-west and dipping towards north at low angles ranging from 2 to 10 degrees. It is divisible into Karharbari, Barakar and Barren Measure Formations from bottom to top (Figure 2). The lower two formations are the coal-bearing horizons of the basin. The coal- bearing Karharbari and Barakar formations are com- posed of cyclothemic successions of sandstone, shale and coal. Sandstone (>90%) is the chief constituents of the Karharbari Formation while coal ( 51%) is the principal litholounit of the Barakar Formation [22]. A remarkable Boulder Gravel Unit of 40 – 60 m thickness separates the coal-bearing Karharbari and Barakar formations. It is composed of clast-supported boulder gravel and ma- trix-supported boulder conglomerate. Its stratigraphic position is dubious. Raja Rao [26] considers it to be the basal part of the overlying Barakar Formation, while others [24] have regarded it as a part of the underlying Karharbari Formation. Due to its monotonous lithology and debatable stratigraphic affinity it has been excluded in the present study. The overlying Barren Measures Formation is constituted of conglomerates, fine- to coarse-grained sandstones, iron stone shales and coal stringers. The sandstones and shales are ferruginous in nature and workable coal seams are absent. The litholo- gies constituting the Damuda Group are vertically ar- ranged in a distinctive pattern giving rise to a number of  R. N. HOTA ET AL. Copyright © 2011 SciRes. IJG 122 Figure 2. Geological map of the study area showing stream sections and boreholes from which sandstone samples were col- lected. The mean palaeocurrent directions are as per Hota (2007) Figure 7. fining upward cycles [20]. 3. Methods Due to thick alluvial cover over greater part of the study area, sandstone samples of the Karharbari and Barren Measures Formations were collected from exposures available in the stream sections (Figure 2) while those of the Barakar Formation were collected from three bore- holes during exploration stage. Petrographic studies have been carried out from thin sections. Following Basu et al. [27] the quartz grains were identified as monocrystalline (undulatory and nonundulatory) and polycrystalline (2 - 3 crystal units and more than 3 crystal units per grain). Feldspars were grouped under potash and plagioclase feldspars. The metamorphic and sedimentary rock frag- ments were readily identified because of their greater abundance in comparison to the igneous rock fragments, which were minimal and negligible. Though garnet, mi- cas and opaque minerals were encountered in modal analysis, their frequencies were not taken into considera- tion in the present study. All the framework grains e.g. quartz, feldspar and rock fragments, regardless of the degree of alteration and replace ment were counted as the original grain types. A total number of 105 sandstone samples, 25 from the Karharbari Formation, 45 from the Barakar Formation and 35 from the Barren Measures Formation were studied in the present work. The modal analysis data of the Damuda sandstones are presented in Table 2. The recalculated values (Tables 3 and 4) were plotted in sandstone classification diagram of Dott [28], diamond plot of Basu et al. [27], bivariate plot of Suttner  R. N. HOTA ET AL. Copyright © 2011 SciRes. IJG 123 Table 1. Stratigraphic di visions of the Gondw ana rocks of the Talchir basin (modified after Goswami et al. 2006). Age Formation/Member Lithology Recent Alluvium and laterite Upper Permian to Upper Triassic Kamthi Medium to coarse grained, pebbly cross-bedded ferruginous sandstones, clasts of greenish-white and grayish-white shales, pink clays. Disconformity Middle Permian Damuda Group Barren Measures Coarse to medium grained greenish grey feldspathic sandstones with shreds and lenses of chocolate coloured clay, micaceous siltstone, dark gray shale, carbonaceous shale, purple brown shale and clay ironstone. Late Lower Permian Barakar Fine to coarse grained feldspathic whitish sandstones, gray shale, carbo- naceous shale, fireclay and ten coal seams. Late Lower Permian Boulder Gravel Unit Clast-supported boulder gravel and matrix-supported boulder conglome- rate. Middle Lower Permian Karharbari Medium to Coarse grained whitish arkosic sandstones, carbonaceous shale, gray shale and one coal seam. Disconformity Early Lower Permian Talchir Diamictites, rhythmites, turbidites, conglomerate, fine to me- dium-grained greenish sandstones, olive coloured needle shales, turbi- dite, tiliets and tilloids etc. Nonconformity Precambrian Eastern Ghats Supergroup Khondalite, charnockite, mica schist, leptynite, quartzite, acid-gneiss and pyroxene granulite intruded by granitic plutons, pegmatite veins and basic igneous rocks. and Dutta [6] and ternary diagrams of Dickinson and others [1-4] for classification of sandstones and prove- nance interpretation. Equality of quartz, feldspars and rock fragments of all the three formations of the Damuda Group were statistically tested to ascertain significant change in provenance lithology, if any. Further, linear discriminant functions involving framework lithologies stated above were determined between pairs of forma- tions of the Damuda Group to discriminate one forma- tion from the other. The statistical analyses were carried out by the procedures outlined by Davis [29]. The clo- sure effect of petrographic data did not arise as the amount of heavy accessories, matrix and cement ware not taken into account in statistical analyses i.e. the sum of mono- and poly-crystalline quartz, potash and pla- gioclase feldspars and metamorphic and sedimentary rock fragments in all cases are different and less than 100%. 4. Sandstone Composition The sandstones of all the three formations of the Damuda Group are fine to coarse-grained, poor to moderately sorted with high amount of argillaceous matrix that has made them soft and friable. The matrix and cement con- tent of all the sandstones are more than 15% (Table 2). Thus, they are all wackes and plot in the arkosic- and lithic-wacke fields of Dott [28]. However, some sand- stones of the Karharbari Formation are quartz wackes (Figure 3). Though the petrographic constituents of all the 105 sandstones show variation to certain extent, the average Damuda sandstone is composed of 37.30% mo- nocrystalline nonundulatory quartz, 10.19% monocrys- talline undulato ry quartz, 7.96 % polycrystalline quartz o f 2-3 crystal units per grain, 5.01% polycrystalline quartz of more than 3 crystal units per grain, 4.76% potash feldspar, 0.66% plagioclase feldspar, 1.65% metamor- phic rock fragments, 3.26% sedimentary rock fragments, 2.37% heavy accessory minerals and 26.85% matrix and cement (Table 2). High standard deviations in most cas- es suggest appreciable variation of sandstone composi- tion. In spite of wide dissimilarity, so me remarkable var- iations have been noticed in the average composition of the sandstones in upward progression. The monocrystal- line nonundulatory quartz, polycrystalline quartz of 2-3 crystal units per grain, potash feldspar, metamorphic rock fragments and total framework grains show de- creasing and increasing trends from Karharbari to Bara- kar and Barakar to Barren Measures formations respec- tively (Figure 4). Polycrystalline quartz of more than 3 crystal units per grain, plagioclase feldspars, sedimentary rock fragments and matrix and cement show increasing and decreasing trend in upward succession. In contrast,  R. N. HOTA ET AL. Copyright © 2011 SciRes. IJG 124 Table 2. Modal analysis data (in percent) of the Damuda sandstones. Sample No. Qmnu Qmu Qp2-3 Qp>3 K P Rm Rs A Clastic M + C (a) Karharbari Formation K-1 38.55 17.42 12.10 2.90 2.10 0.81 2.90 1.45 0.81 79.03 20.97 K-2 37.66 17.57 10.46 5.23 2.09 0.63 4.60 1.67 0.21 80.13 19.87 K-3 39.31 17.55 9.69 5.48 2.19 0.73 3.66 1.46 0.73 80.80 19.20 K-4 44.38 15.29 4.24 2.21 2.39 0.92 2.76 1.47 0.74 74.40 25.60 K-5 36.36 17.80 6.19 3.16 2.78 0.00 2.65 1.14 0.51 70.58 29.42 K-6 46.17 21.11 6.07 1.19 2.51 0.53 3.17 1.72 0.13 82.59 17.41 K-7 42.20 19.38 7.06 2.79 2.63 0.00 0.33 4.11 0.33 78.82 21.18 K-8 41.10 15.46 9.98 0.00 5.48 0.39 0.39 1.57 0.00 74.36 25.64 K-9 44.34 14.05 11.68 0.18 4.38 0.00 1.46 0.18 0.18 76.46 23.54 K-10 47.77 20.21 3.25 3.77 4.79 0.00 1.03 1.54 0.00 82.36 17.64 K-11 52.56 16.44 0.81 3.50 4.45 0.27 2.16 0.67 0.00 80.86 19.14 K-12 43.61 19.04 2.89 0.00 4.10 0.00 0.00 1.45 0.24 71.33 28.67 K-13 47.42 21.40 2.03 3.69 4.80 0.00 2.03 0.92 0.00 82.29 17.71 K-14 42.35 28.82 1.08 2.03 6.22 0.00 1.22 1.35 0.00 83.09 16.91 K-15 38.70 29.79 2.97 1.14 5.02 0.00 2.85 1.03 0.00 81.51 18.49 K-16 41.22 27.15 1.20 4.58 6.22 0.00 0.55 0.44 0.00 81.35 18.65 K-17 49.23 8.33 7.72 4.32 6.79 0.15 0.93 0.46 0.00 77.93 22.07 K-18 44.51 29.76 1.67 0.00 2.92 0.28 0.28 2.50 0.00 81.92 18.08 K-19 52.90 11.30 3.45 0.63 2.83 0.31 0.94 1.41 0.00 73.78 26.22 K-20 45.01 22.87 3.63 0.18 4.36 0.18 0.73 0.91 0.00 77.86 22.14 K-21 43.91 18.91 7.97 3.59 2.34 0.78 3.44 0.31 0.16 81.41 18.59 K-22 63.41 3.66 1.42 0.00 2.64 1.02 0.61 1.02 0.61 74.39 25.61 K-23 41.00 18.31 7.46 3.08 2.43 0.49 2.76 1.78 0.65 77.96 22.04 K-24 45.81 19.66 4.10 2.05 4.96 0.17 1.20 1.03 0.34 79.32 20.68 K-25 46.08 20.35 3.63 2.03 4.36 0.29 1.31 1.02 0.29 78.92 21.08 Mean 44.62 18.87 5.31 2.31 3.83 0.32 1.76 1.30 0.24 78.54 21.46 SD 5.76 6.12 3.52 1.74 1.46 0.33 1.26 0.79 0.28 3.60 3.60 (b) Barakar Formation B-1 28.57 10.76 6.17 6.17 2.65 1.06 0.00 4.23 0.35 59.96 40.04 B-2 30.50 6.50 4.17 5.17 0.83 1.00 0.00 5.00 0.83 54.00 46.00 B-3 31.96 12.22 9.23 5.26 1.99 1.28 0.99 3.13 1.85 67.90 32.10 B-4 31.30 5.87 3.48 15.00 1.30 1.30 1.85 6.30 0.11 66.52 33.48 B-5 23.70 4.13 5.33 13.59 3.48 0.54 0.00 4.35 9.57 64.67 35.33 B-6 29.34 8.62 1.68 6.59 4.67 0.24 0.24 6.35 9.10 66.83 33.17 B-7 36.13 8.80 5.20 5.07 3.73 0.67 0.13 6.27 3.87 69.87 30.13 B-8 33.38 6.28 1.47 6.81 2.00 1.47 0.00 6.94 0.53 58.88 41.12 B-9 31.79 6.67 6.67 10.83 4.40 0.24 0.00 5.24 0.83 66.67 33.33 B-10 32.01 8.17 4.20 7.72 2.84 0.23 0.00 5.56 1.70 62.43 37.57  R. N. HOTA ET AL. Copyright © 2011 SciRes. IJG 125 B-11 30.80 11.26 4.94 10.11 4.02 0.00 0.00 4.83 0.00 65.98 34.02 B-12 35.70 5.00 0.90 10.40 2.70 0.50 0.00 7.90 1.60 64.70 35.30 B-13 29.90 10.20 5.50 6.20 3.50 0.50 0.00 6.20 2.10 64.10 35.90 B-14 34.39 6.63 1.33 9.69 2.24 0.31 0.00 3.57 5.51 63.67 36.33 B-15 31.80 8.40 4.40 7.90 2.90 0.40 0.00 4.80 3.70 64.30 35.70 B-16 26.90 11.00 4.30 5.30 3.70 0.50 0.00 6.90 2.60 61.20 38.80 B-17 24.07 14.77 10.94 2.19 3.94 0.66 0.00 7.22 1.64 65.43 34.57 B-18 34.10 4.90 4.70 8.90 5.30 0.60 0.80 2.50 1.20 63.00 37.00 B-19 33.70 5.77 12.52 2.49 2.19 1.19 0.00 9.34 1.29 68.49 31.51 B-20 25.47 7.56 5.67 12.24 3.56 0.78 0.00 7.56 4.67 67.52 32.48 B-21 17.00 13.30 10.30 16.60 8.00 0.80 0.00 3.00 2.00 71.00 29.00 B-22 27.80 4.70 2.90 17.90 6.00 0.30 0.00 5.30 2.30 67.20 32.80 B-23 26.25 12.00 4.88 9.13 3.88 1.75 0.00 6.88 4.00 68.75 31.25 B-24 32.50 11.63 5.88 8.00 4.00 0.75 1.38 8.13 0.25 72.50 27.50 B-25 33.50 11.00 0.88 8.63 4.25 3.38 0.00 1.75 4.88 68.25 31.75 B-26 31.00 4.75 3.88 15.13 1.38 1.00 1.50 5.88 1.75 66.25 33.75 B-27 31.49 18.24 2.16 13.51 3.92 2.57 0.00 3.78 0.54 76.22 23.78 B-28 35.47 11.86 3.68 17.44 2.85 2.02 0.36 2.73 0.00 76.39 23.61 B-29 39.33 12.67 3.20 4.67 2.93 1.33 0.00 7.07 0.53 71.73 28.27 B-30 35.80 9.55 8.15 1.53 2.42 1.27 0.00 3.18 1.78 63.69 36.31 B-31 33.80 10.00 3.80 8.20 1.70 1.30 0.00 6.40 0.80 66.00 34.00 B-32 32.97 9.05 2.70 15.27 1.62 2.30 0.00 10.00 2.30 76.22 23.78 B-33 30.41 16.02 6.43 9.49 1.63 2.24 0.00 10.82 0.20 77.24 22.76 B-34 31.00 18.38 3.75 6.50 6.88 1.88 0.00 2.25 6.50 77.13 22.88 B-35 32.70 12.90 4.20 10.30 1.80 0.90 2.00 3.20 0.80 68.80 31.20 B-36 33.33 14.69 2.61 8.70 2.32 1.55 1.45 3.57 0.19 68.41 31.59 B-37 39.31 9.10 2.62 8.00 2.07 2.07 0.00 3.72 0.83 67.72 32.28 B-38 26.14 12.14 6.57 13.14 1.57 1.57 0.00 6.00 2.00 69.14 30.86 B-39 30.82 8.08 3.70 3.70 0.68 3.56 0.00 5.89 1.23 57.67 42.33 B-40 30.40 12.60 5.00 7.80 0.50 0.90 0.00 5.70 0.50 63.40 36.60 B-41 32.60 8.80 5.40 6.20 0.70 1.50 0.20 9.50 0.40 65.30 34.70 B-42 26.85 12.03 4.04 9.82 2.21 1.15 0.00 6.35 6.64 69.10 30.90 B-43 28.67 12.78 5.44 6.78 1.11 1.33 0.00 7.00 0.56 63.67 36.33 B-44 30.03 14.87 1.81 8.87 1.43 1.14 0.00 6.96 0.10 65.20 34.80 B-45 31.20 6.96 7.24 1.67 2.23 1.81 0.00 8.91 0.97 61.00 39.00 Mean 31.02 10.04 4.76 8.77 2.89 1.20 0.24 5.74 2.11 66.76 33.24 SD 4.08 3.59 2.56 4.14 1.62 0.79 0.54 2.17 2.33 5.06 5.06 (c) Barren Measures Formation BM-1 22.38 4.29 13.33 2.38 19.52 0.48 6.67 3.81 1.43 74.29 25.71 BM-2 57.03 3.80 2.28 0.38 6.08 2.28 2.66 1.90 1.90 78.33 21.67 BM-3 18.91 5.96 23.06 3.11 9.33 0.00 8.81 4.40 2.07 75.65 24.35  R. N. HOTA ET AL. Copyright © 2011 SciRes. IJG 126 BM-4 27.19 4.69 29.38 4.38 1.88 0.00 3.13 1.88 1.88 74.38 25.63 BM-5 20.13 3.57 34.74 3.57 2.92 0.97 2.27 1.95 3.90 74.03 25.97 BM-6 34.62 2.88 14.66 1.44 5.29 0.00 3.13 0.96 5.77 68.75 31.25 BM-7 36.89 6.61 7.89 1.07 9.81 0.43 2.56 1.07 8.53 74.84 25.16 BM-8 32.95 5.81 5.81 1.16 11.24 0.00 6.98 0.39 12.40 76.74 23.26 BM-9 36.69 1.68 20.62 2.16 8.39 0.00 4.08 1.20 3.60 78.42 21.58 BM-10 41.58 1.08 9.68 1.79 2.51 0.00 3.23 0.00 12.54 72.40 27.60 BM-11 37.92 2.88 17.96 2.66 5.10 0.00 2.88 0.44 7.98 77.83 22.17 BM-12 26.34 2.57 25.74 2.97 7.13 0.00 3.56 1.98 9.50 79.80 20.20 BM-13 37.91 5.74 13.22 2.00 2.24 0.00 2.99 1.25 9.98 75.31 24.69 BM-14 34.62 4.06 19.44 2.78 1.92 0.00 2.78 0.85 7.69 74.15 25.85 BM-15 41.44 1.10 14.55 2.76 7.00 0.00 1.66 1.29 8.66 78.45 21.55 BM-16 47.63 2.49 3.24 0.50 5.24 0.00 2.74 0.50 12.72 75.06 24.94 BM-17 46.51 4.57 14.25 2.69 6.72 0.27 1.88 0.00 4.84 81.72 18.28 BM-18 35.34 5.30 24.38 3.53 8.13 0.00 2.12 0.00 2.83 81.63 18.37 BM-19 31.19 5.20 16.82 3.06 12.84 0.31 1.53 0.31 3.98 75.23 24.77 BM-20 40.88 5.66 8.18 1.26 11.32 0.00 6.29 1.26 4.40 79.25 20.75 BM-21 31.31 3.51 21.73 4.15 11.50 0.00 3.19 1.92 1.92 79.23 20.77 BM-22 34.04 4.96 19.15 2.13 14.54 0.35 2.48 1.42 0.71 79.79 20.21 BM-23 50.56 6.18 5.62 1.12 6.74 0.00 7.87 2.81 1.12 82.02 17.98 BM-24 44.67 5.21 14.89 1.74 9.18 0.25 2.23 1.49 0.99 80.65 19.35 BM-25 44.48 2.91 16.57 3.20 7.56 0.00 2.33 1.45 0.29 78.78 21.22 BM-26 48.93 3.33 8.55 1.43 12.83 0.95 2.85 1.66 1.19 81.71 18.29 BM-27 40.86 1.17 12.84 2.33 8.56 0.00 5.06 1.95 1.56 74.32 25.68 BM-28 47.85 5.28 12.21 1.98 5.28 0.00 2.31 1.98 0.66 77.56 22.44 BM-29 49.88 2.38 13.78 2.38 9.50 0.24 1.66 1.19 0.00 81.00 19.00 BM-30 47.94 1.52 14.53 3.04 5.21 0.00 1.74 1.08 3.04 78.09 21.91 BM-31 57.06 5.59 5.59 1.18 2.35 0.00 2.06 1.76 1.76 77.35 22.65 BM-32 54.97 4.68 3.51 0.58 2.92 0.00 6.43 3.51 1.75 78.36 21.64 BM-33 57.24 8.82 1.50 0.00 10.32 0.33 2.16 1.16 0.50 82.03 17.97 BM-34 47.96 7.19 3.60 0.48 15.59 0.48 2.16 0.48 0.24 78.18 21.82 BM-35 39.13 4.08 15.49 1.90 7.61 0.54 2.17 1.90 5.43 78.26 21.74 Mean 40.14 4.19 13.97 2.09 7.84 0.23 3.39 1.46 4.22 77.53 22.47 SD 10.11 1.82 7.84 1.08 4.13 0.44 1.89 1.00 3.81 3.03 3.03 Damuda Group Mean 37.30 10.19 7.96 5.01 4.76 0.66 1.65 3.26 2.37 73.15 26.85 SD 9.04 6.74 6.68 4.37 3.50 0.76 1.89 2.67 3.08 6.93 6.93 Index: Qmnu – Monocrystalline nonundulatory quartz, Qmu – Monocrystalline undulatory quartz, Qp2-3 – Polycrystalline quartz, 2-3 crystal units per grain, Qp>3 – Polycrystalline quartz, more than 3 crystal units per grain, K – Potash feldspar (orthoclase and microcline), P – Plagioclase fel d s par, Rm – Metamorphic rock frag ment, Rs – Sedimentary rock fragment, A – Accessory minerals (garnet, mica and opaque minerals), Clastic – Total framework grains, M + C – Matrix + Cement, SD – Standard deviati on.  R. N. HOTA ET AL. Copyright © 2011 SciRes. IJG 127 Table 3. Recalculated sandstone grain parameters used in the present study (after Dott, 1964; Basu et al., 1975; Dickinson and Suczek, 1979; Ingersoll and Suczek, 1979; Dickinson et al. (1983) and Suttner and Dutta, 1986). QFR Q = Total quartz grains (Qm + Qp) where Qm = Total monocrystalline quartz grains (Qmnu + Qmu) where Qmnu = Monocrystalline nonundulat ory quartz grains Qmu = Monocrystalline undulatory quartz grains Qp = Total polycrystalline quartz grains (Qp2-3 + Qp > 3) where Qp2-3 = Polycrystalline quartz 2-3 crystal units per grain Qp > 3 = Polycrystalline quartz more than 3 crystal units per grain F = Total feldspar grains (K + P) where K = Potash feldspar P = Plagioclase feldspar R = Total rock fragments (Rm + Rs) Rm = Metamorphic rock fragment Rs = Sedimentary rock fragment QtFL Qt = Total quartz grains (Qmnu + Qmu + Qp2-3 + Qp > 3) F = Total feldspar grains (K + P) L = Total rock fragments (Rm + Rs) QmFLt Qm = Total monocrystalline quartz grains (Qmnu + Qmu) F = Total feldspar grains (K + P) Lt = L + Qp (Rm + Rs + Qp2- 3 + Qp > 3) QpLvLs Qp = Total polycrystalline quartz grains (Qp2-3 + Qp > 3) Lv = Total volcanic rock fragments Ls = Rs LvLmLs Lv = Total volcanic rock fragments Lm = Total metamorphic rock fragments Ls = Total sedimentary rock fragments Qp/(F + R) and Qt/(F + R) Qp = Total polycrystalline quartz grains (Qp2-3 + Qp > 3) F = Total feldspar grains (K + P) R = Total rock fragments (Rm + Rs) Qt = Total quartz grains (Qmnu + Qmu + Qp2-3 + Qp > 3) 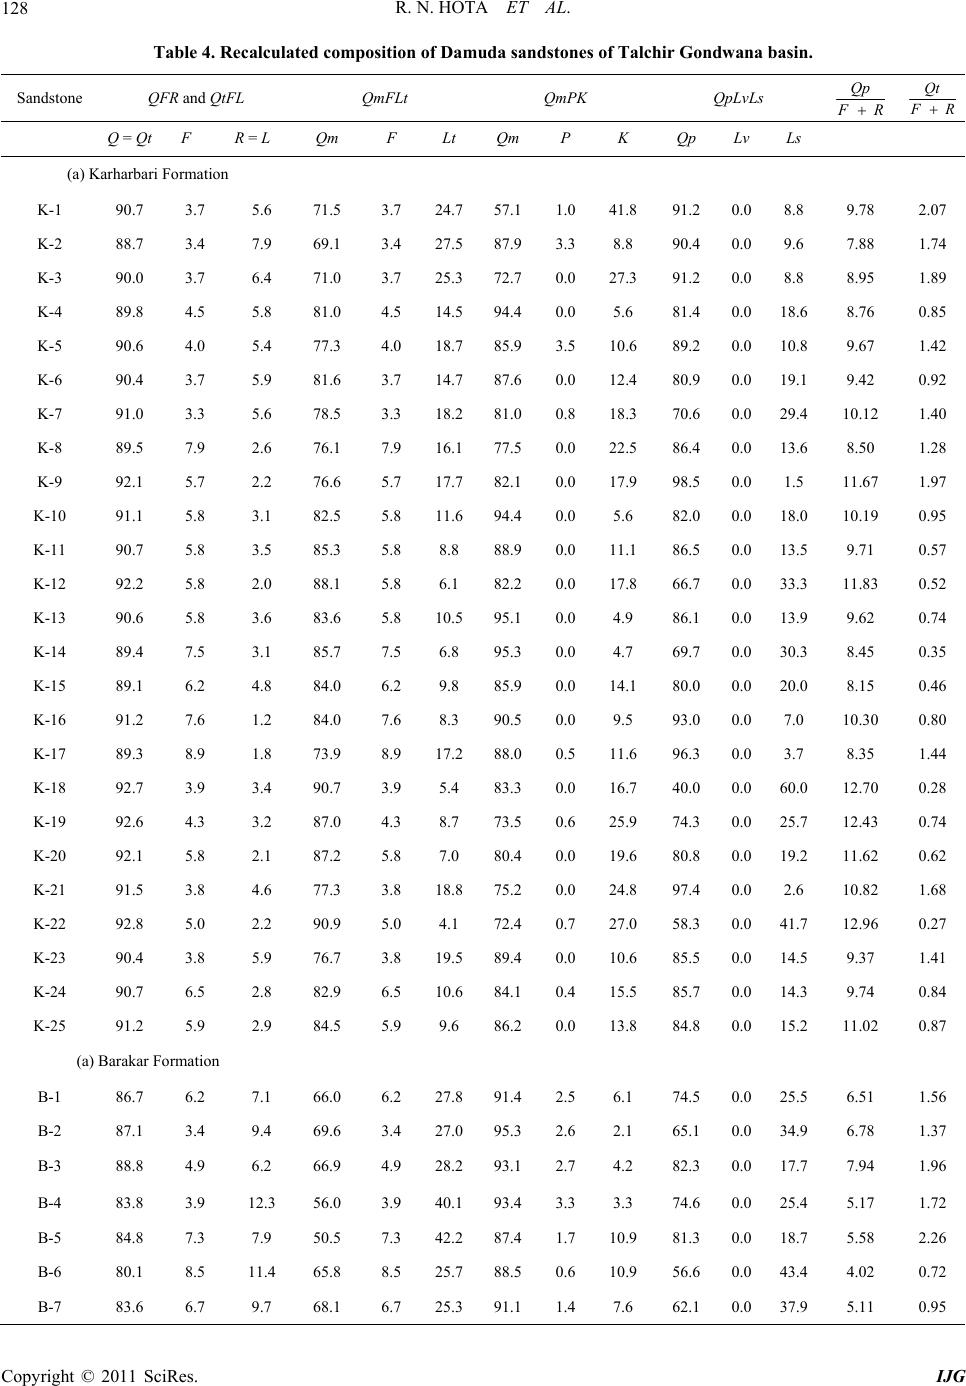 R. N. HOTA ET AL. Copyright © 2011 SciRes. IJG 128 Table 4. Recalculated composition of Damuda sandstones of Talchir Gondwana basin. Sandstone QFR and QtFL QmFLt QmPK QpLvLs Qp F R Qt F R Q = Qt F R = L Qm F Lt Qm P K Qp Lv Ls (a) Karharbari Formation K-1 90.7 3.7 5.6 71.5 3.7 24.757.1 1.041.8 91.2 0.0 8.8 9.78 2.07 K-2 88.7 3.4 7.9 69.1 3.4 27.587.9 3.38.8 90.4 0.0 9.6 7.88 1.74 K-3 90.0 3.7 6.4 71.0 3.7 25.372.7 0.027.3 91.2 0.0 8.8 8.95 1.89 K-4 89.8 4.5 5.8 81.0 4.5 14.594.4 0.05.6 81.4 0.0 18.6 8.76 0.85 K-5 90.6 4.0 5.4 77.3 4.0 18.785.9 3.510.6 89.2 0.0 10.8 9.67 1.42 K-6 90.4 3.7 5.9 81.6 3.7 14.787.6 0.012.4 80.9 0.0 19.1 9.42 0.92 K-7 91.0 3.3 5.6 78.5 3.3 18.281.0 0.818.3 70.6 0.0 29.4 10.12 1.40 K-8 89.5 7.9 2.6 76.1 7.9 16.177.5 0.022.5 86.4 0.0 13.6 8.50 1.28 K-9 92.1 5.7 2.2 76.6 5.7 17.782.1 0.017.9 98.5 0.0 1.5 11.67 1.97 K-10 91.1 5.8 3.1 82.5 5.8 11.694.4 0.05.6 82.0 0.0 18.0 10.19 0.95 K-11 90.7 5.8 3.5 85.3 5.8 8.8 88.9 0.011.1 86.5 0.0 13.5 9.71 0.57 K-12 92.2 5.8 2.0 88.1 5.8 6.1 82.2 0.017.8 66.7 0.0 33.3 11.83 0.52 K-13 90.6 5.8 3.6 83.6 5.8 10.595.1 0.04.9 86.1 0.0 13.9 9.62 0.74 K-14 89.4 7.5 3.1 85.7 7.5 6.8 95.3 0.04.7 69.7 0.0 30.3 8.45 0.35 K-15 89.1 6.2 4.8 84.0 6.2 9.8 85.9 0.014.1 80.0 0.0 20.0 8.15 0.46 K-16 91.2 7.6 1.2 84.0 7.6 8.3 90.5 0.09.5 93.0 0.0 7.0 10.30 0.80 K-17 89.3 8.9 1.8 73.9 8.9 17.288.0 0.511.6 96.3 0.0 3.7 8.35 1.44 K-18 92.7 3.9 3.4 90.7 3.9 5.4 83.3 0.016.7 40.0 0.0 60.0 12.70 0.28 K-19 92.6 4.3 3.2 87.0 4.3 8.7 73.5 0.625.9 74.3 0.0 25.7 12.43 0.74 K-20 92.1 5.8 2.1 87.2 5.8 7.0 80.4 0.019.6 80.8 0.0 19.2 11.62 0.62 K-21 91.5 3.8 4.6 77.3 3.8 18.875.2 0.024.8 97.4 0.0 2.6 10.82 1.68 K-22 92.8 5.0 2.2 90.9 5.0 4.1 72.4 0.727.0 58.3 0.0 41.7 12.96 0.27 K-23 90.4 3.8 5.9 76.7 3.8 19.589.4 0.010.6 85.5 0.0 14.5 9.37 1.41 K-24 90.7 6.5 2.8 82.9 6.5 10.684.1 0.415.5 85.7 0.0 14.3 9.74 0.84 K-25 91.2 5.9 2.9 84.5 5.9 9.6 86.2 0.013.8 84.8 0.0 15.2 11.02 0.87 (a) Barakar Formation B-1 86.7 6.2 7.1 66.0 6.2 27.891.4 2.56.1 74.5 0.0 25.5 6.51 1.56 B-2 87.1 3.4 9.4 69.6 3.4 27.095.3 2.62.1 65.1 0.0 34.9 6.78 1.37 B-3 88.8 4.9 6.2 66.9 4.9 28.293.1 2.74.2 82.3 0.0 17.7 7.94 1.96 B-4 83.8 3.9 12.3 56.0 3.9 40.193.4 3.33.3 74.6 0.0 25.4 5.17 1.72 B-5 84.8 7.3 7.9 50.5 7.3 42.287.4 1.710.9 81.3 0.0 18.7 5.58 2.26 B-6 80.1 8.5 11.4 65.8 8.5 25.788.5 0.610.9 56.6 0.0 43.4 4.02 0.72 B-7 83.6 6.7 9.7 68.1 6.7 25.391.1 1.47.6 62.1 0.0 37.9 5.11 0.95 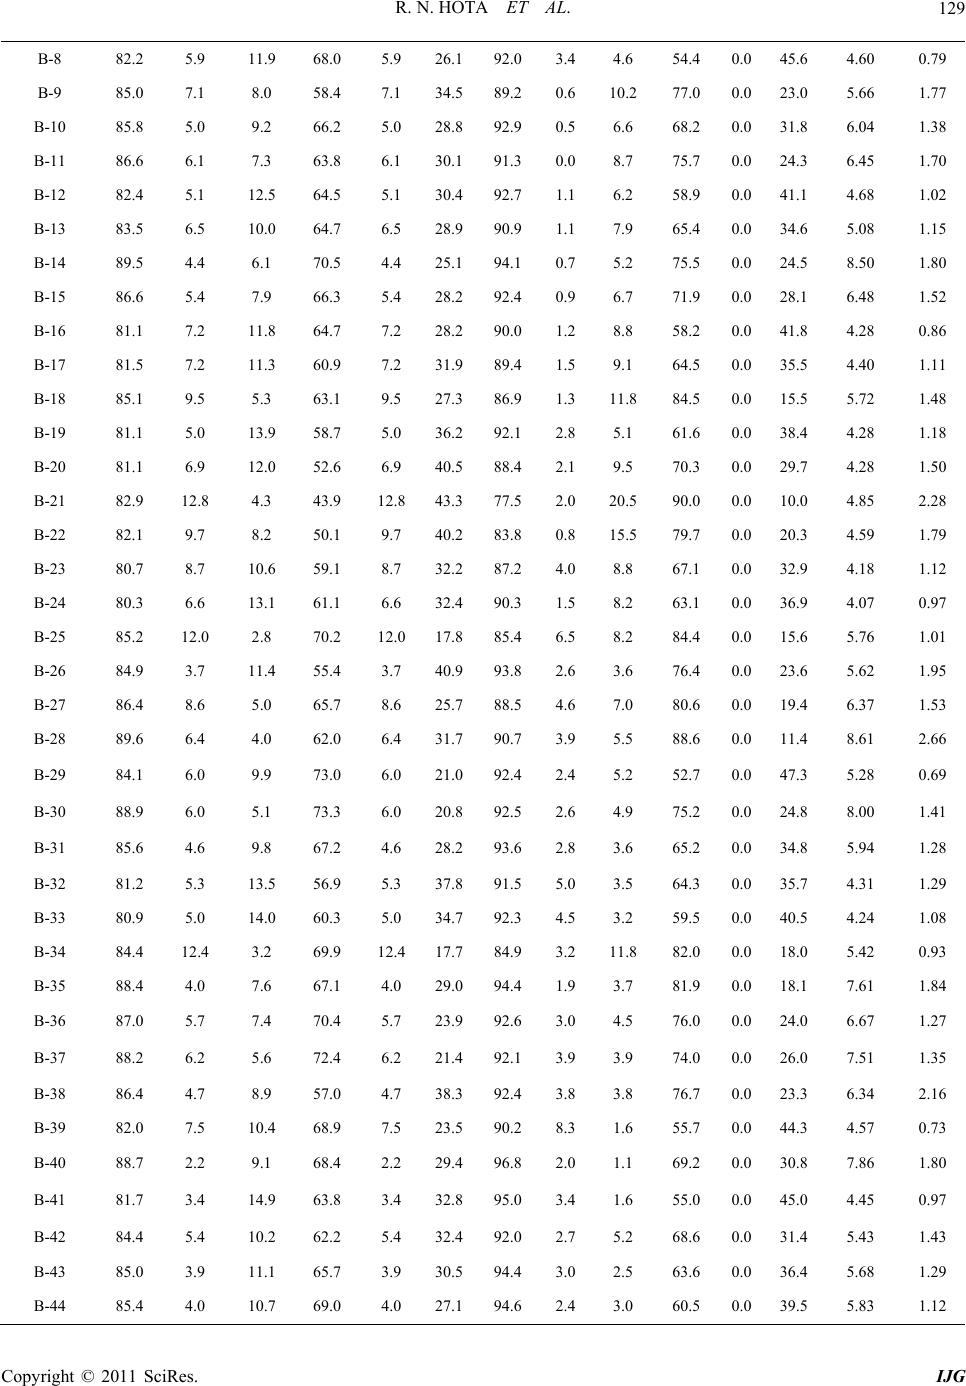 R. N. HOTA ET AL. Copyright © 2011 SciRes. IJG 129 B-8 82.2 5.9 11.9 68.0 5.9 26.192.0 3.44.6 54.4 0.0 45.6 4.60 0.79 B-9 85.0 7.1 8.0 58.4 7.1 34.589.2 0.610.2 77.0 0.0 23.0 5.66 1.77 B-10 85.8 5.0 9.2 66.2 5.0 28.892.9 0.56.6 68.2 0.0 31.8 6.04 1.38 B-11 86.6 6.1 7.3 63.8 6.1 30.191.3 0.08.7 75.7 0.0 24.3 6.45 1.70 B-12 82.4 5.1 12.5 64.5 5.1 30.492.7 1.16.2 58.9 0.0 41.1 4.68 1.02 B-13 83.5 6.5 10.0 64.7 6.5 28.990.9 1.17.9 65.4 0.0 34.6 5.08 1.15 B-14 89.5 4.4 6.1 70.5 4.4 25.194.1 0.75.2 75.5 0.0 24.5 8.50 1.80 B-15 86.6 5.4 7.9 66.3 5.4 28.292.4 0.96.7 71.9 0.0 28.1 6.48 1.52 B-16 81.1 7.2 11.8 64.7 7.2 28.290.0 1.28.8 58.2 0.0 41.8 4.28 0.86 B-17 81.5 7.2 11.3 60.9 7.2 31.989.4 1.59.1 64.5 0.0 35.5 4.40 1.11 B-18 85.1 9.5 5.3 63.1 9.5 27.386.9 1.311.8 84.5 0.0 15.5 5.72 1.48 B-19 81.1 5.0 13.9 58.7 5.0 36.292.1 2.85.1 61.6 0.0 38.4 4.28 1.18 B-20 81.1 6.9 12.0 52.6 6.9 40.588.4 2.19.5 70.3 0.0 29.7 4.28 1.50 B-21 82.9 12.8 4.3 43.9 12.8 43.377.5 2.020.5 90.0 0.0 10.0 4.85 2.28 B-22 82.1 9.7 8.2 50.1 9.7 40.283.8 0.815.5 79.7 0.0 20.3 4.59 1.79 B-23 80.7 8.7 10.6 59.1 8.7 32.287.2 4.08.8 67.1 0.0 32.9 4.18 1.12 B-24 80.3 6.6 13.1 61.1 6.6 32.490.3 1.58.2 63.1 0.0 36.9 4.07 0.97 B-25 85.2 12.0 2.8 70.2 12.0 17.885.4 6.58.2 84.4 0.0 15.6 5.76 1.01 B-26 84.9 3.7 11.4 55.4 3.7 40.993.8 2.63.6 76.4 0.0 23.6 5.62 1.95 B-27 86.4 8.6 5.0 65.7 8.6 25.788.5 4.67.0 80.6 0.0 19.4 6.37 1.53 B-28 89.6 6.4 4.0 62.0 6.4 31.790.7 3.95.5 88.6 0.0 11.4 8.61 2.66 B-29 84.1 6.0 9.9 73.0 6.0 21.092.4 2.45.2 52.7 0.0 47.3 5.28 0.69 B-30 88.9 6.0 5.1 73.3 6.0 20.892.5 2.64.9 75.2 0.0 24.8 8.00 1.41 B-31 85.6 4.6 9.8 67.2 4.6 28.293.6 2.83.6 65.2 0.0 34.8 5.94 1.28 B-32 81.2 5.3 13.5 56.9 5.3 37.891.5 5.03.5 64.3 0.0 35.7 4.31 1.29 B-33 80.9 5.0 14.0 60.3 5.0 34.792.3 4.53.2 59.5 0.0 40.5 4.24 1.08 B-34 84.4 12.4 3.2 69.9 12.4 17.784.9 3.211.8 82.0 0.0 18.0 5.42 0.93 B-35 88.4 4.0 7.6 67.1 4.0 29.094.4 1.93.7 81.9 0.0 18.1 7.61 1.84 B-36 87.0 5.7 7.4 70.4 5.7 23.992.6 3.04.5 76.0 0.0 24.0 6.67 1.27 B-37 88.2 6.2 5.6 72.4 6.2 21.492.1 3.93.9 74.0 0.0 26.0 7.51 1.35 B-38 86.4 4.7 8.9 57.0 4.7 38.392.4 3.83.8 76.7 0.0 23.3 6.34 2.16 B-39 82.0 7.5 10.4 68.9 7.5 23.590.2 8.31.6 55.7 0.0 44.3 4.57 0.73 B-40 88.7 2.2 9.1 68.4 2.2 29.496.8 2.01.1 69.2 0.0 30.8 7.86 1.80 B-41 81.7 3.4 14.9 63.8 3.4 32.895.0 3.41.6 55.0 0.0 45.0 4.45 0.97 B-42 84.4 5.4 10.2 62.2 5.4 32.492.0 2.75.2 68.6 0.0 31.4 5.43 1.43 B-43 85.0 3.9 11.1 65.7 3.9 30.594.4 3.02.5 63.6 0.0 36.4 5.68 1.29 B-44 85.4 4.0 10.7 69.0 4.0 27.194.6 2.43.0 60.5 0.0 39.5 5.83 1.12 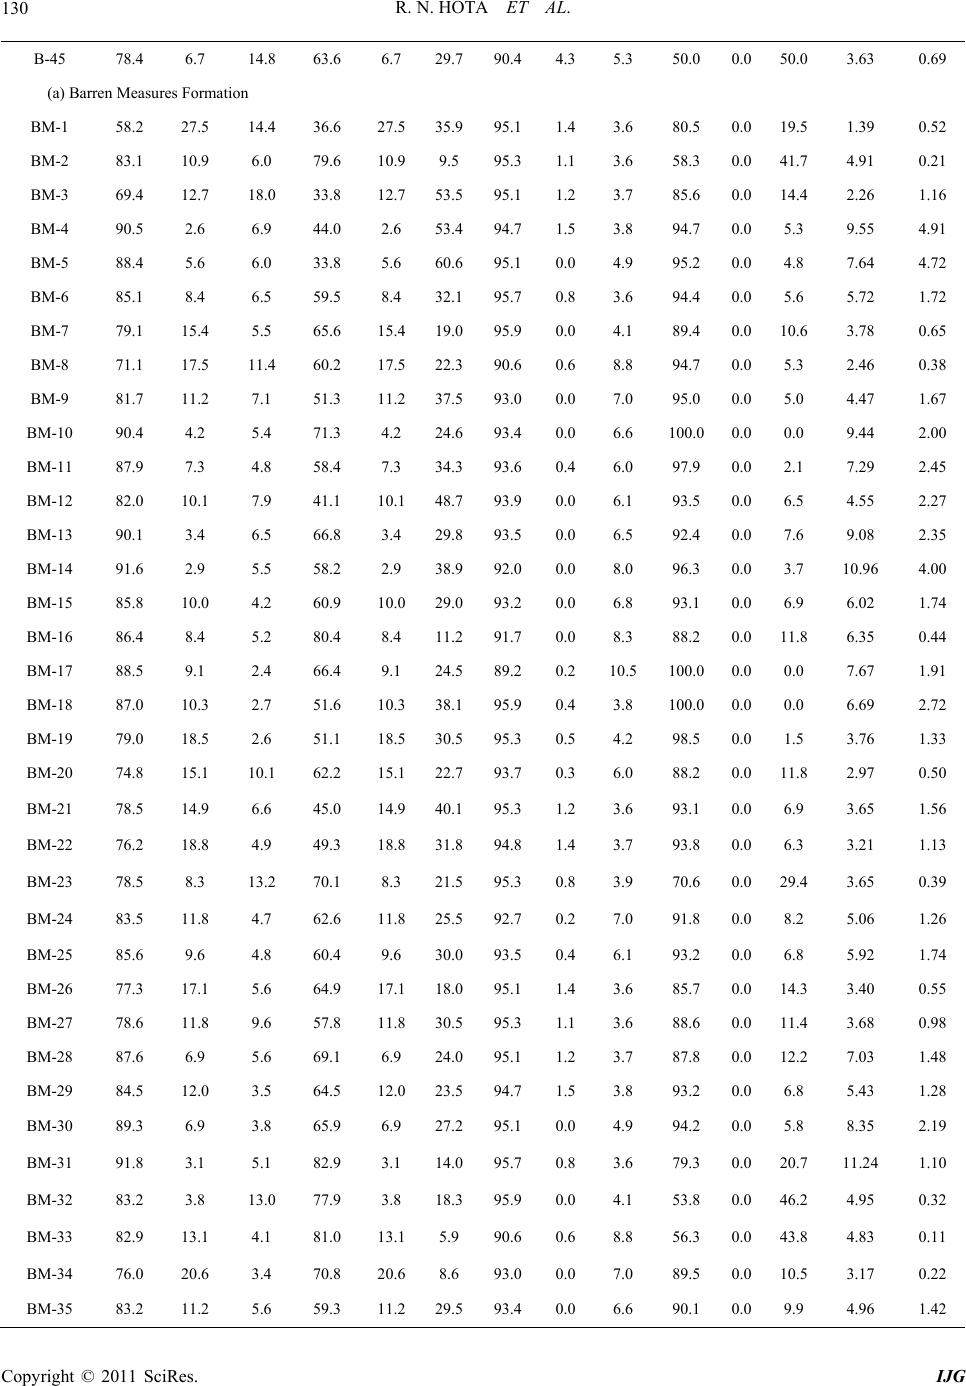 R. N. HOTA ET AL. Copyright © 2011 SciRes. IJG 130 B-45 78.4 6.7 14.8 63.6 6.7 29.790.4 4.35.3 50.0 0.0 50.0 3.63 0.69 (a) Barren Measures Formation BM-1 58.2 27.5 14.4 36.6 27.5 35.995.1 1.43.6 80.5 0.0 19.5 1.39 0.52 BM-2 83.1 10.9 6.0 79.6 10.9 9.5 95.3 1.13.6 58.3 0.0 41.7 4.91 0.21 BM-3 69.4 12.7 18.0 33.8 12.7 53.595.1 1.23.7 85.6 0.0 14.4 2.26 1.16 BM-4 90.5 2.6 6.9 44.0 2.6 53.494.7 1.53.8 94.7 0.0 5.3 9.55 4.91 BM-5 88.4 5.6 6.0 33.8 5.6 60.695.1 0.04.9 95.2 0.0 4.8 7.64 4.72 BM-6 85.1 8.4 6.5 59.5 8.4 32.195.7 0.83.6 94.4 0.0 5.6 5.72 1.72 BM-7 79.1 15.4 5.5 65.6 15.4 19.095.9 0.04.1 89.4 0.0 10.6 3.78 0.65 BM-8 71.1 17.5 11.4 60.2 17.5 22.390.6 0.68.8 94.7 0.0 5.3 2.46 0.38 BM-9 81.7 11.2 7.1 51.3 11.2 37.593.0 0.07.0 95.0 0.0 5.0 4.47 1.67 BM-10 90.4 4.2 5.4 71.3 4.2 24.693.4 0.06.6 100.00.0 0.0 9.44 2.00 BM-11 87.9 7.3 4.8 58.4 7.3 34.393.6 0.46.0 97.9 0.0 2.1 7.29 2.45 BM-12 82.0 10.1 7.9 41.1 10.1 48.793.9 0.06.1 93.5 0.0 6.5 4.55 2.27 BM-13 90.1 3.4 6.5 66.8 3.4 29.893.5 0.06.5 92.4 0.0 7.6 9.08 2.35 BM-14 91.6 2.9 5.5 58.2 2.9 38.992.0 0.08.0 96.3 0.0 3.7 10.96 4.00 BM-15 85.8 10.0 4.2 60.9 10.0 29.093.2 0.06.8 93.1 0.0 6.9 6.02 1.74 BM-16 86.4 8.4 5.2 80.4 8.4 11.291.7 0.08.3 88.2 0.0 11.8 6.35 0.44 BM-17 88.5 9.1 2.4 66.4 9.1 24.589.2 0.210.5 100.00.0 0.0 7.67 1.91 BM-18 87.0 10.3 2.7 51.6 10.3 38.195.9 0.43.8 100.00.0 0.0 6.69 2.72 BM-19 79.0 18.5 2.6 51.1 18.5 30.595.3 0.54.2 98.5 0.0 1.5 3.76 1.33 BM-20 74.8 15.1 10.1 62.2 15.1 22.793.7 0.36.0 88.2 0.0 11.8 2.97 0.50 BM-21 78.5 14.9 6.6 45.0 14.9 40.195.3 1.23.6 93.1 0.0 6.9 3.65 1.56 BM-22 76.2 18.8 4.9 49.3 18.8 31.894.8 1.43.7 93.8 0.0 6.3 3.21 1.13 BM-23 78.5 8.3 13.2 70.1 8.3 21.595.3 0.83.9 70.6 0.0 29.4 3.65 0.39 BM-24 83.5 11.8 4.7 62.6 11.8 25.592.7 0.27.0 91.8 0.0 8.2 5.06 1.26 BM-25 85.6 9.6 4.8 60.4 9.6 30.093.5 0.46.1 93.2 0.0 6.8 5.92 1.74 BM-26 77.3 17.1 5.6 64.9 17.1 18.095.1 1.43.6 85.7 0.0 14.3 3.40 0.55 BM-27 78.6 11.8 9.6 57.8 11.8 30.595.3 1.13.6 88.6 0.0 11.4 3.68 0.98 BM-28 87.6 6.9 5.6 69.1 6.9 24.095.1 1.23.7 87.8 0.0 12.2 7.03 1.48 BM-29 84.5 12.0 3.5 64.5 12.0 23.594.7 1.53.8 93.2 0.0 6.8 5.43 1.28 BM-30 89.3 6.9 3.8 65.9 6.9 27.295.1 0.04.9 94.2 0.0 5.8 8.35 2.19 BM-31 91.8 3.1 5.1 82.9 3.1 14.095.7 0.83.6 79.3 0.0 20.7 11.24 1.10 BM-32 83.2 3.8 13.0 77.9 3.8 18.395.9 0.04.1 53.8 0.0 46.2 4.95 0.32 BM-33 82.9 13.1 4.1 81.0 13.1 5.9 90.6 0.68.8 56.3 0.0 43.8 4.83 0.11 BM-34 76.0 20.6 3.4 70.8 20.6 8.6 93.0 0.07.0 89.5 0.0 10.5 3.17 0.22 BM-35 83.2 11.2 5.6 59.3 11.2 29.593.4 0.06.6 90.1 0.0 9.9 4.96 1.42  R. N. HOTA ET AL. Copyright © 2011 SciRes. IJG 131 (a) (b) (c) Figure 3. QFR ternary diagram of Dott’s sandstone classi- fication. (a) Karharbari formation (b) Barakar formation (c) Barren measures formation. Symbols Q, F and R are as per Table 3. monocrystalline undulatory quartz and accessory miner- als show steady decreasing and increasing trends respec- tively in upward progression (Figure 4). 5. Provenance 5.1. Lithology Palaeocurrent analyses [22-23] have indicated west- northwesterly to northwesterly palaeoflow during Da- muda sedimentation suggesting that the sediments were derived from southeasterly source areas occupied by the Eastern Ghats Supergroup of rocks of Precambrian age (Figure 1(b)). The Eastern Ghats Supergroup lying to the south of the Talchir basin is composed of metamor- phic rocks like khondalite, charnockite, leptynite, qua- rtzite, acid-gneiss, pyroxene granulite and mica schist intruded by granitic plutons, pegmatite veins and basic igneous rocks. Plotting of different quartz types of the Damuda sandstones in provenance discrimination dia- gram of Basu et al. (Figure 5) [27] confirms the above statement suggesting that the middle to upper rank meta- morphic rocks dominantly contributed sediments to the Talchir Gondwana basin during Damuda sedimentation. Granitic plutons, pegmatite veins, basic igneous rocks and mica schist account for a few plots of quartz types in plutonic and low rank metamorphic fields (Figure 5). Presence of khondalite and qu artzite pebbles within con- glomerate beds of the Karharbari and the Barakar forma- tions further supports this view. 5.2. Climate The Early Lower Permian Talchir sediments were depo- sited in cold climatic condition [30]. With advancement of time, the climate gradually changed over from cold to humid and finally to arid during deposition of the Kamthi Formation. Plot of quartz: (feldspar + rock fragments) of Damuda sandstones in the climate discrimination dia- gram of Suttner and Dutta [6] suggest the prevalence of humid climatic condition during Karharbari and Barakar sedimentation (Figures 6(a)-(b)), which is supported by the presence of coal seams within these formations. The gradual change of climate from humid to arid must have passed through semi-humid and semi-arid phases. The semi-humid climatic condition is indicated by some plots of quartz: (feldspar + rock fragments) of Barren Meas- ures sandstones (Figure 6(c)). Presence of coaly streaks in lower part of the Barren Measures Formation and steady increase of iron oxide minerals in upward pro- gression (Figure 4) adequately substantiate the ch ange of climate during Damuda sedimentation. The semi-arid climate of Middle Permian is possibly not represented in Figure 6 due to inadequate sa mpling of sandstones fr om the upper part of the Barren Measures Formation lying to the north of the study area (Figure 2). Release of frame- work grains and their preservation within Damuda sand- stones also supports the climate change during Lower to Middle Permian period. Generally, warm and humid Figure 4. Vertical variation of lithologic parameters of Damuda sandstones.  R. N. HOTA ET AL. Copyright © 2011 SciRes. IJG 132 Figure 5. Plot of Damuda sandstones in diamond diagram of Basu et al. (1975). climatic condition favours chemical weathering as a re- sult of which the feldspars undergo chemical change and are eliminated. The feldspar contents of the Karharbari, Barakar and Barren Measures sandstones are 4.15%, 4.09% and 8.07% respectively (Table 2). Relatively lesser amount of feldspars in Karharbari and Barakar sandstones suggest deep chemical weathering in the source area that led to elimination of the feldspars to large extent. However, during Barren Measures sedi- mentation the climate gradually warmed up as a result of which the chemical weathering could not become vigor- ous and many of the feldspars escaped chemical wea- thering that accounts for relatively higher proportion of feldspars in Barren Measures sandstones. 5.3. Tectonic Setting The recalculated petrographic data were plotted in the ternary diagrams of Dickinson and others [1-4] to unra- vel the tectonic setting of provenance during Damuda sedimentation. The Qt-F-L diagram emphasizes factors controlled by provenance, relief, weathering and trans- port mechanism. In this diagram, many of the Karharbari samples fall in the craton interior and a few samples plot in the recycled orogen province (Figure 7(a)). In con- trast, most of the Barakar and Barren Measures samples plot in the recycled orogen province (Figures 7(b)-(c)). Global sandstone petrographic classifications suggest that the petrofacies which plot within recycled orogen provenance field are commonly derived from sedimen- tary and metasedimentary sources, which were originally deposited in passive continental margins [1,4]. In the (a) (b) (c) Figure 6. Bivariate log – log plot of Qt/(F + R) and Qp/(F + R) ratios of Damuda sandstones in climate discrimination diagram of Suttner and Dutta (1986). (a) Karharbari formation (b) Barakar formation (c) Barren measures formation. Symbols Qt, Qp, F and R are as per Table 3.  R. N. HOTA ET AL. Copyright © 2011 SciRes. IJG 133 (a) (b) (c) Figure 7. Plot of Damuda sa ndstones in ternary provenance discrimination diagram of Dickinson et al. (1983). (a) Kar- harbari formation (b) Barakar formation (c) Barren mea- sures formation. Symbols Qt, F and L are as per Table 3. Qm-F-Lt diagram, the Karharbari samples fall both in the craton interior and quartzose recycled fields (Figure 8(a)) almost in equal proportion. However, most of the Bara- kar and Barren Measures samples plot in the quartzose recycled province with a few in the transitional recycled field (Figures 8(b), (c)). The Qm-P-K plot (Figure 9) of the data shows that all the Damuda sediments were con- tributed from continental block province. The Qp-Lv-Ls diagram, which is based on rock fragment population from a polygenetic source, gives a more deterministic picture about the tectonic elements. In this plot, most of the Karharbari and Barren Measures samples plot in the mixed orogenic sands field (Figure 10 (a), (c)) while the Barakar samples are concentrated in the collision suture and fold-thrust belt source (Figure 10(b)). The study suggests that the Damuda sands were mostly derived from craton interior of the continental block as well as quartzose and transitional recycled orogen sources. Though the quartzose sands are mainly produced by multicyclic reworking of cratons, the first cycle sedi- ments derived from low relief granitic and gneissic be- drocks under deep and prolonged weathering condition contain substantial amount of quartzose sands [4]. It is to be noted that the Eastern Ghats Supergroup, which has mainly contributed sands to the Talchir Gondwana basin is dominantly composed of highly me- tamorphosed gneisses, khondalites and charnockites. Khondalites are dry metamorphic produ cts of arenaceous and argillaceous sediments. On the other hand, the char- nockites of acid and basic composition are either igneous or metamorphic products of sediments rich in Fe, Mg and Ca. Two types of charnockites have been recognized in the Eastern Ghats Supergroup. The granulitic type is considered to has been formed by high grade metamor- phism of sediments where as the gran itic typ e is regarded as a palingenetic product of khondalites under plutonic conditions of metamorph ism. According to some authors [31], the Eastern Ghats Mobile Belt (EGMB) crosscut- ting the trend lines of Dharwar, Bastar and Singhbhum cratons is a classic example of Proterozoic continental collision. The mobile belt comprising of Western Khon- dalite Zone (WKZ), Eastern Khondalite Zone (EKZ) and the median Central Migmatite Zone (CMZ) toge ther with its cratonic basement of Western Charnockite Zone (WCZ) and marginal zone has been thrust towards west due to compression from the Enderby Land of East An- tarctica [32]. Rifting commenced from 1400 – 1250 Ma with emplacement of alkaline complexes that were de- formed into nepheline gneisses. The rifting episode was followed by deposition of quartz pebble conglomerate (QPC) in the continental margin and greywacke-pellite suit in deeper parts. Deformation, metamorphism and granitic magmatism culminated in Eastern Ghats oroge- ny between 950 - 1100 Ma. This phase was followed by emplacement of anorthosite plutons and garnetiferous (a) (b) (c) Figure 8. Plot of Damuda sandstones in ternary provenance discrimination diagram of Dickinson et al. (1983). (a) Karharbari formation (b) Barakar formation (c) Barren measures formation. Symbols Qm, F and Lt are as per Table 3.  R. N. HOTA ET AL. Copyright © 2011 SciRes. IJG 134 (a) (b) (c) Figure 9. Plot of Damuda sa ndstones in ternary provenance discrimination diagram of Dickinson (1985). (a) Karharbari formation (b) Barakar formation (c) Barren measures for- mation. Symbols Qm, P and K are as per Table 3. (a) (b) (c) Figure 10. Plot of Damuda sandstones in ternary prove- nance discrimination diagram of Dickinson (1985). (a) Karharbari formation (b) Barakar formation (c) Barren measures formation. Symbols Qp, Lv and Ls are as per Ta- ble 3. granite at 800 - 900 Ma that lead to crustal stabilization in Neoproterozo ic [33]. The study substantially confirms the inferences derived from palaeocurrent analysis and heavy mi n er al studies [22,24,34 ]. 6. Statistical Analyses 6.1. Equality of Provenance Lithology Equality of provenance lithology at the formation level during Damuda sedimentation was tested employing the multivariate statistical technique of equality of sample means. Modal analysis data of dominant framework grains like quartz (monocrystalline and polycrystalline), feldspar (potash and plagioclase) and rock fragments (metamorphic and sedimentary) were taken into consid- eration for this analysis. The corrected sum of squares and cross product matrices of the above parameters of all the three formations were computed and pooled variance and covariance matrices of pairs of formations were de- termined. Since the overall provenance lithology of all the three formations of the Damuda Group is broadly same we assumed that these were drawn from multiva- riate normal populations having the same unknown va- riance and covariance matrix. We established the null hypothesis (H0) as the mean vector of the parent popula- tion of one formation is same as the mean vector of the parent population from which the samples of second formation were drawn. The computed and approximate critical values of “F” are presented in Table 5. In all the three cases, the computed values of “F” are more than the critical values, which lead to the rejection of the null hypothesis. The analyses suggest that mean values of the lithological parameters (monocrystalline and polycrystal- line quartz, potash and plagioclase feldspars and meta- morphic and sedimentary rock fragments) of the Kar- harbari, Barakar and Barren Measures formations are different and varied in concomitant with Damuda sedi- mentation. The mean paleocurrent directions of the Kar- harbari, Barakar and Barren Measures formations are west-northwest (298˚ ± 6˚), northwest (319˚ ± 4˚) and west-northwest (292˚ ± 8˚) respectively [23] (Figure 2). The differences between mean palaeocurrent vectors of pairs of formations are statistically significant [23]. In other words, changes of location of the source area, cli- mate and gradual denudation lead to exposure of diverse rock types, which liberated different amounts of quartz, feldspar and rock fragments to the Talchir Gondwana basin during Damuda sedimentation. 6.2. Discrimination Analysis Linear discriminant functions were established between pairs of formations of the Damuda Group and to ascer- tain the results of equality of sample means. The linear discriminant functions (LDFs) along with the F-test re- sults are presented in Table 6. The discriminant indices, Table 5. F-test results of formation pairs of the Damuda group of the Talchir Gondwana basin. Formation pairs Calculated value of “F” Critical value of “F” Karharbari and Barakar 88.14 4.34 (6,63)* Barakar and Barren Measures 69.90 4.26 (6,73)* Karharbari and Barren Measures 15.45 4.47 (6,53)* *Degrees of freedom of are given in the brackets. Significance levels are 0.001 in each case.  R. N. HOTA ET AL. Copyright © 2011 SciRes. IJG 135 multivariate group means and projection of raw discri- minant scores of the formation pairs are shown in Figure 11. In all the three cases, the computed values of “F” are greater than the critical values at 0.001 significance level, which suggest statistical significance of the discriminant functions. In case of Karharbari – Barakar formation pair, the discriminant index is 12.77. Discriminant scores greater and lesser than this value represent Karharbari and Barakar sandstones respectively (Figure 11(a)). The zero value of misclassification ratio (Table 6) suggests that the lithological parameters of these two formations are strikingly different. It is to be noted that a remarkable Boulder Gravel Unit of 40 - 60 m thickness separates these two formations during the deposition of which the source area was appreciably upraised with exposure of different rock types during pre- and post-tectonic sedi- mentation phases. Changes in provenance position from south-southeast to southeast and resulting lithological differences are responsible for the dissimilarity of framework grains of Karharbari and Barakar sandstones. In case of Barakar – Barren Measures formation pairs the discriminant index is 13.36 (Table 6). Discriminant scores lesser and greater than this value represent Bara- kar and Barren Measures sandstones respectively. Statis- tically significant difference in framework grains of these two formations may be attributed to changes in the loca- tion of the source area [23] and prevailing climatic con- dition as a result of which different suits of minerals with variable weathering states were contributed to the depo- sitional basin. Misclassification ratio of 17.50% as indi- Table 6. Discriminant function, discriminant index, multivariate group means, F-test results and misclassification ratio of formation pairs of the Damuda group of the Talchir Gondwana basin. Formation pairs Discriminant function, discriminant index and multivariate group meansCalculated value of “F”Critical value of “F” Misclassification ratio (in percent) Karharbari and Barakar DK-B = 0.204Qm + 0.107Qp +0.107K + 0.129P + 0.120Rm + 0.113Rs R0 = 12.77, RK = 14.57, RB = 10.96 88.10 4.34 (6,63)* 00.00 Barakar and Barren Measures DB-BM = 0.195Qm + 0.187Qp + 0.175K + 0.175P + 0.253Rm + 0.206Rs R0 = 13.36, RB = 12.94, RBM = 14.22 63.67 4.26 (6,73)* 17. 50 Karharbari and Barren Measures DK-BM = 0.489Qm + 0.399Qp + 0.416K+ 0.391P + 0.393Rm + 0.393Rs R0 = 35.19, RK = 37.01, RBM = 33.36 13.80 4.47 (6,53)* 28.33 Explanation of symbols: DK-B – Discriminant function between Karharbari and Barakar formations, DB-BM – Discriminant function between Barakar and Barren Measures fo rmations, DK- BM – Discriminant function between Karharbari and Barren Measures formations, R0 – Discriminant index, RK, RB and RBM are group means of Kar harbari , Barakar and Barr en Measu res fo rmations r espectiv ely, * - Deg rees of f reedom o f “F”. In al l the three cas es sig nifican ce levels ar e 0.00 1. Symbols Qm, Qp, K, P, Rm and Rs are as per Table 3. Figure 11. Projection of Damuda sandstones of the Talchir Gondwana basin onto the discriminant function line. (a) Karhar- bari and Barakar formations (b) Barakar and Barren measures formations (c) Karharbari and Barren measures formations; RK, RB and RBM are the projections of the multivariate means of Karharbari, Barakar and Barren measures sandstones re- spectively. R0 is the discriminant index. Symbols as in Figure 5.  R. N. HOTA ET AL. Copyright © 2011 SciRes. IJG 136 cated by overlapping of seven samples from each cate- gory (Table 6 and Figure 11(b)) may be due to gradual change over of sedimentation as Barakar and Barren Measures are two contiguous formations of the Talchir Gondwana basin without any major break in sedimenta- tion. In case of Karharbari – Barren Measures formation pairs the discriminant index is 35.19 (Figure 11(c)). Discriminant scores greater and lesser than this value represent Karharbari and Barren Measures sandstones respectively (Table 6). Since the location of the proven- ances of these two formations with respect to the de- positional basin is same (west-northwest), the framework lithology should have been identical. High value (28 .33 %) of misclassification ratio may be attributed to this factor. However, statistically significant difference of the fra- mework grains as revealed by inequality of sample mean s and linear discriminant function can be accredited to considerable time gap in sedimentation, climatic change and deep weathering that led to exposure of diverse rock types in the source area. 7. Conclusions Following conclusions have been drawn in the present work: 1) The Karharbari, Barakar and Barren Measures sandstones of the Damuda Group of the Talchir Gond- wana basin are composed of different amounts of quartz, feldspar and rock fragments. They are mostly arkosic- and feldspathic-wackes with subordinate amount of quar- tz-wacke. 2) The Eastern Ghats Supergroup composed of khon- dalite, charnockite, leptyn ite, quartzite, acid-gneiss, mica schist, pyroxene granulite, granite, pegmatite and basic igneous rocks contributed sediments to the Talchir Gond- wana basin. 3) The Damuda sedimentation was initiated in humid tropical climate with deposition of the coal-bearing Kar- harbari and Barakar formations. With advancement of time, the climate gradually changed over to semi-humid and semi-arid during Barren Measures sedimentation. 4) The tectonic settings of the provenance of the Da- muda sandstones are craton interior, continental block and recycled orogen provinces. 5) Statistical analyses suggest that th e d etrital gr ains of the Karharbari, Barakar and Barren Measures formations changed appreciably with advancement of Damuda se- dimentation, which may be due to changes in the loca- tion of the provenance, climatic condition and gradual denudation that lead to exposure of different rocks in the source area. 8. Acknowledgements The authors are thankful to the Director of Geology, Govt. of Orissa for providing the borehole samples, to Prof. K. L. Pandya for discussion and to the anonymous reviewer for constructive suggestions. 9. References [1] W. R. Dickinson and C. A. Suczek, “Plate Tectonics and Sandstone Composition,” The American Association of Petroleum Geologists Bulletin, Vol. 63, No. 12, 1979, pp. 2164-2182. [2] R. V. Ingersoll and C. A. Suczek, “Petrology and Prove- nance of Neogene Sand from Nicober and Bengal Fans, DSDP Sites 211 and 218,” Journal of Sedimentary Pe- trology, Vol.49, No. 4, 1979, pp. 1217-1228. [3] W. R. Dickinson, S. L. Beard, J. L. Erjavec, R. C. Fer- gussusson, K. F. Inman, R. A. Knepp, F. A. Linberg and P. T. Ryberg, “Provenance of North American Phanero- zoic Sandstones in Relation to Tectonic Setting,” Geo- logical Society of America Bulletin, Vol. 94, No. 2, 1983, pp. 222-235. doi:10.1130/0016-7606(1983)94<222:PONAPS>2.0.CO; 2 [4] W. R. Dickinson, “Interpreting Provenance Relations from Detrital Modes of Sandstones,” In: G. C. Zuffa, Ed., Provenance of Arenites, D. Reidel Publishing Company, Dordrecht, 1985, pp. 333-361. [5] A. Basu, “Petrology of Holocene Fluvial Sand Derived from Plutonic Source Rocks: Implications to Palaeocli- matic Interpretation,” Journal of Sedimentary Petrology, Vol. 46, No. 3, 1976, pp. 694-709. [6] L. J. Suttner and P. K. Dutta, “Alluvial Sandstone Com- position and Palaeoclimate, I. Framework Mineralogy,” Journal of Sedimentary Petrology, Vol. 56, No. 3, 1986, pp. 329-345. [7] L. E. Savoy, R. K. Stevenson and E. W. Mountjoy, “Provenance of Upper Devonian – Lowet Carboniferous Miogeoclinal Strata, Southeastern Canadian Cordillera: Link between Tectonics and Sedimentation,” Journal of Sedimentary Research, Vol. 70, No. 1, 2000, pp. 181-193. doi:10.1306/2DC40909-0E47-11D7-8643000102C1865D [8] L. Shao, K. Stattegger and C.-D. Garbe-Schoenberg, “Sandstone Petrology and Geochemistry of the Turpan Basin (NW China): Implications for the Tectonic Evolu- tion of a Continental Basin,” Journal of Sedimentary Re- search, Vol. 71, No. 1, 2001, pp. 37-49. doi:10.1306/041800710037 [9] J. Preston, A. Hartley, M. Mange-Razetzky, M. Hole, G. May, S. Buck and L. Vaughan, “The Provenance of Tri- assic Continental Sandstones from the Beryl Field, Nor- thern North Sea: Mineralogical, Geochemical and Sedi- mentological Constraints,” Journal of Sedimentary Re- search, Vol. 72, No. 1, 2002, pp. 18-29. doi:10.1306/042201720018 [10] U. Zimmermann and H. Bahlburg, “Provenance Analysis  R. N. HOTA ET AL. Copyright © 2011 SciRes. IJG 137 and Tectonic Setting of the Ordovician Clastic Deposits in the Southern Puna Basin, NW Argentina,” Sedimen- tology, Vol. 50, No. 6, 2003, pp. 1079-1104. doi:10.1046/j.1365-3091.2003.00595.x [11] E. L. Pera and J. Arribas, “Sand Composition in an Ibe- rian Passive-Margin Fluvial Course: The Tajo River,” Sedimentary Geology, Vol. 171, No. 1-4. 2004, pp. 261- 281. doi:10.1016/j.sedgeo.2004.05.019 [12] Y. J. Joo, Y. I. Lee and Z. Bai, “Provenance of the Qing- shuijian Formation (Late Carboniferous), NE China: Im- plications for Tectonic Processes in the Northern Margin of the North China Block,” Sedimentary Geology, Vol. 177, No. 1-2, 2005, pp. 97-114. doi:10.1016/j.sedgeo.2005.02.003 [13] A. H. M. Ahmad and G. M. Bhat, “Petrofacies, Prove- nance and Diagenesis of the Dhosa Sandstone Member (Chari Formation) at Ler, Kutchchh Sub-Basin, Western India,” Journal of Asian Earth Sciences, Vol. 27, No. 6, 2006, pp. 857-872. doi:10.1016/j.jseaes.2005.08.005 [14] M. Bernet, D. Kapoutsos and K. Bassett, “Diagenesis and Provenance of Silurian Quartz Arenites in South-Eastern New York State,” Sedimentary Geology, Vol. 201, No. 1-2, 2007, pp. 43-55. doi:10.1016/j.sedgeo.2007.04.006 [15] S. R. Devi and M. E. A. Mondal, “Provenance and Tec- tonic Setting of Barail (Oligocene) and Surma (Miocene) Group of Surma-Barak Basi n, Manipur, India: Petrogr aph - ic Constraints,” Journal of the Geological Society of In- dia, Vol. 71, No. 4, 2008, pp. 459-467. [16] J. J. Veevers and R. C. Tewari, “Gondwana Master Basin of Peninsular India between Tethys and the Interior of the Gondwana Province of Pangea,” Geological Society of America, Boulder, 1995, p. 72. [17] A. D. Miall, “An Introduction to Rift Basins and Their Sediments,” Sedimentary Geology, Vol. 147, No. 1-2, 2002, pp. 3-8. doi:10.1016/S0037-0738(01)00183-X [18] S. K. Chakrabarti and R. K. Chakrabarti, “Nature of the Precambrian Crustal Assembly and Evolution of the Go- davari Valley Gondwana Basins of Peninsular India,” Oxford & IBH Publishing Co. Pvt. Ltd., New Delhi, 1994, pp. 599-612. [19] R. N. Hota, W. Maejima and B. Mishra, “Similarity of Palaeocurrent Pattern of Lower Gondwana Formations of the Talchir and the Ong-River Basins of Orissa, India – An Indication of Dismemberment of a Major Gondwana Basin,” Gondwana Research, Vol. 10, No. 3-4, 2006, pp. 363-369. doi:10.1016/j.gr.2006.02.009 [20] R. N. Hota and W. Maejima, “Comparative Study of Cyclicity of Lithofacies in Lower Gondwana Formations of Talchir Basin, Orissa, India: A Statistical Analysis of Subsurface Logs,” Gondwana Research, Vol. 7, No. 2, 2004, pp. 353-362. doi:10.1016/S1342-937X(05)70789-9 [21] S. Goswami, M. Das and B. C. Guru, “Permian Biodiver- sity of Mahanadi Master Basin, Orissa, India and Their Environmental Countenance,” Acta Palaeobotanica, Vol. 46, No. 2, 2006, pp. 101-118. [22] R. N. Hota, W. Maejima and B. Mishra, “River Meta- morphosis during Damuda Sedimentation: A Case Study from Talchir Gondwana Basin, Orissa,” Journal of the Geological Society of India, Vol. 69, No. 6, pp. 1351- 1360. [23] R. N. Hota, “Palaeocurrent Pattern and Its Tectonic Im- plication during Talchir and Damuda Sedimentation in Talchir Gondwana Basin, Orissa,” Gondwana Geological Magazine, Vol. 22, No. 1, 2007, pp. 1-10. [24] R. Das and K. L. Pandya, “Palaeocurrent Pattern and Provenance of a Part of Gondwana Succession, Talchir Basin, Orissa,” Journal of the Geological Society of India, Vol. 50, No. 4, 1997, pp. 425-433. [25] K. L. Pandya, “Gondwanas,” In: N. K. Mahalik, H. K. Sahoo, R. N. Hota, B. P. Mishra, J. K. Nanda and A. B. Panigrahi, Eds., Geology and Mineral Resources of Orissa, Society of Geoscientists and Allied Technologists, Bhubaneswar, 2006, pp. 91-103. [26] C. S. Raja Rao, “Coal Resources of Tamilnadu, Andhra Pradesh, Orissa and Maharastra,” Bulletin of Geological Survey of India, Vol. 45, 1982, pp. 41-52. [27] A. Basu, S. W. Young, L. J. Suttner, W. C. James and G. H. Mack, “Reevaluation of the Use of Undulatory Extinc- tion and Polycrystallinity in Detrital Quartz for Prove- nance Interpretation,” Journal of Sedimentary Petrology, Vol. 45, No. 4, 1975, pp. 873-882. [28] R. H. Dott, “Wacke, Graywacky and Matrix – What Ap- proach to Immature Sandstone Classification?” Journal of Sedimentary Petrology, Vol. 34, No. 3, 1964, pp. 625- 632. [29] J. C. Davis, “Statistics and Data Analysis in Geology,” John Wiley and Sons, Hoboken, 2002, p. 639. [30] W. Maejima, R. Das, K. L. Pandya and M. Hayashi, “Deglacial Control on Sedimentation and Basin Evolu- tion of Permo-Carboniferous Talchir Formation, Talchir Gondwana Basin, Orissa, India,” Gondwana Research, Vol. 7, No. 2, 2004, pp. 339-352. doi:10.1016/S1342-937X(05)70788-7 [31] M. Ramakrishnan and R. Vaidyanadhan, “Geology of India,” Geological Society of India, Bangalore, 2008, p. 556. [32] T. K. Biswal, B. Biswal, S. Mitra and M. R. Moulik, “Deformation Pattern of the NW Terrane Boundary of the Eastern Ghats Mobile Belt, India: A Tectonic Model and Correlation with Antarctica,” Gondwana Research, Vol. 5, No. 1, 2002, pp. 45-52. doi:10.1016/S1342-937X(05)70887-X [33] M. Ramakrishnan, J. K. Nanda and P. F. Augustine, “Geological Evolution of the Proterozoic Eastern Ghats Mobile Belt,” Geological Survey of India Special Publi- cation, No. 44, 1998, pp. 1-21. [34] R. N. Hota and W. Maejima, “Heavy Minerals of the Barakar Formation, Talchir Gondwana Basin, Orissa,” Journal of Geological Society of India, Vol. 74, No. 3, 2009, pp. 375-384. doi:10.1007/s12594-009-0141-6 |