Journal of Signal and Information Processing, 20 11 , 2, 88 - 99
doi:10.4236/jsip.2011.22012 Published Online May 2011 (http://www.SciRP.org/journal/jsip)
Copyright © 2011 SciRes. JSIP
Improved Comb Filter Based Approach for
Effective Prediction of Protein Coding Regions in
DNA Sequences
Jayakishan Meher 1, Pramod K. Meher2, Gananath Dash3
1Department of Electronics & Telecommunication Engineering, SITE, Orissa, India; 2Department of Embedded Systems, Institute for
Infocomm Research, Singapore City, Singapore; 3Department of Physics, Sambalpur University, Orissa, India.
Email: jk_meher@yahoo.co.in, pkmeher@i2r.astar.edu.sg, gndash@ieee.org
Received March 29th, 2011; revised April 12th, 2011; accepted April 19th, 2011.
ABSTRACT
The prediction of protein coding regions in DNA sequences is an important problem in computational biology. It is ob-
served that nucleotides in the protein coding regions or exons of a DNA sequence show period-3 property. Hence iden-
tification of the period-3 regions helps in predicting the gene locations within the billions long DNA sequence of eu-
karyotic cells. The period-3 property exhibited in exons of eukaryotic gene sequences enables signal processing based
time-domain and frequency domain methods to predict these regions efficiently. Several approaches based on signal
processing tools have, therefore, been applied to this problem, to predict these regions effectively. This paper describes
novel and efficient comb filter-based techniques for the prediction of protein coding region based on the period-3 be-
havior of codon sequences. The proposed method is then validated on Burset/Guigo1996, HMR195 and KEGG stan-
dard datasets using various prediction measures. It is shown that cascaded differentiator comb (CDC) filter can be
used for prediction of protein coding region with better prediction efficiency, and involves less computational complex-
ity compared with the other signal processing techniques based on period-3 property.
Keywords: Cascaded Differentiator Comb (CDC), Generalized Comb Filter (GCF), Indicator Sequence, Period-3,
Signal Processing
1. Introduction
The genomic information is found to be embodied in the
strands of DNA as sequences of tri-nucleotide called
codons. A nucleotide is said to be of coding type if it
belongs to an exon or of non-coding type if it belongs to
an intron or intergenic space. In eukaryotes, the exons are
found to be separated by introns, where as in prokaryotes
they are placed continuously without any introns in be-
tween. Computational gene prediction is based on mainly
by two classes of methods such as sequence similarity
searches and gene structure and signal-based searches [1].
Exon detection must rely on the content sensors, which
refer to the patterns of codon usage that are unique to a
species, and allow coding sequences to be distinguished
from the surrounding non-coding sequences by statistical
detection algorithms. Many algorithms are applied for
modeling gene structure, such as dynamic programming,
linear discriminant analysis, Linguistic methods, Hidden
Markov model and neural network. Based on these mod-
els, a great number of gene prediction programs have
been developed [1]. Recently signal processing approach
has played a major role in gene prediction using period-3
property.
The protein coding regions of DNA sequences exhibit
a period-3 behavior which results specifically from the
existence of the codon sequences. Period-3 property is
the short range periodicity and is one of among many
types of periodicity in DNA sequence. Identification of
period-3 regions therefore helps in predicting the gene
locations; and allows the prediction of specific exons
within the genes of eukaryotic cells [1-3]. In order to
predict the location of protein coding region, a sliding
data frame (sliding window) with a small step size is
employed. This technique has been widely used to iden-
tify the coding region which can predict whether a given
sequence of frame, limited to a specific length N (called
Improved Comb Filter Based Approach for Effective Prediction of Protein Coding Regions in DNA Sequences 89
as window), belongs to a coding region or not. This is
done by moving the sequence frame in which the nucleo-
tides of length N of the window are rated at specific posi-
tion. The existence of three-base periodicity exhibited by
the genomic sequence as a sharp peak at frequency f =
1/3 in the power spectrum in the protein coding regions
helps in the prediction of exons. The genomic signal
processing involves conversion of DNA character-string
into numerical sequence called as the indicator sequence.
In addition to the Voss representation [4] which involves
binary representation, various DNA numerical signal
representations have been adopted using complex num-
bers [5], quaternion [6], EIIP [7,8], Gailos field assign-
ment [9], frequency of nucleotide occurrence [10],
z-curve [11,12], paired numeric [13] to make indicator
sequence in DSP methods to improve the sensitivity and
selectivity.
The existing DSP techniques for the identification of
protein coding regions of DNA sequences based on the
period-3 behavior differ in terms of computational com-
plexity and accuracy of prediction. Discrete Fourier
transform is used to detect period-3 property in DNA
sequences [14-17]. The DFT of length N for input indi-
cator sequence xB(n) is defined by
 
12π
0
e,0
NjknN
BB
n
Xk xnkN
 
1 (1)
for B = A, T, C and G. The absolute value of power of
DFT coefficients is given by
 
12
0
N
B
k
SkX k
(2)
The plot of S(k) against k, results in peak at k = N/3
due to the period-3 property, that indicates the presence
of coding regions.
The digital filtering techniques such as the antinotch
filter and multistage filter have been used to identify pe-
riod-3 property in DNA sequences [18,19]. In digital
filtering method for indicator sequence XB(n), corre-
sponding filter output YB(n) is computed where B = A, T,
C and G. The sum of the square of filter outputs is ex-
pressed as
 
12
0
N
B
n
YnY n
(3)
A plot of Y(n) has been used to extract the period-3 re-
gion of the DNA sequence effectively. Gene prediction
in eukaryotes based on the DFT by spectral rotation
measure is presented by Koltar and Lavner [20]. Short
time Fourier transform (STFT) has also been used as a
predictor for coding region for improving computational
load. Entropy based methods with this predictor is used
to increase its efficacy to identify the homogeneous re-
gions. It has been used to identify the borders between
coding and noncoding regions in DNA sequence based
on the entropy measures with a 12-symbol alphabet [21].
The 3-periodicity is explained in more detail by Tuqan
and Rushdi [22] as related to the codon bias using two
stage digital filter and multirate DSP model. Modified
Gabor-Wavelet transform is used by Jesus et al. [23] for
the identification of protein coding regions having ad-
vantage of being independent of the window length. The
spectrum for DNA sequences is discussed based on an
entropy minimization criterion by Galleani and Garello
[24]. Criteria to select the numerical values to represent
genomic sequences are discussed by Akhtar et al. [25]
and in addition a technique for recognition of acceptor
splice sites is discussed.
The exon identification task carried out by existing
methods has its own limitations as it is observed that
period-3 property is not exhibited in some coding regions.
Sometimes they do exhibit, but the signal is rather weak
and difficult to differentiate from noise. Again false ex-
ons are identified and very short exons are missed which
are traditional problems in gene prediction history. Due
to this gene prediction problem still remains a challeng-
ing task in terms of better accuracy, sensitivity and selec-
tivity using existing tools. In such situations shortcom-
ings of the previous approaches motivate to develop new
approaches to have improved accuracy and less compu-
tational complexity.
In this paper, two new signal processing tools namely
the generalized comb filter (GCF), and cascaded differ-
entiator comb (CDC) filter, are presented that effectively
use the period-3 property in a genomic sequence for the
prediction of protein coding regions. The GCF-based
method has lower computational complexity and pro-
vides better identification of coding regions over existing
DSP methods. The CDC-based approach is an extension
of GCF that exploits period-3 behavior more effectively
and reduces the computational complexities further. In
order to validate the results of the proposed predictor,
prediction measures such as discriminating factor, sensi-
tivity, specificity, miss rate and wrong rate are evaluated
with HMR195, Burset and Guigo and KEGG standard
data sets.
The rest of the paper is organized as follows. Section-2
presents the proposed computationally efficient comb
filter-based approach with GCF and CDC filter for the
identification of protein coding regions. Section-3 pre-
sents the comparison of performances in terms of predic-
tion measures and computational complexities of various
signal processing methods and Section-4 presents the
conclusions of this paper.
Copyright © 2011 SciRes. JSIP
Improved Comb Filter Based Approach for Effective Prediction of Protein Coding Regions in DNA Sequences
90
2. Proposed Comb Filter Based Approach
2.1. Design of a Comb Filter for Identifying
Protein Coding Regions
A comb filter has a frequency response that is periodic
function of
with a period 2/L, where L is a positive
integer. Amplitude response of comb filter is comprised
of a series of regularly spaced spikes of interleaved
passbands and stopbands which looks like a hair comb. A
comb filter can also be viewed as a notch filter in which
the notches or the nulls occur periodically across the
frequency band [26,27]. A comb filter can, thus, be gen-
erated from a filter G(z) with single passband and/or a
single stopband by replacing each delay in its realization
with L delays, resulting in a structure with a transfer
function given by

L
H
zGz (4)
such that if the amplitude response

j
He
exhibits a
peak at
p = /2, then the amplitude response of

j
Ge
exhibits L peaks at k/2L, for 1 k L.
A simplest form of comb filter can be realized by add-
ing a delayed version of a signal to itself or the current
filter output to cause constructive and destructive inter-
ferences. Comb filters can accordingly be realized in two
different forms, e.g., feed-forward form and feedback
form. The feed-forward form implements a finite impulse
response (FIR) filter while the feedback form implements
an infinite impulse response (IIR) filter. The difference
equation of a comb filter can be written in a general
form:
 
011
ynbxnbxn nayn n


2
(5)
where b1 and a, respectively, denote the feed-forward and
feedback gain coefficients, n1 and n2 are fixed delays, x(n)
denotes the nth sample of the input signal, y(n) is the
output at time instant n. Equation (5) refers to an FIR
filter when the feedback coefficient a = 0. Taking the
z-transform of both sides of (5) we can get the transfer
function of comb filter to be
 
12
01
nn
YzbXzbz Xzaz Yz

 (6)
where X(z) and Y(z) are the z-transform of the input and
the output signals, respectively. The transfer function of
a general comb filter can thus be obtained to be
 

1
21
2
0
n
nn
n
zb
HzYzXzb zza



(7)
where b = b1/b0. The transfer function of feed-forward
and feedback type comb filter as shown in (8) and (9) is
derived by substituting b = 0 and a = 0 in (7), respec-
tively where n1 = n2 = L.

0
L
fL
zb
Hz bz


(8)

0
L
bL
z
Hz bza


(9)
From (8) we can find that the numerator equals to zero
whenever zL = b, which is satisfied at L equally spaced
points around a circle in the complex z-plane, which
form the zeros of the transfer function. Since the de-
nominator is zero at zL = 0, L poles would exist at z = 0.
Similarly, from (9) we can find that the numerator equals
to zero at zL = 0, which gives L zeros at z = 0. The de-
nominator of (9) equals to zero when zL = a, which re-
sults in L equally spaced poles of the transfer function
around a circle in the complex z-plane. The signal
flow-graph for a comb filter defined by the difference
equation of (5) and the pole-zero plot of feed forward
and feedback form comb filter are shown in Figure 1.
and Figure 2 respectively. From (8) and (9), we can find
the amplitude responses of the feedforward and the
feedback comb filters, respectively as



2
012cos
f
H
bbb

 L (10)



2
012cos
b
H
baaL
 (11)
It can be observed from (10) and (11), that the amplitude
Figure 1. The signal flow graph for a comb filter defined by
the difference equation of (5).
(a) (b)
Figure 2. The pole-zero plots of feedforward and feedback
comb filters defined by the transfer functions of (8) and (9)
for L = 4. (a) For feedforward comb filter. (b) For feedback
comb filter.
Copyright © 2011 SciRes. JSIP
Improved Comb Filter Based Approach for Effective Prediction of Protein Coding Regions in DNA Sequences 91
response of both feedforward and feedback filters vary
periodically with frequency with a period of 2/L. The
behaviour of amplitude responses of both these classes of
comb filters are shown in Figure 3 for different values of
coefficients a and b. As shown in Figure 3(a) the mag-
nitude response of feedforward filter periodically drops
to a local minimum b0(1 – b) and goes up to a local
maximum b0(1 + b) resulting in a series of interleaved
notches and peaks symmetrically across the line |H(
)| =
b0. For b = 1 the local minimum goes to zero and be-
comes closer to b0 for decreasing values of b. The mag-
nitude response of feedback comb filter is shown in Fig-
ure 3(b). In this case the response value periodically
drops to a local minimum b0/(1 + a) and goes up to a
local maximum b0/(1 – a) resulting in a series of peaks.
Unlike the feedforward case the curves are not symmet-
rical about the line |H(
)| = b0; and the filter unstable
near a = 1.
A generalized comb filter (GCF) with both feedfor-
ward and feedback coefficients can effectively recognize
protein coding region with pole radius r = 0.992 (close to
unity) and L = 3 having Numerator coefficients = [1 0 –rL]
and Denominator coefficients = [1 0 0 –rL]. The fre-
quency response plot in Figure 4(a) shows a sharp peak
at ω= 2π/3 which exhibit period-3 property.
2.2. Design of an Improved Comb Filter for
Prediction of Protein Coding Regions
The CDC filter consists of equal number of stages of
differentiators and comb filters in cascade. Hence we
have referred to it is as cascaded differentiator-comb
filter. It requires no multiplication and it can be designed
with only adders, hence it can be preferred as a computa-
tionally efficient predictor for protein coding region.
Since the CDC filter is followed by a down sampler for
data rate down conversion, and can be called as CDC
decimator filter.
2.2.1. Single-Sta ge CDC Decimat or
The basic unit of a CDC decimator filter consists of a
single stage of differentiator and a comb filter followed
by a resampling switch as shown in Figure 5. The dif-
ferentiator section operates at the high sampling rate f
and it is implemented as a one-zero filter with a unity
feedforward coefficient. The difference equation and the
corresponding transfer function, HD(z) for this section
can be expressed in the form:
 
1ynxnxn (12)
 
1
YzXz zXz
 (13)

1
1
D
H
z
z (14)
The comb section operates at the low sampling rate
(a)
(b)
Figure 3. Magnitude response of comb filter (a) Feedfor-
ward (b) Feedback comb filter.
(a) (b)
Figure 4. Characteristics of generalized comb filter. (a)
Frequency response , (b) P ole-ze r o plot.
Figure 5. Single stage CDC Decimator.
Copyright © 2011 SciRes. JSIP
Improved Comb Filter Based Approach for Effective Prediction of Protein Coding Regions in DNA Sequences
Copyright © 2011 SciRes. JSIP
92
fs/R where R is the integer rate change factor. This sec-
tion consists of IIR comb stage with a delay of M sam-
ples per stage with unity feedback coefficient. The dif-
ferential delay is a filter design parameter used to control
the filter’s frequency response. The delay M = 3 in the
comb section is defined to exhibit period-3 property.
respectively. The frequency response plot shows a sharp
peak at period-3 region. This property is employed for
prediction of protein coding region.
2.2.3. N- Stage CDC Fil ter
A CDC decimator can in general be designed with N
cascaded differentiator stages clocked at fs, followed by
N cascaded IIR comb stages running at fs/R. Figure 7
shows three-stage CDC filter that consists of three num-
bers of differentiators and comb filters. Similarly block
diagram of N-stage CDC Decimator Filter consisting of
N equal number of differentiators and IIR comb filter
sections and the respective transfer functions are shown
in Figures 8 and 9 respectively. The overall function of
CDC filter with N cascaded stages, (Figure 9) is given
by
The difference equation and the corresponding transfer
function, HC(z) for a single comb stage with a sample
rate R are given by
 
y
nxnynRM (15)
 
RM
YzXz zYz
 (16)

1
1
c
R
M
Hz z
(17)
The decimator subsamples the output of the last stage,
reducing the sample rate from fs to fs/R. The system
transfer function for the composite CDC filter is given by
 
1
1
1
N
NN
DC RM
z
HzHHzz



(21)
 
1
1
1
DC
R
M
z
HzHzH zz

(18) where N is the number of differentiator-comb filter pairs.
From (21), we observe that the CDC filter is equivalent
to a cascade of N uniform filter stages with unit coeffi-
cients. As part of the filter design process; R, M, and N
are chosen suitably to provide period-3 characteristic. For
M = 3 and N = 1, the CDC exhibits period-3 behavior.
2.2.2. Frequency Response of CDC Filter
The frequency response is obtained by evaluating Equa-
tion (18) at
2π
e
j
f
R
z (19)
where f is the frequency relative to the sampling rate fs/R.
Evaluating Equation (18) in the z-plane at the sample
points defined by Equation (19), gives the magnitude
frequency response as
 
π
sin
sin π
f
R
Hf
M
f


(20)
(a) (b)
The frequency response plot and pole-zero plot of sin-
gle stage CDC filter are shown in Figures 6(a) and 6(b)
Figure 6. (a) Frequecy response (b) Pole-Zero plots of CDC
filter.
Figure 7. Block diagram of three stage CDC filter consisting of three equal number of differ-
entiators and IIR comb filter stages followed by decimator.
Figure 8. Block Diagram of N-stage CDC decimator filter consisting of N equal number of
differentiators and IIR comb filter sections.
Improved Comb Filter Based Approach for Effective Prediction of Protein Coding Regions in DNA Sequences 93

1
() 1N
N
D
Hz z
 1
() 1
N
N
CRM
Hz z



Figure 9. Block diagram of overall transfer function of N-stage differentiators and IIR comb
filter sections.
The frequency response plot shows high peak at period-3
region. Thus single-stage CDC filter is sufficient for pre-
diction of exons. With more number of stages, i.e, N = 2
or 3, the magnitude increases considerably and even ex-
ons having short sequences can be detected.
3. Performance and Complexity Comparison
The genomic sequences of several genes of different or-
ganisms were taken for the prediction of protein coding
region using the proposed GCF and CDC filter and the
existing signal processing techniques such as DFT, anti-
notch filter with frame size of 351 nucleotides. The sin-
gle indicator sequence using paired numeric properties of
nucleotides is used as numerical representation [13].
Mainly, three data sets are used as bench mark for this
purpose such as the dataset prepared by Burset and Gui-
go [28], HMR195 prepared by Sanja Rogic [29] and
KEGG gene sequence database prepared by M. Kanehisa
and S. Goto [30]. In a good number of cases all the pro-
posed methods performed well. The performance analy-
sis of various methods can be made by prediction meas-
ures such as exon-intron discrimination factor D [10],
sensitivity (SN), specificity (SP), miss rate (MR) and
wrong rate (WR) [1,25] which are defined as follows:
Lowest of exon peaks
Highest peak in noncoding regions
D (22)
P
P
P
P
T
STF
(23)
P
N
P
N
T
STF
(24)
R
M
E
M
A
E
(25)
R
WE
WPE
(26)
where ME = missing exons, AE = actural exons, WE =
wrong exons, PE = predicted exons, TP = true positive,
FP = false positive and FN = false negative [31]. TP cor-
responds to those genes that are correctly predicted by
the algorithm and also exist in the GenBank annotation.
FP corresponds to the coding regions identified by a giv-
en algorithm which are not present in the standard anno-
tation. FN is coding region that is present in the GenBank
annotation but not predicted to be coding by the algo-
rithm being used. Higher the value of D better is the dis-
crimination. If D is more than one (D > 1), all exons are
identified without ambiguity. High sensitivity and speci-
ficity are desirable for higher accuracy.
The list of genes under study of different datasets and
the performance analysis of various DSP approaches are
shown in respective Tables. Table 1 summarizes the si-
mulation results of nine genes from Burset and Guigo
dataset whereas Table 2 summarizes the observations of
six genes from KEGG dataset. Table 3 summarizes the
observations of nine genes from HMR195 dataset. In all
the examples cited the proposed encoding methods show
better discrimination compared to the exising methods.
The simulation result shows high discriminating factor,
sensitivity and specificity with low miss rate and wrong
rate for the proposed methods.
The proposed GCF and CDC filtering show high peak
at exon locations in compared to existing methods as
shown in figures. Figure 10 shows the exon prediction
results for gene F56F11.4a with accession no: AF099922
in the C. elegans chromosome-III. Figures 10(a)-(c)
show, respectively, the response of DFT, allpass-based
antinotch filter with pole radius r = 0.992 and the gener-
alized comb filter with both feedforward and feedback
coefficients having pole radius r = 0.992 respectively. The
five peaks corresponding to the exons can be seen at the
respective locations (1111, 16001929, 3186
3449, 45374716, 63296677). Figures 11(a)-(c)
show the response of basic CDC filter of one stage, two
stages and three stages CDC filter respectively. Figure
11 shows the response of CDC filter which has detected
all the exons effectively and also shows higher magni-
tudes as compared to other signal processing methods. It
is found that even one stage CDC filter produces com-
paratively higher magnitude than other methods at the
respective exon locations. Hence one stage CDC filter is
sufficient to act as efficient predictor which costs only
two adders. As the number of cascaded stage increases,
the magnitude of the frequency response plot also in-
creases considerably. Figure 12 shows exon prediction
result for gene PP32R1 with accession no: AF008216 of
Homo sapiens consisting of one exon using DFT, allpass
based antinotch filter and GCF methods. This indicates a
 
Copyright © 2011 SciRes. JSIP
Improved Comb Filter Based Approach for Effective Prediction of Protein Coding Regions in DNA Sequences
94
Table 1. Prediction measures of DSP tools using burset and guigo dataset.
Prediction Measures
Gene Name and Accession No DSP Methods
D SN S
P M
R W
R
DFT 7.5 1 0.5 0 0.5
Antinotch Filter 7 1 1 0 0
GCF 12 1 1 0 0
PP32R1, AF00A216, Homo Sapiens
CDC Filter 18 1 1 0 0
DFT 1 1 0.5 0 0.5
Antinotch Filter 1.5 1 0.66 0 0.5
GCF 2.2 1 1 0 0
ALOEGLOBIN L25370, Alouatta
belzebul epsilon-globin gene
CDC Filter 3.5 1 1 0 0
DFT 1.1 1 0.6 0 0.66
Antinotch Filter 1.2 1 0.75 0 0.33
GCF 1.25 1 0.75 0 0.33
Humbetgloa, 26462, human betaglobin
CDC Filter 1.5 1 0.75 0 0.33
DFT 1 1 0.6 0 0.66
Antinotch Filter 1.2 1 0.75 0 0.33
GCF 1.45 1 0.75 0 0
AGU04852 U04852 Ateles geoffroyi
haptoglobin (Hp) gene
CDC Filter 2.5 1 1 0 0
DFT 0.71 1 0.5 0 0.5
Antinotch Filter 2.5 1 1 0 0
GCF 2.91 1 1 0 0
Humelafin, D13156, Homo Sapiens
CDC Filter 3.2 1 1 0 0
DFT 1.1 1 0.66 0 0.5
Antinotch Filter 2.3 1 1 0 0
GCF 2.35 1 1 0 0
G101 U12024 Astyanax mexicanus
green opsin gene
CDC Filter 2.75 1 1 0 0
DFT 0.8 0.6 0.6 0.33 0.33
Antinotch Filter 0.8 0.6 0.6 0.33 0.33
GCF 1 1 1 0 0
HUMCBRG, M62420, carbonyl
reductase gene
CDC Filter 1 1 1 0 0
DFT 1.2 1 1 0 0.66
Antinotch Filter 1.2 1 1 0 0.66
GCF 1.5 1 1 0 0.33
BOVANPA M13145 Bovine atrial
natriuretic peptide
CDC Filter 2.5 1 1 0 0.33
DFT 0.8 0.5 0.5 0 0.5
Antinotch Filter 1.1 1 0.7 0 0.42
GCF 2.1 1 0.87 0 0.14
HSABLGR1 U07561 Human ABL gene
CDC Filter 2.5 1 1 0 0
Copyright © 2011 SciRes. JSIP
Improved Comb Filter Based Approach for Effective Prediction of Protein Coding Regions in DNA Sequences 95
Table 2. Prediction measures of DSP tools using KEGG dataset.
Prediction Measures
Gene Name and Accession No DSP Methods
D SP S
N M
R W
R
DFT 0.6 0.5 1 0 0.5
Antinotch Filter 0.5 0.5 1 0 0.5
GCF 1 0.5 1 0 0.33
NC_004843 Buchnera aphidicola
Ps plasmid pBPS1
CDC Filter 1.1 0.66 1 0 0.33
DFT 1.1 0.63 1 0 0.4
Antinotch Filter 1.2 0.63 1 0 0.4
GCF 1.2 0.7 1 0 0.33
NC_001911 Buchnera aphidicola
Dn plasmid pLeu-Dn
CDC Filter 1.5 0.7 1 0 0.28
DFT 1.2 0.6 1 0 0.33
Antinotch Filter 1.5 0.6 1 0 0.33
GCF 3 1 1 0 0
NC_002650 Treponema denticola U9b
plasmid pTS1
CDC Filter 3.5 1 1 0 0
DFT 1.15 0.6 1 0 0.5
Antinotch Filter 1.3 0.6 1 0 0.5
GCF 1.32 0.75 1 0 0.33
NC_007142 Campylobacter coli 338
plasmid p3384
CDC Filter 1.4 0.75 1 0 0.33
DFT 1.2 1 0.5 0.5 0
Antinotch Filter 1.2 0.5 1 0 0
GCF 1.2 0.5 1 0 0
NC_004767 Helicobacter pylori
plasmid pHP51
CDC Filter 1.3 1 1 0 0
DFT 0.8 0.33 1 0 0.66
Antinotch Filter 3 0.5 1 0 0.5
GCF 4.1 1 1 0 0
NC_010099 Burkholderia cepacia
plasmid PPC1
CDC Filter 6.5 1 1 0 0
sharp peak at its exon location (4453 5157). The
same gene has been injected to CDC filters of different
stages. The corresponding responses are shown in Figure
13.
The generalized comb filter and CDC filter sense the
exons effectively by showing high peak at gene locations
with lower computation. Table 4 summarizes the com-
parison of computational complexities of the proposed
comb filter based gene prediction method with existing
approaches. The generalized comb filter and the CDC
filter have lower computational complexity. Again these
methods detect all the exons at their respective locations.
CDC filter based technique is found to be more efficient
than other approaches for gene prediction in terms of
prediction efficiency as well as the computational com-
plexity.
4. Conclusions
The proposed novel comb filter-based approaches for the
prediction of protein coding regions of DNA sequences
using the period-3 property have better prediction effi-
ciency and lower computational complexity. The GCF as
well as the CDC filters are found to detect the exons with
considerably sharp peak at protein coding regions for
eukaryotic cell and can predict the specific exons with
high discriminating factor, sensitivity and specificity and
low miss rate and wrong rate. The CDC approach can
detect smaller exon regionshaving short sequences. It
Copyright © 2011 SciRes. JSIP
Improved Comb Filter Based Approach for Effective Prediction of Protein Coding Regions in DNA Sequences
96
Table 3. Prediction measures of DSP tools using HMR195 dataset.
Prediction Measures
Gene Name and Accession No DSP Methods
D SN S
P M
R W
R
DFT 1.1 1 0.66 0 0.5
Antinotch Filter 2.2 1 1 0 0.5
GCF 3.05 1 1 0 0
FABP3 U17081 Human fatty acid
binding protein
CDC Filter 3.25 1 1 0 0
DFT 1 1 0.66 0 0.5
Antinotch Filter 1 1 0.66 0 0.5
GCF 1.02 1 0.66 0 0.5
SIX3, AF092047, Homo Sapiens
Homeobox protein
CDC Filter 1.25 1 0.66 0 0.5
DFT 1.2 1 0.66 0 0.5
Antinotch Filter 2 1 1 0 0
GCF 2.25 1 1 0 0
Osteomodulin AB009589 Human gene
for Osteomodulin
CDC Filter 2.85 1 1 0 0
DFT 1 1 0.5 0 0.5
Antinotch Filter 1.2 1 0.5 0 0.5
GCF 2 1 0.5 0 0.5
KIP AB021866 Homo sapiens KIP gene
CDC Filter 2.25 1 0.5 0 0.5
DFT 1.8 1 0.66 0 0.5
Antinotch Filter 2 1 1 0 0
GCF 2 1 1 0 0
CLDN3, AF007189, Homo sapiens
Claudin 3
CDC Filter 2.25 1 1 0 0
DFT 0.8 0.5 0.5 0.5 0
Antinotch Filter 1.25 1 1 0 0
GCF 2 1
1 0 0
mafG, AB009693, Mus musculus gene
for mafG
CDC Filter 2.5 1 1 0 0
DFT 1 1 0.5 0 0.5
Antinotch Filter 1.2 1 0.5 0 0.5
GCF 1.2 1 0.5 0 0.5
GalR2, AF042784, Musculus galin
receptor type 2 gene
CDC Filter 1.25 1 0.5 0 0.5
DFT 1.5 1 1 0 0.5
Antinotch Filter 2.6 1 1 0 0
GCF 3.75 1 1 0 0
D p19, AFO61327, Homo sapiens
cyclin-dependent kinase4 inhibitor
CDC Filter 5.15 1 1 0 0
DFT 0.75 0.5 0.5 0 0.37
Antinotch Filter 1.5 1 0.72 0 0.37
GCF 2 1 0.88 0 0.12
AF064081 Mus musculus
alpha-sarcoglycan gene
CDC Filter 2.5 1 1 0 0
Copyright © 2011 SciRes. JSIP
Improved Comb Filter Based Approach for Effective Prediction of Protein Coding Regions in DNA Sequences 97
(a) (b) (c)
Figure 10. Gene F56F11.4a of C.Elegans chromosome III showing 5 exons by (a) DFT, (b) Antinotch filter, (c) Generalised
Comb Filter (GCF).
(a) (b) (c)
Figure 11. Gene F56F11.4a showing five exons by CDC filter with (a) Single stage (N = 1) (b) Two stages (N = 2) (c) Three
stages (N = 3).
(a) (b) (c)
Figure 12. Gene PP32R1 of Homo sapiens showing one Exon by (a) DFT, (b) Antinotch filter, (c) Generalised Comb Filter.
(a) (b) (c)
Figure 13. Gene PP32R1 of Homo sapiens showing one exon by CDC filter with (a) Single stage (N = 1) (b) Two stages (N = 2)
c) Three stages (N = 3). (
Copyright © 2011 SciRes. JSIP
Improved Comb Filter Based Approach for Effective Prediction of Protein Coding Regions in DNA Sequences
98
Table 4. Computational complexities of DSP methods for
prediction of protein coding region using period-3 property.
Prediction Technique Multiplications Additions
Using N-point DFT N2(C) N(N – 1)(C)
Using N-point FFT (N/2)log2N(C) Nlog2N(C)
Allpass Antinotch Filtering (2N + 1)(R) 2N(R)
Multistage Filtering 5(R) 2N(R)
Generalized Comb Filtering 3(R) 2 (R)
CDC Filtering NIL 2 (R)
‘C’ and ‘R’ refer to complex and real arithmetic operations respectively.
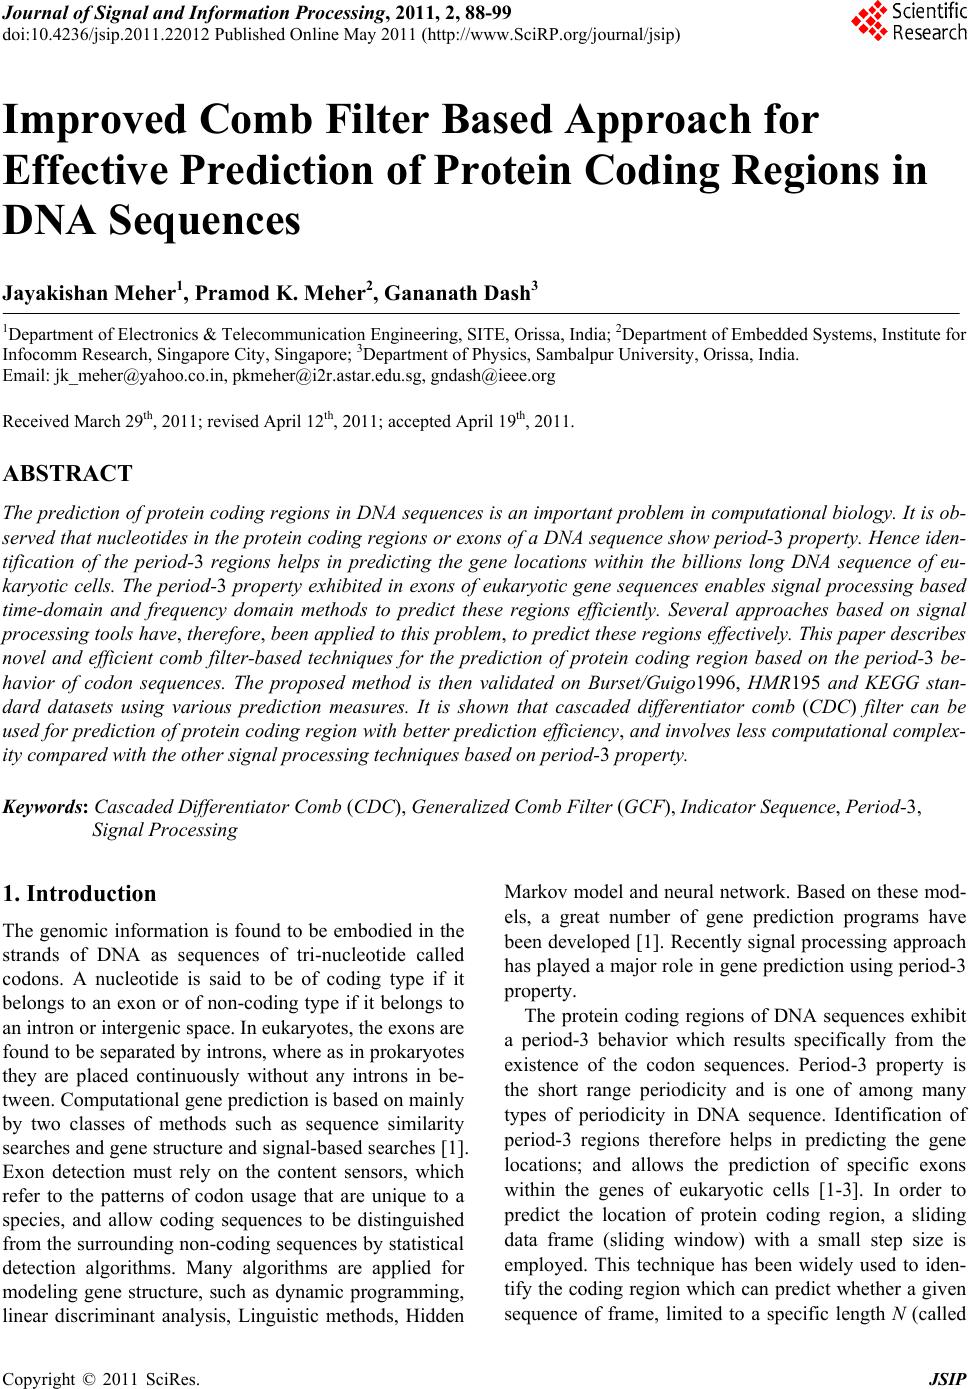
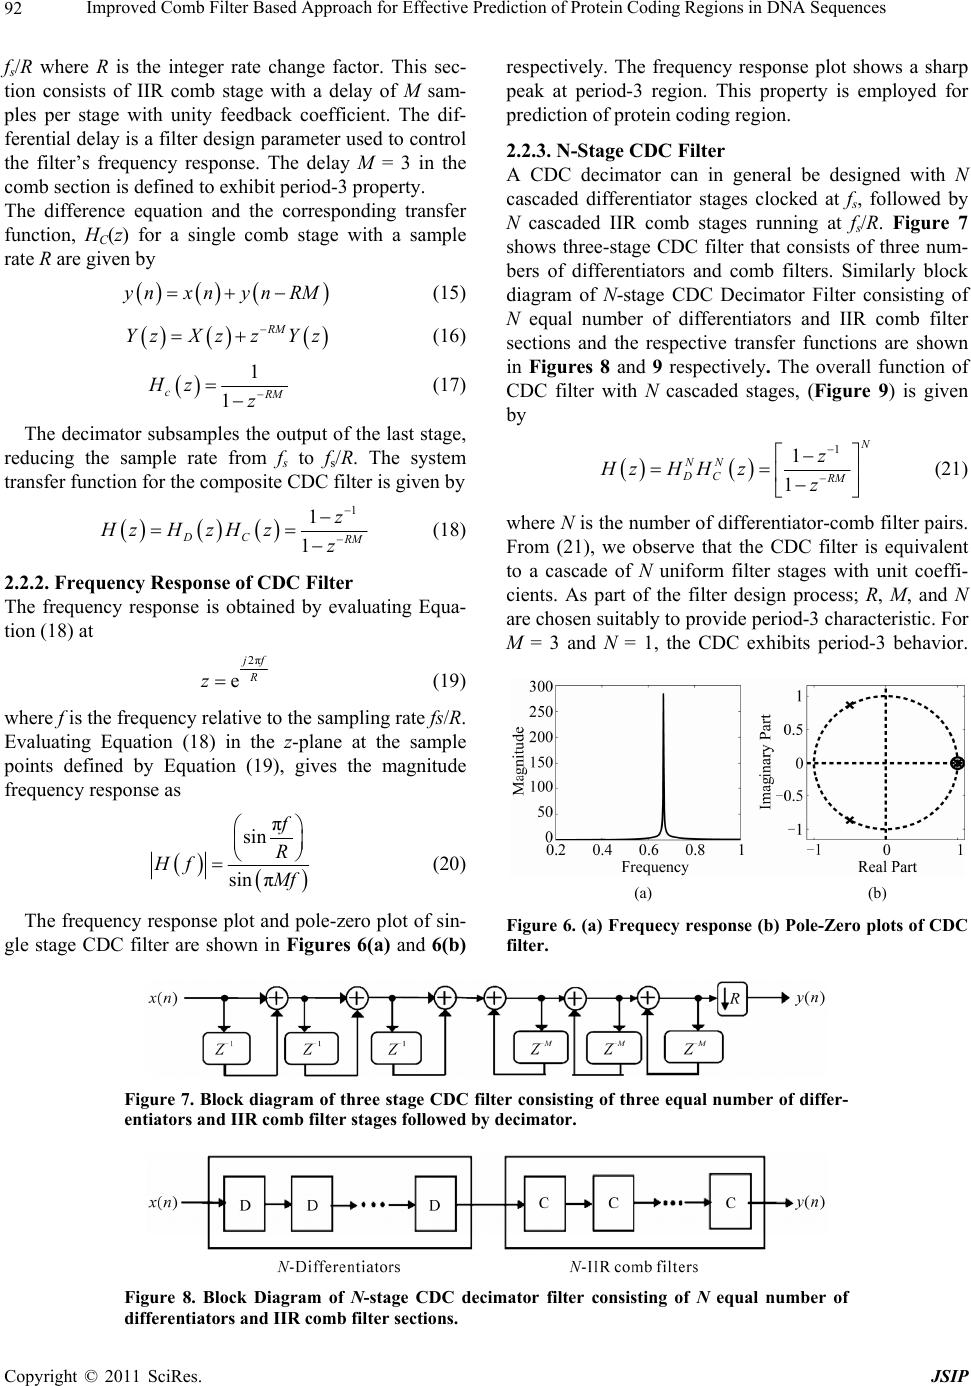
can therefore be used as an efficient tool for the identifi-
cation of protein coding regions of DNA sequences. As
such comb filter is simple in structure, involves less
computational complexity and better prediction effi-
ciency compared to the FFT-based methods and other
digital filtering methods. Hence it can be used as a com-
putationally efficient and better alternative to other DSP
approach to the prediction of protein coding regions.
REFERENCES
[1] Z. Wang, Y. Z. Chen and Y. X. Li, “A Brief Review of
Computational Gene Prediction Methods,” Genomics Pro-
teomics Bioinformatics, Vol. 2, No. 4, 2004, pp. 216-221.
[2] D. Anastassiou, “Genomic Signal Processing,” Signal
Processing Magazine, Vol. 18, No. 4, 2001, pp. 8-20.
doi:10.1109/79.939833
[3] J. W. Fickett, “The Gene Identification Problem: Over-
view for Developers,” Computers & Chemistry, Vol. 20,
No. 1, 1996, pp. 103-118.
doi:10.1016/S0097-8485(96)80012-X
[4] R. Voss, “Evolution of Long-Range Fractal Correlations
and 1/f Noise in DNA Base Sequences,” Physical Review
Letters, Vol. 68, No. 25, 1992, pp. 3805-3808.
doi:10.1103/PhysRevLett.68.3805
[5] P. D. Cristea, “Genetic signal Representation and Analy-
sis,” Proceedings of SPIE Conference, International
Biomedical Optics Symposium (BIOS'02), Vol. 4623, 2002,
pp. 77-84.
[6] A. K. Brodzik and O. Peters, “Symbol-Balanced Quater-
nionic Periodicity Transform for Latent Pattern Detection
in DNA Sequences,” IEEE International Conference on
Acoustics, Speech, and Signal Processing (ICASSP '05),
Vol. 5, 2005, pp. 373-376.
[7] T. M. Nair, S. S. Tambe and B. D. Kulkarni, “Application
of Artificial Neural Networks for Prokaryotic Transcrip-
tion Terminator Prediction,” FEBS Letters, Vol. 346, No.
2-3, 1994, pp. 273-277.
doi:10.1016/0014-5793(94)00489-7
[8] A. S. Nair and S. P. Sreenathan, “A Coding Measure
Scheme Employing Electron-Ion Interaction Pseudopo-
tential (EIIP),” Bioinformation, Vol. 1, No. 6, 2006, pp.
197-202.
[9] G. L. Rosen, “Signal Processing for Biologically-Inspired
Gradient Source Localization and DNA Sequence Analy-
sis,” Ph.D. Thesis, Georgia Institute of Technology, At-
lanta, 2006.
[10] A. S. Nair and S. P. Sreenathan, “An Improved Digital
Filtering Technique Using Frequency Indicators for Lo-
cating Exons,” Journal of the Computer Society of India,
Vol. 36, No. 1, 2006.
[11] R. Zhang and C. T. Zhang, “Z Curves, an Intuitive Tool
for Visualizing and Analyzing the DNA Sequences,”
Journal of Biomolecular Structure & Dynamics, Vol. 11,
No. 4, 1994, pp. 767-782.
[12] A. Rushdi and J. Tuqan, “Gene Identification Using the
Z-Curve Representation,” IEEE International Conference
on Acoustics, Speech and Signal Processing, Toulouse,
14-19 May 2006, pp. 1024-1027.
[13] M. Akhtar, J. Epps and E. Ambikairajah, “On DNA Nu-
merical Representations for Period-3 Based Exon Predic-
tion,” IEEE International Workshop on Genomic Signal
Processing and Statistics, Tuusula, 2007.
[14] B. D. Silverman and R. Linsker, “A Measure of DNA
Periodicity,” Journal of Theoretical Biology, Vol. 118,
No. 3, 1986, pp. 295-300.
doi:10.1016/S0022-5193(86)80060-1
[15] S. Tiwari, S. Ramachandran, A. Bhattacharya, S. Bhatta-
charya and R. Ramaswamy, “Prediction of Probable
Genes by Fourier Analysis of Genomic Sequences,” Bio-
informatics, Vol. 13, No. 3, 1997, pp. 263-270.
doi:10.1093/bioinformatics/13.3.263
[16] D. Anastassiou, “Digital Signal Processing of Bio-
molecular Sequences,” Technical Report, Columbia Uni-
versity, 2000-20-041, April 2000.
[17] D. Anastassiou, “Frequency-Domain Analysis of Bio-
molecular Sequences,” Bioinformatics, Vol. 16, No. 12,
2000, pp. 1073-1082.
doi:10.1093/bioinformatics/16.12.1073
[18] P. P. Vaidyanathan and B. J. Yoon, “Digital Filters for
Gene Prediction Applications,” IEEE Asilomar on Signals,
Systems, and Computers, Monterey, 3-6 November 2002,
pp. 306-310.
[19] P. P. Vaidyanathan and B. J. Yoon, “The Role of Signal
Processing Concepts in Genomics and Proteomics,”
Journal of the Franklin Institute, Vol. 341, No. 1-2, 2004,
pp. 111-135. doi:10.1016/j.jfranklin.2003.12.001
[20] D. Koltar and Y. Lavner, “Gene Prediction by Spectral
Rotation (SR) Measure: A New Method for Identifying
Protein-Coding Regions,” Genome Research, Vol. 13, No.
8, 2003, pp. 1930-1937.
[21] A. Fuentes, J. Ginori and R. Abalo, “A New Predictor of
Coding Regions in Genomic Sequences Using a Combi-
nation of Different Approaches,” International Journal of
Biomedical and Life Sciences, Vol. 3, No. 2, 2007, pp.
1-5.
Copyright © 2011 SciRes. JSIP
Improved Comb Filter Based Approach for Effective Prediction of Protein Coding Regions in DNA Sequences
Copyright © 2011 SciRes. JSIP
99
[22] J. Tuqan and A. Rushdi, “A DSP Approach for Finding
the Codon Bias in DNA Sequences,” IEEE Journal of
Selected Topics in Signal Processing, Vol. 2, No. 3, 2008,
pp. 343-356. doi:10.1109/JSTSP.2008.923851
[23] P. Jesus, M. Chalco and H. Carrer, “Identification of Pro-
tein Coding Regions Using the Modified Gabor-Wavelet
Tranform,” IEEE/ACM Transaction on Computational
Biology and Bioinformatics, Vol. 5, No. 2, 2008, pp. 198-
207. doi:10.1109/TCBB.2007.70259
[24] L. Galleani and R. Garello, “The Minimum Entropy
Mapping Spectrum of a DNA Sequence,” IEEE Transac-
tion on Information Theory, Vol. 56, No. 2, 2010, pp.
771-783. doi:10.1109/TIT.2009.2037041
[25] M. Akhtar, J. Epps and E. Ambikairajah, “Signal Proce-
ssing in Sequence Analysis: Advances in Eukaryotic
Gene Prediction,” IEEE Journal of Selected Topics in
Signal Processing, Vol. 2, No. 3, 2008, pp. 310-321.
doi:10.1109/JSTSP.2008.923854
[26] S. K. Mitra, “Digital Signal Processing,” Tata McGraw-Hill,
New Delhi, 2006.
[27] A. V. Oppenheim and R. W. Schafer, “Discrete-Time
Signal Processing,” Prentice-Hall Inc., Upper Saddle
River, 1999.
[28] M. Burset and A. R. Guigo, “Evaluation of Gene Struc-
ture Prediction Programs,” Genomics, Vol. 34, No. 3,
1996, pp. 353-367. doi:10.1006/geno.1996.0298
[29] S. Rogic, A. Mackworth and F. Ouellette, “Evaluation of
Gene Finding Programs on Mammalian Sequences,” Ge-
nome Research, Vol. 11, No. 5, 2001, 817-832.
doi:10.1101/gr.147901
[30] M. Kanehisa and S. Goto, “KEGG: Kyoto Encyclopedia
of Genes and Genomes,” Nucleic Acid Research, Vol. 28,
No. 1, 2000, pp. 27-30.
doi:10.1093/nar/28.1.27
[31] G. Aggarwal and R. Ramaswamy, “Ab Initio Gene Iden-
tification: Prokaryote Genome Annotation with GeneScan
and GLIMMER,” Journal of Biosciences, Vol. 27, No. 1,
2002, pp. 7-14.
doi:10.1007/BF02703679