Paper Menu >>
Journal Menu >>
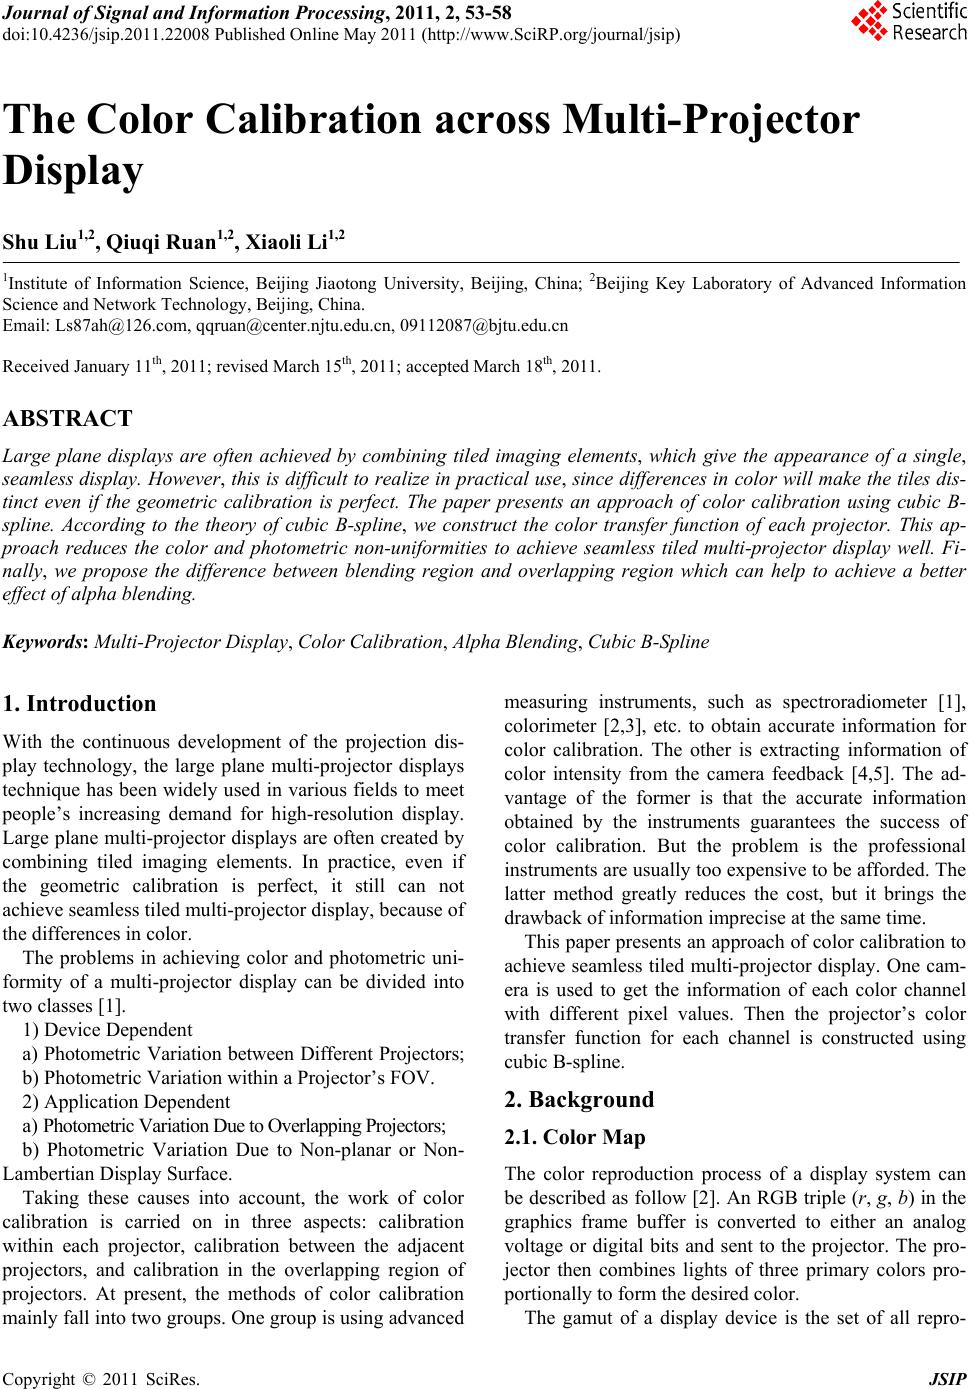 Journal of Signal and Information Processing, 2011, 2, 53-58 doi:10.4236/jsip.2011.22008 Published Online May 2011 (http://www.SciRP.org/journal/jsip) Copyright © 2011 SciRes. JSIP 53 The Color Calibration across Multi-Projector Display Shu Liu1,2, Qiuqi Ruan1,2, Xiaoli Li1,2 1Institute of Information Science, Beijing Jiaotong University, Beijing, China; 2Beijing Key Laboratory of Advanced Information Science and Network Technology, Beijing, China. Email: Ls87ah@126.com, qqruan@center.njtu.edu.cn, 09112087@bjtu.edu.cn Received January 11th, 2011; revised March 15th, 2011; accepted March 18th, 2011. ABSTRACT Large plane displays are often achieved by combining tiled imaging elements, which give the appearance of a single, seamless display. However, this is difficult to realize in practical use, since differences in co lor will make the tiles dis- tinct even if the geometric calibration is perfect. The paper presents an approach of color calibration using cubic B- spline. According to the theory of cubic B-spline, we construct the color transfer function of each projector. This ap- proach reduces the color and photometric non-uniformities to achieve seamless tiled multi-projector display well. Fi- nally, we propose the difference between blending region and overlapping region which can help to achieve a better effect of alpha blending. Keywords: Multi-Projector Display, Color Calibration, Alpha Blend ing, Cubic B-Spline 1. Introduction With the continuous development of the projection dis- play technology, the large plane multi-projector displays technique has been widely used in various fields to meet people’s increasing demand for high-resolution display. Large plane multi-projector displays are often created by combining tiled imaging elements. In practice, even if the geometric calibration is perfect, it still can not achieve seamless tiled multi-projector display, because of the differences in color. The problems in achieving color and photometric uni- formity of a multi-projector display can be divided into two classes [1]. 1) Device Dependent a) Photometric Variation between Different Projectors; b) Photometric Variation within a Projector’s FOV. 2) Application Dependent a) Photometric Variation Due to Overlapping P rojectors; b) Photometric Variation Due to Non-planar or Non- Lambertian Display Surface. Taking these causes into account, the work of color calibration is carried on in three aspects: calibration within each projector, calibration between the adjacent projectors, and calibration in the overlapping region of projectors. At present, the methods of color calibration mainly fall into two groups . One group is using advanced measuring instruments, such as spectroradiometer [1], colorimeter [2,3], etc. to obtain accurate information for color calibration. The other is extracting information of color intensity from the camera feedback [4,5]. The ad- vantage of the former is that the accurate information obtained by the instruments guarantees the success of color calibration. But the problem is the professional instruments are usually too expensive to be afforded. The latter method greatly reduces the cost, but it brings the drawback of information imprecise at the same time. This paper presents an approach of color calibration to achieve seamless tiled multi-projector display. One cam- era is used to get the information of each color channel with different pixel values. Then the projector’s color transfer function for each channel is constructed using cubic B-spline. 2. Background 2.1. Color Map The color reproduction process of a display system can be described as follow [2]. An RGB triple (r, g, b) in the graphics frame buffer is converted to either an analog voltage or digital bits and sent to the projector. The pro- jector then combines lights of three primary colors pro- portionally to form the desired color. The gamut of a display device is the set of all repro- 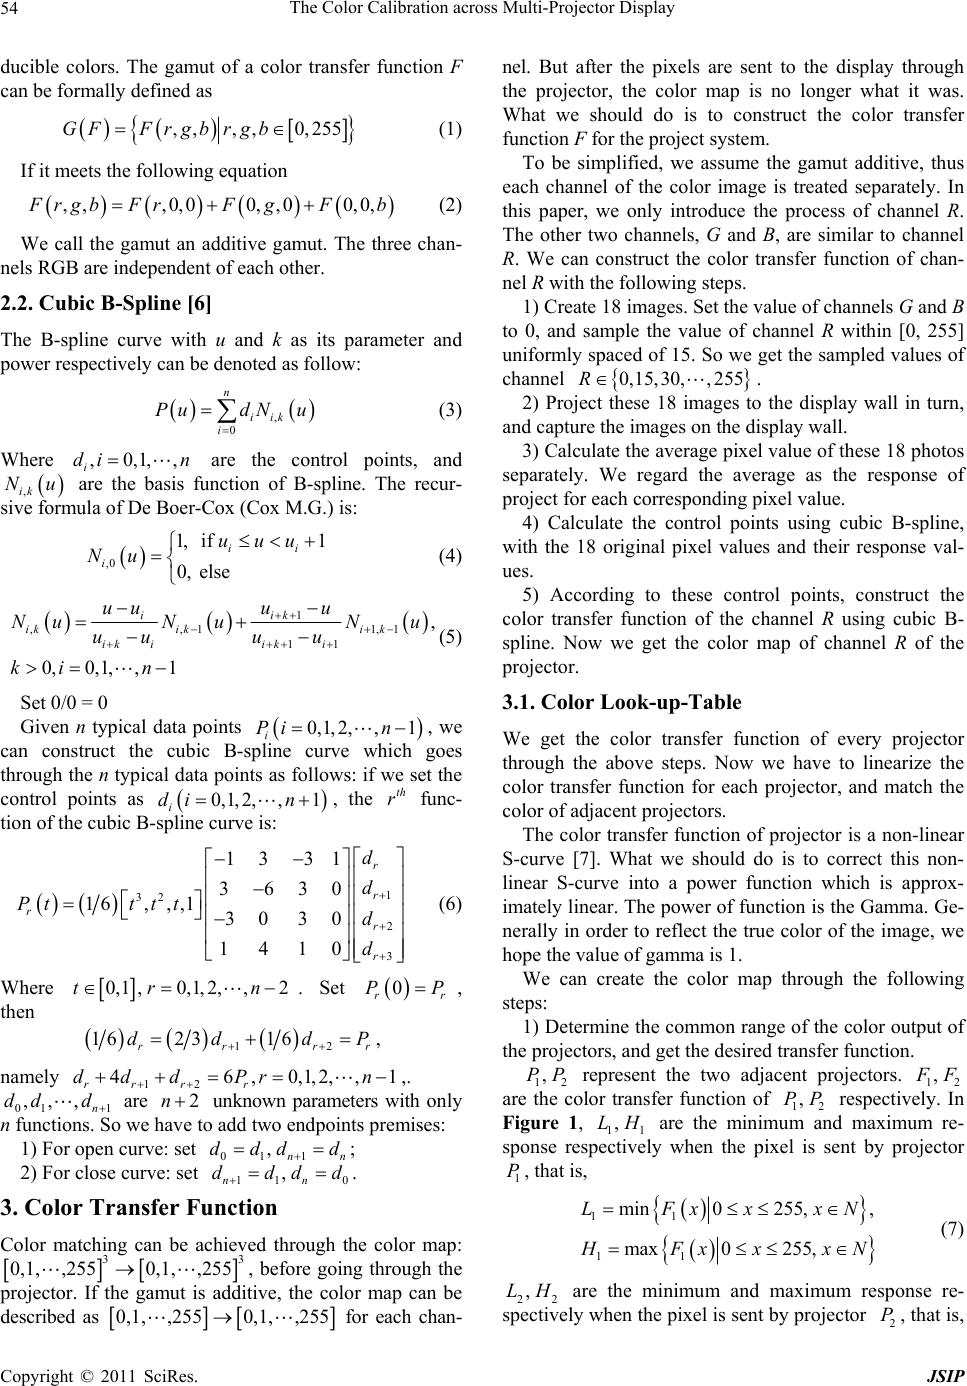 The Color Calibration across Multi-Projector Display Copyright © 2011 SciRes. JSIP 54 ducible colors. The gamut of a color transfer function F can be formally defined as ,, ,,0,255GF Frgbrgb (1) If it meets the following equation , ,,0,00, ,00,0, F rgbFrFgFb (2) We call the gamut an additive gamut. The three chan- nels RGB are independent of each other. 2.2. Cubic B-Spline [6] The B-spline curve with u and k as its parameter and power respectively can be denoted as follow: , 0 n iik i PudN u (3) Where ,0,1,, i di n are the control points, and ,ik Nu are the basis function of B-spline. The recur- sive formula of De Boer-Cox (Cox M.G.) is: ,0 1, if 1 0, else ii i uuu Nu (4) 1 ,,1 1,1 11 , 0,0,1,,1 iik ikiki k ik iiki uuu u NuN uNu uuu u ki n (5) Set 0/0 = 0 Given n typical data points 0,1,2, ,1 i Pi n, we can construct the cubic B-spline curve which goes through th e n typical data points as follows: if we set the control points as 0,1,2, ,1 i di n, the th r func- tion of the cubic B-spline curve is: 1 32 2 3 13 31 3630 16, ,,13030 1410 r r rr r d d Pt tttd d (6) Where 0,1 ,0,1,2,,2tr n . Set 0 rr PP , then 12 16 2316 rr rr dd dP , namely 12 46,0,1,2,,1 rrrr ddd Prn ,. 01 1 ,,, n dd d are 2n unknown parameters with only n functions. So we have to add two endpoints premises: 1) For open curve: set 01 1 ,nn ddd d ; 2) For close curve: set 11 0 , nn dddd . 3. Color Transfer Function Color matching can be achieved through the color map: 33 0,1, ,2550,1, ,255, before going through the projector. If the gamut is additive, the color map can be described as 0,1, ,2550,1, ,255 for each chan- nel. But after the pixels are sent to the display through the projector, the color map is no longer what it was. What we should do is to construct the color transfer function F for the project system. To be simplified, we assume the gamut additive, thus each channel of the color image is treated separately. In this paper, we only introduce the process of channel R. The other two channels, G and B, are similar to channel R. We can construct the color transfer function of chan- nel R with the following steps. 1) Create 18 images. Set the value of channels G and B to 0, and sample the value of channel R within [0, 255] uniformly spaced of 15. So we get the sampled values of channel 0,15,30, ,255R. 2) Project these 18 images to the display wall in turn, and capture the images on the display wall. 3) Calculate the average pixel value of these 18 photos separately. We regard the average as the response of project for each corresponding pixel value. 4) Calculate the control points using cubic B-spline, with the 18 original pixel values and their response val- ues. 5) According to these control points, construct the color transfer function of the channel R using cubic B- spline. Now we get the color map of channel R of the projector. 3.1. Color Look-up-Table We get the color transfer function of every projector through the above steps. Now we have to linearize the color transfer function for each projector, and match the color of adjacent projectors. The color transfer function of projector is a non-linear S-curve [7]. What we should do is to correct this non- linear S-curve into a power function which is approx- imately linear. The power of function is the Gamma. Ge- nerally in order to reflect the true color of the image, we hope the value of gamma is 1. We can create the color map through the following steps: 1) Determine the common range of the color output of the projectors, and get the desired transfer function. 12 ,PP represent the two adjacent projectors. 12 , F F are the color transfer function of 12 ,PP respectively. In Figure 1, 11 ,LH are the minimum and maximum re- sponse respectively when the pixel is sent by projector 1 P, that is, 11 11 min0 255,, max0 255, LFxxxN H Fxxx N (7) 22 ,LH are the minimum and maximum response re- spectively when the pixel is sent by projector 2 P, that is, 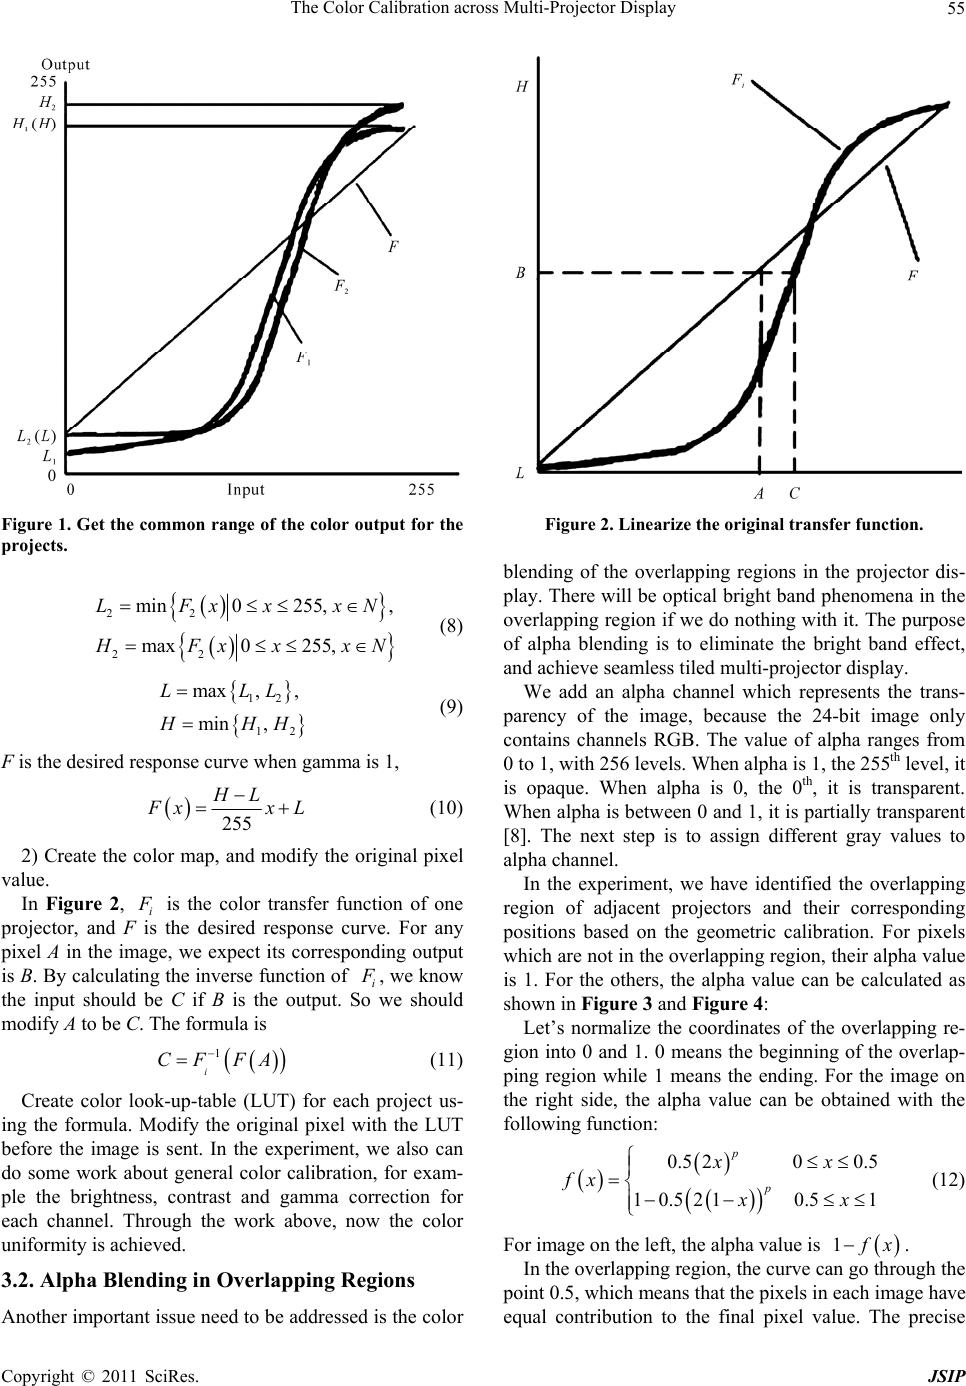 The Color Calibration across Multi-Projector Display Copyright © 2011 SciRes. JSIP 55 Figure 1. Get the common range of the color output for the projects. 22 22 min0 255,, max0 255, LFxxxN H Fx xxN (8) 12 12 max ,, min , LLL H HH (9) F is the desired response curve when gamma is 1, 255 HL F xxL (10) 2) Create the color map, and modify the original pixel value. In Figure 2, i F is the color transfer function of one projector, and F is the desired response curve. For any pixel A in the image, we expect its corresponding output is B. By calculating the inverse function of i F , we know the input should be C if B is the output. So we should modify A to be C. The formula is 1 i CF FA (11) Create color look-up-table (LUT) for each project us- ing the formula. Modify the original pixel with the LUT before the image is sent. In the experiment, we also can do some work about general color calibration, for exam- ple the brightness, contrast and gamma correction for each channel. Through the work above, now the color uniformity is achieved. 3.2. Alpha Blending in Overlapping Regions Another important issue need to be addressed is the color Figure 2. Linearize the original transfer function. blending of the overlapping regions in the projector dis- play. There will be optical bright band phenomena in the overlapping region if we do nothing with it. The purpose of alpha blending is to eliminate the bright band effect, and achieve seamless tiled multi-projector display. We add an alpha channel which represents the trans- parency of the image, because the 24-bit image only contains channels RGB. The value of alpha ranges from 0 to 1, with 256 levels. When alpha is 1, the 255th level, it is opaque. When alpha is 0, the 0th, it is transparent. When alpha is between 0 and 1, it is partially transparent [8]. The next step is to assign different gray values to alpha channel. In the experiment, we have identified the overlapping region of adjacent projectors and their corresponding positions based on the geometric calibration. For pixels which are not in the overlapping region, their alpha value is 1. For the others, the alpha value can be calculated as shown in Figure 3 and Figure 4: Let’s normalize the coordinates of the overlapping re- gion into 0 and 1. 0 means the beginning of the overlap- ping region while 1 means the ending. For the image on the right side, the alpha value can be obtained with the following function: 0.5 200.5 10.5210.5 1 p p xx fx xx (12) For image on the left, the alpha value is 1 f x. In the overlapping reg ion , th e curve can go through the point 0.5, which means that the pixels in each image have equal contribution to the final pixel value. The precise 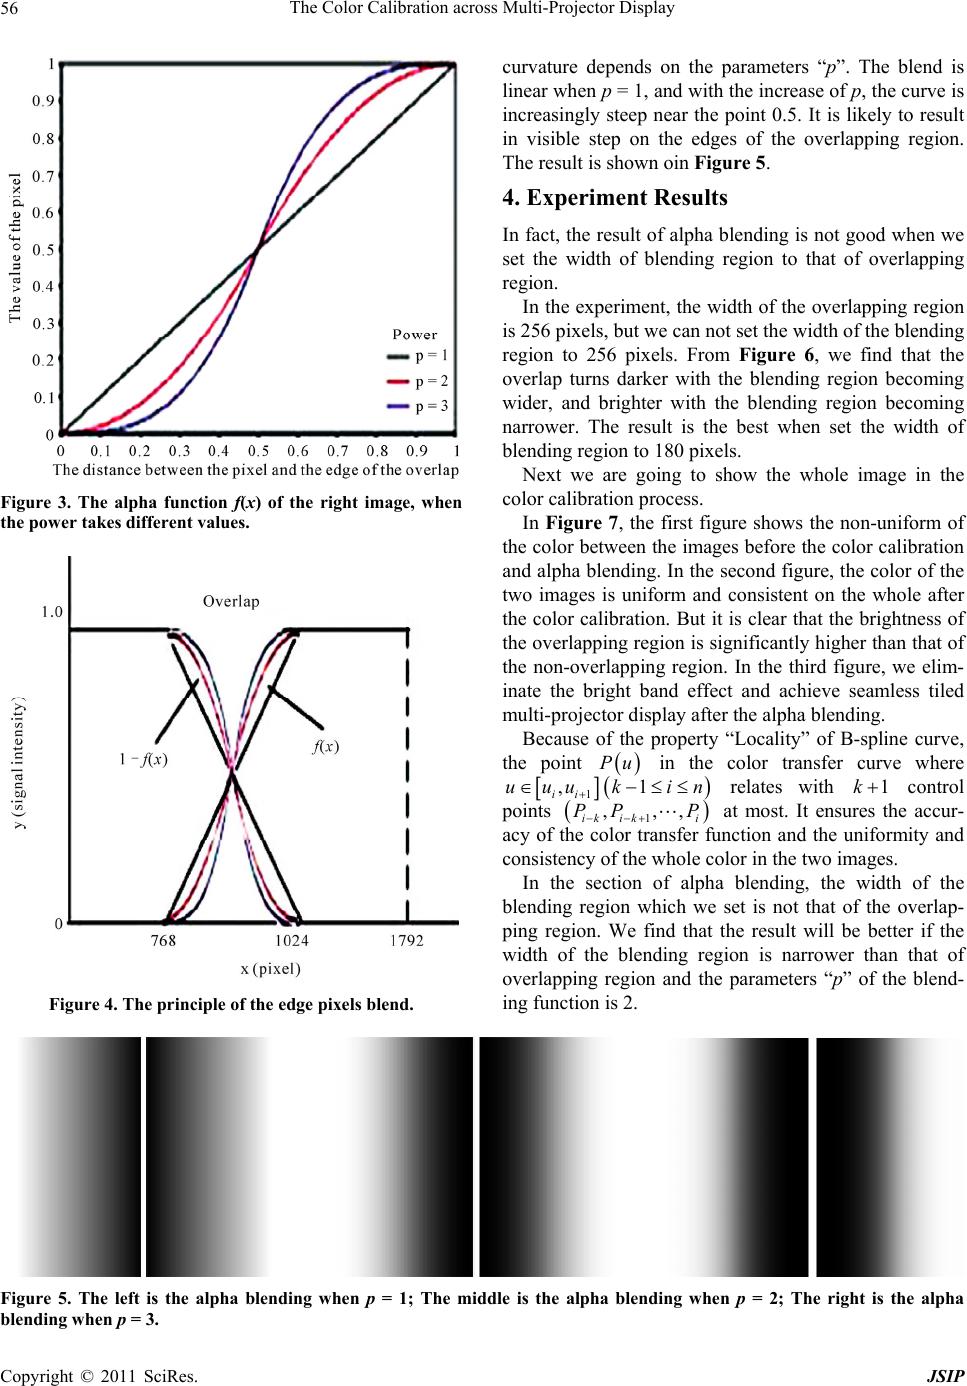 The Color Calibration across Multi-Projector Display Copyright © 2011 SciRes. JSIP 56 Figure 3. The alpha function f(x) of the right image, when the power takes different values. Figure 4. The principle of the edge pixels blend. curvature depends on the parameters “p”. The blend is linear when p = 1, and with the increase of p, the curve is increasingly steep near the point 0.5. It is likely to result in visible step on the edges of the overlapping region. The result is shown oin Figure 5. 4. Experiment Results In fact, the result of alpha blending is not good when we set the width of blending region to that of overlapping region. In the experiment, the width of the overlapping region is 256 pixels, but we can not set the width of the blending region to 256 pixels. From Figure 6, we find that the overlap turns darker with the blending region becoming wider, and brighter with the blending region becoming narrower. The result is the best when set the width of blending region to 180 pixels. Next we are going to show the whole image in the color calibration process. In Figure 7, the first figure shows the non-uniform of the color between the images before the color calibration and alpha blending. In the second figure, the color of the two images is uniform and consistent on the whole after the color calibration. But it is clear that the brightness of the overlapping region is significantly higher than that of the non-overlapping region. In the third figure, we elim- inate the bright band effect and achieve seamless tiled multi-projector display after the alpha blending. Because of the property “Locality” of B-spline curve, the point Pu in the color transfer curve where 1 ,1 ii uuu kin relates with 1k control points 1 ,,, ik iki PP P at most. It ensures the accur- acy of the color transfer function and the uniformity and consistency of the whole color in the two images. In the section of alpha blending, the width of the blending region which we set is not that of the overlap- ping region. We find that the result will be better if the width of the blending region is narrower than that of overlapping region and the parameters “p” of the blend- ing functi on is 2. Figure 5. The left is the alpha blending when p = 1; The middle is the alpha blending when p = 2; The right is the alpha blending when p = 3. 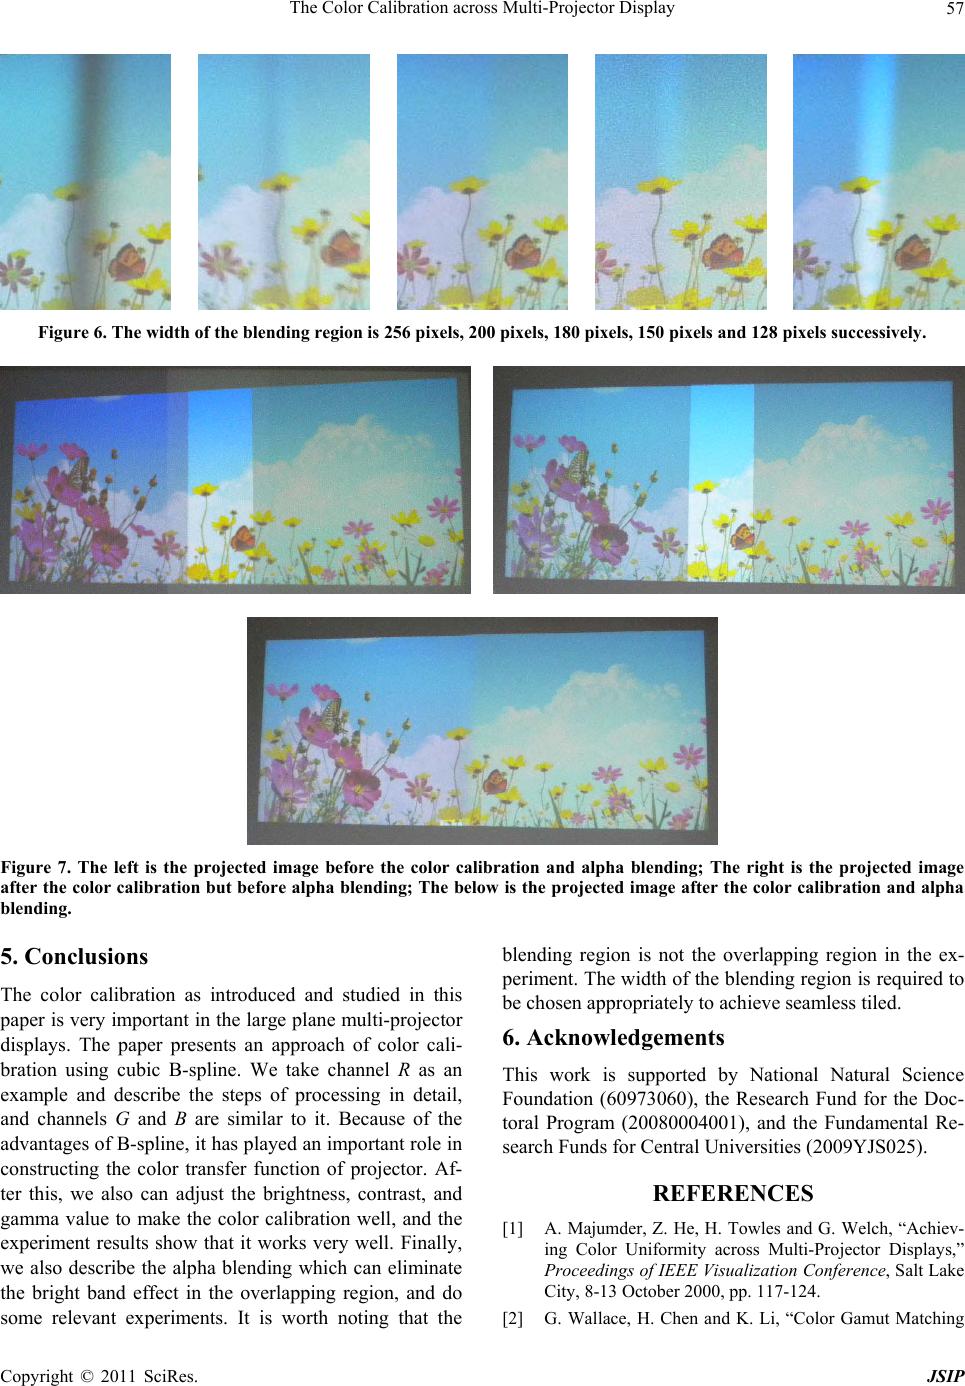 The Color Calibration across Multi-Projector Display Copyright © 2011 SciRes. JSIP 57 Figure 6. The width of the blending region is 256 pixels, 200 pixels, 180 pixels, 150 pixels and 128 pixels successively. Figure 7. The left is the projected image before the color calibration and alpha blending; The right is the projected image after the color calibration but before alpha blending; The below is the projec ted image after the color calibration and alpha blending. 5. Conclusions The color calibration as introduced and studied in this paper is very important in the large plane multi-projector displays. The paper presents an approach of color cali- bration using cubic B-spline. We take channel R as an example and describe the steps of processing in detail, and channels G and B are similar to it. Because of the advantages of B-spline, it has played an imp ortant role in constructing the color transfer function of projector. Af- ter this, we also can adjust the brightness, contrast, and gamma value to make the color calibration well, and the experiment results show that it works very well. Finally, we also describe the alpha blending which can eliminate the bright band effect in the overlapping region, and do some relevant experiments. It is worth noting that the blending region is not the overlapping region in the ex- periment. The width of the blending region is required to be chosen appropriately to achieve seamless tiled. 6. Acknowledgements This work is supported by National Natural Science Foundation (60973060), the Research Fund for the Doc- toral Program (20080004001), and the Fundamental Re- search Funds for Central Universities (2009YJS025). REFERENCES [1] A. Majumder, Z. He, H. Towles and G. Welch, “Achiev- ing Color Uniformity across Multi-Projector Displays,” Proceedings of IEEE Visualization Conference, Salt Lake City, 8-13 October 2000, pp. 117-124. [2] G. Wallace, H. Chen and K. Li, “Color Gamut Matching 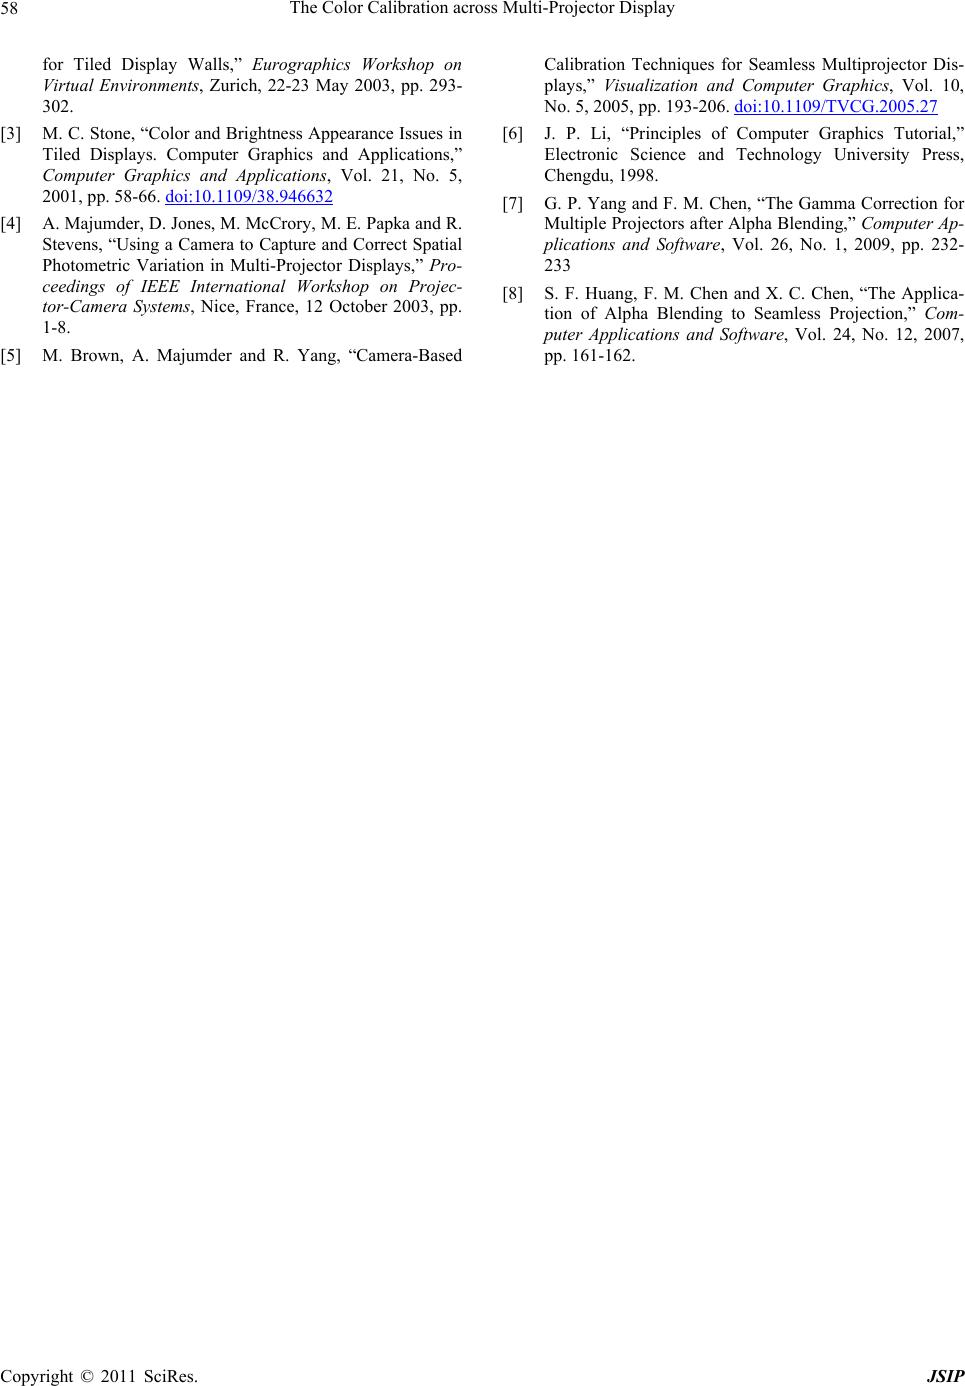 The Color Calibration across Multi-Projector Display Copyright © 2011 SciRes. JSIP 58 for Tiled Display Walls,” Eurographics Workshop on Virtual Environments, Zurich, 22-23 May 2003, pp. 293- 302. [3] M. C. Stone, “Color and Brightness Appearance Issues in Tiled Displays. Computer Graphics and Applications,” Computer Graphics and Applications, Vol. 21, No. 5, 2001, pp. 58-66. doi:10.1109/38.946632 [4] A. Majumder, D. Jones, M. McCrory, M. E. Pa pka and R. Stevens, “Using a Camera to Capture and Correct Spatial Photometric Variation in Multi-Projector Displays,” Pro- ceedings of IEEE International Workshop on Projec- tor-Camera Systems, Nice, France, 12 October 2003, pp. 1-8. [5] M. Brown, A. Majumder and R. Yang, “Camera-Based Calibration Techniques for Seamless Multiprojector Dis- plays,” Visualization and Computer Graphics, Vol. 10, No. 5, 2005, pp. 193-206. doi:10.1109/TVCG.2005.27 [6] J. P. Li, “Principles of Computer Graphics Tutorial,” Electronic Science and Technology University Press, Chengdu, 1998. [7] G. P. Yang and F. M. Chen, “The Gamma Correction for Multiple Projectors after Alpha Blending,” Computer Ap- plications and Software, Vol. 26, No. 1, 2009, pp. 232- 233 [8] S. F. Huang, F. M. Chen and X. C. Chen, “The Applica- tion of Alpha Blending to Seamless Projection,” Com- puter Applications and Software, Vol. 24, No. 12, 2007, pp. 161-162. |