Vol.2, No.2, 131-137 (2011)
doi:10.4236/as.2011.22019
C
opyright © 2011 SciRes. Openly accessible at http://www.scirp.org/journal/AS/
Agricultural Science s
Potential legacy effects of biofuel cropping systems on
soil microbial communities in southern Wisconsin, USA
Chao Liang1,2*, Gregg R. Sanford1,3, Randall D. Jackson1,3, Teri C. Balser2
1DOE Great Lakes Bioenergy Research Center, University of Wisconsin, Madison, USA;
*Corresponding Author: chaoliang@wisc.edu
2Department of Soil Science, University of Wisconsin, Madison, USA;
3Department of Agronomy, University of Wisconsin, Madison, USA.
Received 11 March 2011; revised 16 March 2011; accepted 31 March 2011.
ABSTRACT
Soil microbial community structure is clearly
linked to current plant species composition, but
less is known about the legacy effects of plant
species and agricultural management practices
on soil microbial communities. Using microbial
lipid biomarkers, we assessed patterns of com-
munity-level diversity and abundance at depths
of 0 - 10 and 10 - 25 cm from three hay (alfalfa/or-
chardgrass) and two corn plots in southern Wis-
consin. Principal components analysis of the
lipid biomarkers revealed differential composi-
tion of the soil microbial communities at the tw o
depths. Despite similar abundance of fungi,
bacteria, actinomycete, protozoa, and total mi-
crobial lipids in the hay and corn at 0 - 10 cm,
community structure differed with a significantly
higher absolute abundance of arbuscular my-
corrhizal fungi and gram-negative bacteria in the
hay plots. No significant microbial lipid mass
differences were detected between the two
management regimes at 10 - 25 cm, but the
proportional dominance of bacterial gram type
differed with depth. These results indicate the
potential for legacy effects of annual and peren-
nial cropping systems management on microbial
community composition and suggests the im-
portance of considering past land-use when ini-
tiating long-term agroecological trials.
Keywords: Lipid Biomarker; Alfalfa; Hay; Corn;
Agroecosystem
1. INTRODUCTION
Concern about ecological sustainability has stimulated
interest in describing the structure and function of soil
microbial communities, and in understanding how they
are affected by past and current land use [1-3]. Soil mi-
crobial community structure can be a sensitive indicator
of sustainable land use [4,5], and the variation in soil
microbial communities can further have significant im-
pacts on ecosystem processes that are central to key
ecosystem services, including plant production, carbon
mineralization, nutrient decomposition, and greenhouse
gas fluxes [6,7].
Land use management often alters plant species com-
position and soil properties, which exert selective pres-
sures on soil microbial taxa via differences in the quan-
tity and quality of organic inputs and altered microbial
competition for soil nutrients [8,9]. These selective pre-
ssures can play a key role in shaping the in situ composi-
tion of microbial communities [2,10-12]. Recent studies
have demonstrated how plant diversity can drive the
composition and function of the soil microbial commu-
nity and vice versa [13-15]. Alternative plant combina-
tions may result in unique microbial populations of bac-
teria and fungi with differing capabilities to utilize car-
bon substrates and withstand stresses. In agroecosystems,
this is manifested by the effect of crop rotation - in-
creasing microbial diversity, which can also alleviate
pathogen load and reduce weed and insect populations
compared to continuous monocultures [9,16].
Agroecosystems are increasingly scrutinized with re-
spect to their sustainability as the global priority of de-
velopment and production of alternatives to fossil fuels
as energy sources grows [17]. Biofuel feedstock produc-
tion in agricultural landscapes will in all likelihood alter
microbial diversity and drive changes in ecosystem fun-
ction through its impact on plant species choice. How-
ever, the direction and magnitude of these changes will
depend on the specific biofuel production systems im-
plemented. Alfalfa hay and corn have considerable po-
tential for use in the production of ethanol and other in-
dustrial materials in the United States [18,19]. In par-
ticular, alfalfa can contribute to making the United States
C. Liang et al. / Agricultural Sciences 2 (2011) 131-137
Copyright © 2011 SciRes. Openly accessible at http://www.scirp.org/journal/AS/
132
energy independent, improving the soil resource, reduc-
ing greenhouse gas emissions, and protecting ground-
water quality. Consequently, the use of alfalfa for biofuel
production is receiving significant attention, despite that
its refining remains underdeveloped relative to tradi-
tional corn-derived biofuel. However, because of con-
cerns over the environmental sustainability of different
crops and land management it is important to have a
better understanding of the potential legacy effects of
alfalfa and corn on soil microbial community abundance
and composition.
Using microbial lipid biomarkers, we assessed micro-
bial communities at two soil depths under crops with
contrasting histories, a 3-year alfalfa/orchardgrass hay-
field and a 3-year corn monoculture, in a southern Wis-
consin agroecosystem. Microbial community fingerprints,
total abundance and relative abundance of specific mi-
crobial groups, were determined to examine past man-
agement and soil depth influences on soil microbiota.
2. METHODS
2.1. Study Site and Soil Sampling
We sampled bulk soils from the 15-ha Great Lakes
Bioenergy Research Center (GLBRC) cropping system
experiment, located at the Arlington Agricultural Research
Station of the University of Wisconsin–Madison (Arling-
ton, WI, 43º18'10.86''N, 89º20'40.09'' W). Roughly 2/3 of
the 15-ha study area was maintained as a hayfield mix of
alfalfa and orchardgrass (Medicago sativa L. and Dactylis
glomerata L.) and 1/3 as a corn (Zea mays L) monocul-
ture from 2005 to 2008. Before 2005, the entire study area
was part of a long-term maize-soybean annual rotation
that received annual inputs of swine effluent and UW Ex-
tension-recommended rates of inorganic fertilizer. The
15-ha area contained sixty 43 × 27-m plots within 5
blocks meant to account for spatial variability. Within
each block, one plot (experiment unit) was randomly se-
lected for soil microbial sampling. The nearest distance
between foci plots is larger than 90-m. Based on the spa-
tial separation and random selection we assume insignifi-
cant relationship or independence between our experi-
mental units which are replicates of our interest. Our ex-
perimental design was pseudoreplicated [20,21] because
our intent here was to describe the microbial communities
and explore the potential for cropping system legacy ef-
fects in an inference space limited to our study site.
The sampled soils were classified as a Plano silt loam
(fine-silty, mixed, superactive, mesic Typical Argiul-
dolls), which formed under tallgrass prairie and charac-
terized by high organic matter (OM), high cation ex-
change capacity (CEC), and exceptional agricultural pro-
ductivity (Table 1). Five 37-mm diameter soil cores were
collected from a grid pattern in each plot in August of
2008 to ensure a representative sample. The cores were
sectioned into two depths (0 - 10 cm and 10 - 25 cm),
tran- sported back to the laboratory immediately, passed
through a 6.33-mm sieve to remove visible stones and
debris, freeze-dried, and subsequently homogenized for
storage at –20˚C.
2.2. Microbial Community Composition
Analysis
We used a hybrid procedure of phospholipid fatty acid
(PLFA) and fatty acid methyl ester (FAME) analysis to
assay microbial community composition [22]. The pro-
cedure was based on the extraction of signature lipid
biomarkers from the cell membrane of microorganisms.
Lipids were extracted, purified and identified using steps
from a modified lipid extraction technique first de-
scribed by Bligh and Dyer [23] for lipid extraction, com-
bined with FAME as described by Microbial ID Inc.
(Hayward, CA). Briefly, approximately 3 g lyophilized
soil was extracted with phosphate buffer-chloroform-
methanol (2.7 ml-3.0 ml-6.0 ml). We analyzed extracts
with a Hewlett-Packard Agilent 6890A gas chromato-
graph (Agilent Tech. Co., Santa Clara, CA) equipped with
a 25-m × 0.2-mm × 0.33-µm Agilent Ultra-2 (5%
phenyl)-methylpolysiloxane capillary column (Hewlett
Packard, Palo Alto, CA) and flame ionization detector.
MIDI’s EUKARY method database was used to identify
fatty acids. We added 19:0 (nonadecanoic methyl ester)
and 9:0 (nonanoic methyl ester) as internal standards and
used them to convert fatty acid peak areas to nmol/g soil
(absolute abundance) and mol% (proportional abun-
dance). We quantified the abundance of different mi-
crobial groups using the abundance of signature lipids.
Microbial biomass was represented by the sum of all
identifiable lipids (carbon number < 20).
2.3. Lipid Nomenclature
Fatty acids are named according to the convention
X:YωZ, where “X” is the number of carbon atoms, “Y”
is the number of double bonds, and “Z” is the number of
carbon atoms from the methyl end of the molecule to the
first double bond. Branched chain fatty acids are indi-
cated by the prefixes “i” and “a” for iso and anteiso
branching respectively. The prefix “cy” stands for cyclo-
propane ring, and “10Me” indicates methyl branching on
the 10th carbon from the carboxyl end.
2.4. Statistical Analysis
The mole percentage distribution of lipids was ana-
lyzed by JMP 5.0 software for principal component
analysis (PCA) to identify soil microbial community
C. Liang et al. / Agricultural Sciences 2 (2011) 131-137
Copyright © 2011 SciRes. Openly accessible at http://www.scirp.org/journal/AS/
133
Table 1. Selected physical and chemical characteristics of the soils from the hay and corn sites. The means and standard er-
rors (shown in parentheses) are calculated by t test (P < 0.01) based on all plots in the field (n = 36 and 24 for hay and corn
sites, respectively). Bold values indicate significant effects within depth, and underlined values indicate significant effects
between sites.
Soil Depth
(cm) PH Value CEC Total C
(%)
Total N
(%)
OM
(%)
Bulk Density
(g/cm3)
0-10 6.49 (0.03) 9.70 (0.27) 2.17 (0.04) 0.18 (0.01) 3.72 (0.07) 1.29 (0.02)
Hay 10-25 6.44 (0.03) 9.57 (0.29) 1.83 (0.05) 0.15 (0.01) 3.47 (0.07) 1.52 (0.06)
0-10 6.55 (0.06) 9.44 (0.46) 2.22 (0.07) 0.22 (0.02) 3.75 (0.08) 1.28 (0.03)
Corn 10-25 6.44 (0.07) 9.54 (0.42) 2.26 (0.04) 0.22 (0.00) 3.80 (0.08) 1.38 (0.02)
structure. Analysis of variance on the principal compo-
nents (PC1 and PC2) was conducted to assess the dif-
ferences in cropping system and soil depth. PCA was
performed on all lipid data from the different systems
and different depths. The grouping of the samples was
visualized with a scatter diagram of the scores. The
loading score factor for the individual lipids were used
to assess the relative importance of each individual lipid
in the calculation of the principal component axes. We
used a general linear mixed model (GLMM) to test the
effects of management regime and depth layer on soil
lipid absolute and proportional abundance, including 5
subplot replicates as a random factor. GLMM was per-
formed separately for each soil layer in order to focus on
the effect of management history in this study. Sample
outliers were detected by Grubbs’ test (P < 0.05). For
comparisons of soil background indices at the field scale,
a paired t test was used to compare the means with depth,
and an unpaired t test to compare the means between
different cropping sites (P < 0.01).
3. RESULTS
Soil physical and chemical properties were generally
similar between the hayfield and corn monoculture areas
in 0-10 cm topsoil, but we did find significantly greater
total carbon (C), total nitrogen (N) and organic matter
(OM) contents in the 10 - 25 cm soil layer in the corn
versus the hay site (Ta bl e 1 ). In the corn site by depth,
we found no significant differences in pH value, CEC,
total C, total N or OM contents. The hay site, in contrast,
showed a significant decrease in soil total C, total N and
OM contents at the 10 - 25 cm sampling depth compared
to the surface layer. The bulk density at the hay site in-
creased from 1.29 g/cm3 in the 0 - 10 cm layer to 1.52
g/cm3 in 10 - 25 cm layer, but did not change that sig-
nificantly in the corn site (Table 1).
A total of 58 different fatty acids were identified. Of
these, 43 were consistently present in the samples and
used for calculating total lipid amount and PCA. These
43 fatty acids ranged in carbon chain length from C12 to
C20. From these, 35 fatty acids known to be of microbial
origin were used for determining proportional abundance
and loading scores (Appendix and Table 2). The hay and
corn sites contained similar total microbial lipid biomass
in both 0 - 10 cm and 10 - 25 cm soil layer. The total
amount of microbial lipids in 0 - 10 cm soils (mean =
201.1 nmol/g soil) was more than double (mean = 88.5
nmol/g soil) in the 10 - 25 cm layer.
Principal component analysis (PCA) of the lipid data
suggested a substantial degree of differentiation in mi-
crobial communities between 0 - 10 cm and 10 - 25 cm
(Figure 1). The first principal component axis (PC1)
explained 49.9% of the variance in the data while the
second principal component axis (PC2) explained 11.3%.
Overall, the differentiation of the lipid signatures be-
tween the two depths was greater than that between
samples collected at the same depth from the two dif-
ferent cropping systems. We also note that the variance
in the lipid signatures from replicate samples was higher
at the 10 - 25 cm layer comparing to that from the sur-
face 0 - 10 cm layers.
The differences in lipid signatures with soil depth
primarily resulted from differences in individual lipid
proportional abundances (mol%). Individual lipids with
the highest positive and the lowest negative loading
scores in both sites are shown in Ta ble 2 . Indicators for
protozoa and fungi had a large positive PCA loading
scores on PC1 and appeared to become proportionately
less abundant in 10 - 25 cm than 0 - 10 cm depth (Table
2 and Appendix). Lipids that indicate gram-positive
(Gm+) bacteria and actinomycetes had large negative
loading scores that appeared to increase in proportional
abundance with depth (Table 2 and Appendix).
We also used specific lipids as biomarkers to quantify
the abundances of specific microbial groups. For exam-
ple, the lipid indicative of protozoa (20:4ω6,9,12,15c)
was detected in the surface 0 - 10cm soil in both crop-
ping systems but not at the greater depth. For both crop-
ping systems, the absolute abundance (nmol/g soil) of
bacteria, fungi, actinomycete, protozoa and total micro-
bial lipid biomass in 0 - 10 cm were significantly greater
than at 10 - 25 cm depth. Despite similar absolute
amounts of fungal, bacterial, actinomycetic, protozoal
and total microbial lipids between hay and corn sites in
C. Liang et al. / Agricultural Sciences 2 (2011) 131-137
Copyright © 2011 SciRes. Openly accessible at http://www.scirp.org/journal/AS/
134
Figure 1. Principal component analysis (PCA) of lipid signatures (mol%) from soil sam-
ples collected at two different depths within the hay and corn sites. PC1 explains 49.9% of
the variance in the lipid data, PC2 explains 11.3%. The PCA analysis was carried out us-
ing 43 individual lipids. Two of the 50 scores were taken away as outliers. All the 0~10
cm samples were clustered in yellow shaded area, the 10 - 25 cm samples in dark shaded
area. Error bars indicate standard deviations (n = 24).
Table 2. Individual microbial lipids most responsible for the changes in lipid signatures with depth along the first
principal component (PC1). We chose the lipids with loading scores (correlations of PC1 with each lipid) that
were relatively high in magnitude and had similar scores in both sites. A positive loading score is driven by a de-
crease in proportional abundance with depth.
PLFA Loading score
in Hay site
Loading score
in Corn site
Specificity as a
biomarker
20:4ω6,9,12,15c 0.9362 0.9361 Protozoa
i14:0 0.9116 0.8059 Gram-positive bacteria
17:1ω8c 0.8814 0.9139 Gram-negative bacteria
18:2ω6c 0.8425 0.9274 Fungi
15:0 0.6322 0.5516 Uncertain
18:1ω9c 0.6163 0.8135 Fungi
18:1ω7c 0.5707 0.7139 Gram-negative bacteria
19:0cy –0.9348 –0.9420 Gram-negative bacteria
16:1 2OH –0.8551 –0.8411 Uncertain
i16:0 –0.8501 –0.6293 Gram-positive bacteria
a15:0 –0.8474 –0.7513 Gram-positive bacteria
20:0 –0.8455 –0.8642 Uncertain
a17:0 –0.8116 –0.7037 Gram-positive bacteria
i17:0 –0.8098 –0.5762 Gram-positive bacteria
10Me 16:0 –0.7224 –0.7834 Actinomycete
i15:0 –0.6759 –0.4260 Gram-positive bacteria
the depth of 0 - 10 cm soil, microbial community struc-
ture did differ in some ways. This was most evident in
the significantly higher absolute abundance of arbuscular
mycorrhizal fungi (AMF) and gram-negative (Gm) bac-
teria in the hay site compared to the corn (Figure 2). In
addition, we found no significant system differences in
microbial properties as defined by lipid biomass in the
10 - 25 cm soils. When considering the relative propor-
tional abundances (mol%) of specific microbial groups,
we observed a significant increase in Gm+ bacteria and
actinomycetes with depth (Appendix). Besides the sig-
nificant differences in proportional abundances (%) of
AMF between hay and corn sites in 0 - 10 cm soils as
they were in the absolute abundance (nmol/g), we also
found significant difference in the relative proportional
abundance of Gm- bacteria in 10 - 25 cm soil between
sites. Finally, the calculated lipid ratios also confirmed
the community change in different microbial groups
C. Liang et al. / Agricultural Sciences 2 (2011) 131-137
Copyright © 2011 SciRes. Openly accessible at http://www.scirp.org/journal/AS/
135
Figure 2. Changes in select microbial indices (abundance at nmol/g dry soil or mol% by lipid) in two depths from hay and corn
sites. Error bars are standard deviations. Asterisk symbol denotes a significant difference based on GLMM analysis between two
sites at * p < 0.1, ** p < 0.05, *** p < 0.001, respectively. Note: we use the sum of 16:1ω5c, 18:1ω9c, 18:3ω6c and 18:2ω6c to
represent fungal lipids. Gm+ bacteria are represented by the sum of i14:0, i15:0, a15:0, i16:0, i17:0 and a17:0, while the sum of
16:1ω7c, 16:1ω9c, cy17:0, 17:1ω8c, cy19:0 and 18:1ω7c is used to indicate Gm bacteria. The sum of 17:0 10M, 16:0 10Me
and 18:0 10Me represents actinomycete. Protozoa is represented by 20:4ω6,9,12,15c, Arbuscular mycorrhizal fungi (AMF) by
16:1ω5c and Saprotrophic fungi (SF) by the sum of 18:1ω9c and 18:2ω6c.
between two sites (data not shown). The lipid ratios of
Gm+ to Gm bacteria, and saprotrohic fungi (SF) to AMF
were significantly higher (p < 0.05) in the corn site than
in the hay site in 0 - 10 cm soil layer; in the 10-25 cm
layer, we did not detect significant difference (p > 0.05)
in lipid ratios for the fungi to bacteria, Gm+ to Gm bac-
teria, and SF/AMF ratios between two sites.
4. DISCUSSION
Aboveground crop residues function as the dominant
source of nutrients for microorganisms in the upper soil
horizons, while root degradants and exudates contribute
organic materials at lower soil depths. At our site, the
corn monoculture did not have significant chemical and
physical differences between the 0 - 10 cm and 10 - 25
cm soil layers compared with the relatively distinct lay-
ers in the alfalfa/orchardgrass hay field. We reason that
this stems from the fact that corn management includes
tillage while the hay systems do not. Typical tillage op-
erations for corn disturb and partially mix the upper 20
cm of a soil profile. It is plausible that this mixing action
resulted in the lack of difference between the 0 - 10 cm
and 10 - 25 cm horizons in the corn monoculture.
In our study, soil depth appeared to have a stronger
effect on soil microbial community composition than
crop system underscoring the importance of biological
habitat versus substrate quantity and quality on the
composition of soil microorganisms. Microbial commu-
nity change with depth appeared to be driven primarily
by decreasing soil protozoa and fungi, and by increasing
Gm+ bacteria and actinomycetes in proportion to the
total as indicated by the major lipid contributors. A
number of other studies have also found that the soil
microbial community differs with depth across varied
ecosystems [2,24,25]. However, the greater variance in
lipids we observed in the 10 - 25 cm layer compared to
the surface 0 - 10 cm layer does not align with a study
by Fierer et al. [25], who reported greater variance in
topsoils. We suggest that the higher spatial heterogeneity
in deeper layer at the corn site was caused by tillage
practices mixing surface microbes into the lower soil
layer; while at the hay site, heterogeneity was imparted
by deeper root growth and frequent occurrence of asso-
ciated N-fixing species.
There were distinct differences in the lipid patterns
between the two cropping systems. As might be ex-
pected, AMF abundance in the hay site was significantly
higher than in the corn site within the 0 - 10 cm sam-
10 cm 25 cm 0 cm 10 cm
C. Liang et al. / Agricultural Sciences 2 (2011) 131-137
Copyright © 2011 SciRes. Openly accessible at http://www.scirp.org/journal/AS/
136
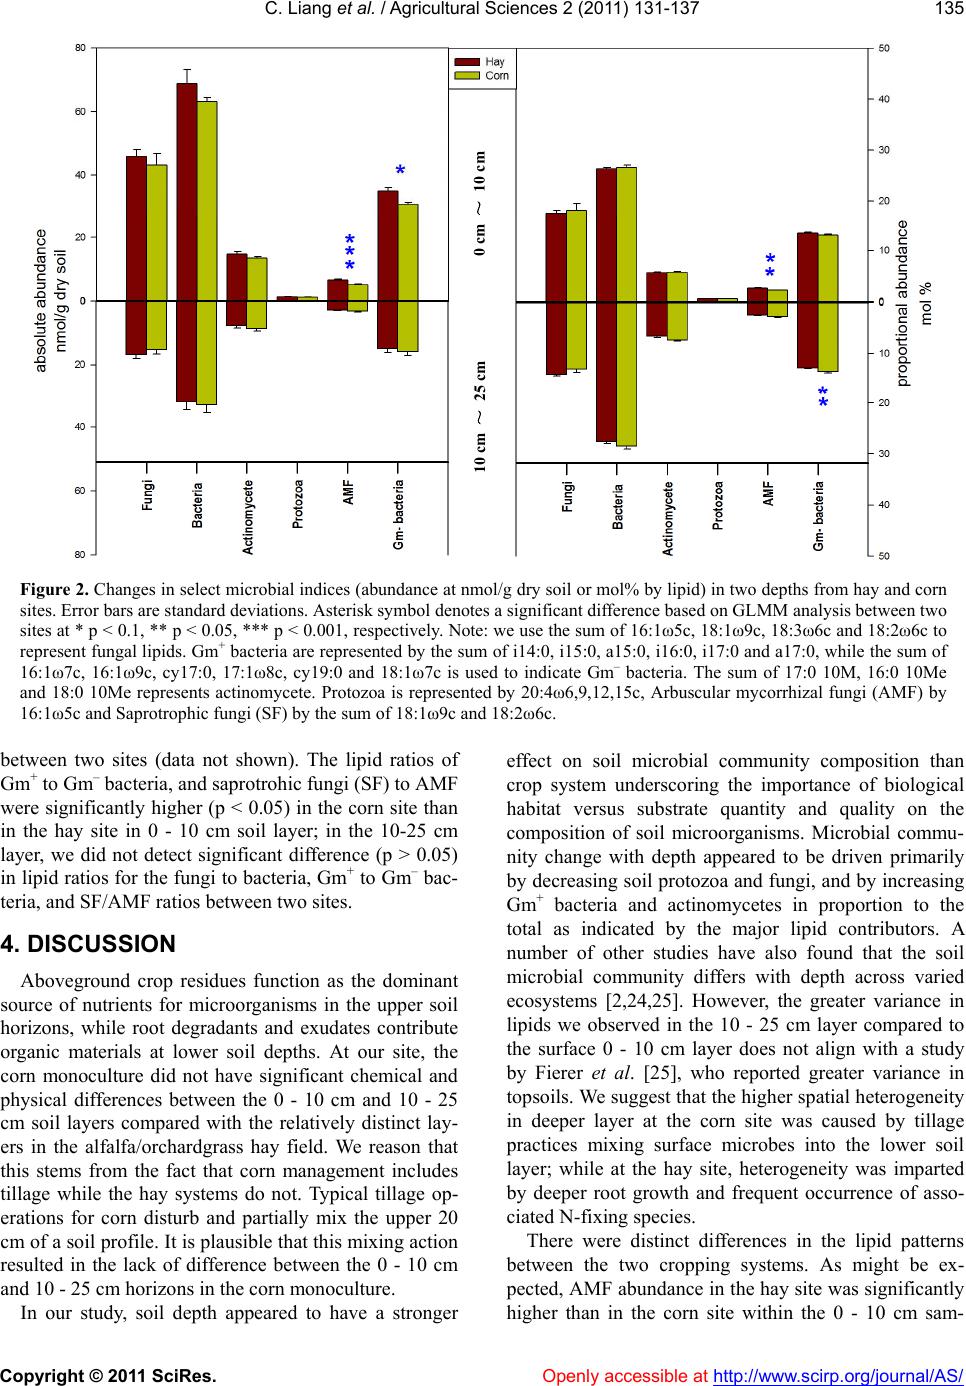
pling depth. This was likely to the result of tillage in the
corn site, which destroys fungal hyphae [26] and dis-
rupts the signaling action initiated by rhizobial nodula-
tion that can also stimulate mycorrhizal colonization
[27]. Historic tillage may have affected Gm bacteria as
well since higher absolute abundance of Gm bacteria
and fungi were found in non-tilled than tilled 0 - 5 cm
soil [28]. Higher Gm bacterial abundance at the hay site
in the 0 - 10 cm depth may be also explained by the en-
riched symbiotic Gm N-fixing rhizobia with legume
alfalfa plants, as the rhizosphere usually harbors more
Gm bacteria and fewer Gm+ bacteria [29].
In conclusion, we found that total microbial biomass
was constant between hay and corn sites, but markedly
decreased at the 10 - 25 cm depth in a southern Wiscon-
sin agroecosystem. Despite similar biomass between
sites, or distinct biomass between depths, there were
distinct microbial communities with a greater change in
composition and biomass between depths than between
sites. These results suggest habitat (depth in soils) may
be more important in controlling microbial community
composition than plant species and that pre-existing dif-
ferences in soil microbial communities under different
land use legacies may serve as an important covariate in
cropping systems analyses.
5. ACKNOWLEDGEMENTS
We would like to thank Laura Lipps, John Hall, Lawrence Oates,
and Stephan Miramontes for the assistance with field sampling, Harry
Read for assistance with analyzing lipid biomarkers, and Ting-Li Lin
(UW-Madison Department of Statistics, CALS statistical consultant)
and Masayuki Ushio for statistical expertise. This work was funded by
the DOE Great Lakes Bioenergy Research Center (DOE BER Office of
Science DE-FC02-07ER64494).
REFERENCES
[1] Lundquist, E.J., Scow, K.M., Jackson, L.E., Uesugi, S.L.
and Johnson, C.R. (1999) Rapid response of soil micro-
bial communities from conventional, low input, and or-
ganic farming systems to a wet/dry cycle. Soil Biology
and Biochemistry, 31, 1661-1675.
doi:10.1016/S0038-0717(99)00080-2
[2] Yao, H., Bowman, D. and Shi, W. (2006) Soil microbial
community structure and diversity in a turfgrass
chronosequence: Land-use change versus turfgrass man-
agement. Applied Soil Ecology, 34, 209-218.
doi:10.1016/j.apsoil.2006.01.009
[3] Zelles, L., Rackwitz, R., Bai, Q., Beck, T. and Beese, F.
(1995) Discrimination of microbial diversity by fatty acid
profiles of phospholipids and lipopolysaccharides in dif-
ferently cultivated soils. Plant and Soil, 170, 115-122.
doi:10.1007/BF02183059
[4] Anderson, T.-H. (2003) Microbial eco-physiological
indicators to asses soil quality. Agriculture, Ecosystems
& Environment, 98, 285-293.
doi:10.1016/S0167-8809(03)00088-4
[5] Visser, S. and Parkinson, D. (1992) Soil biological crite-
ria as indicators of soil quality: Soil microorganisms.
American Journal of Alternative Agriculture , 7, 33-37.
doi:10.1017/S0889189300004434
[6] Steenwerth, K.L., Jackson, L.E., Calderon, F.J., Strom-
berg, M.R., Scow, K.M. (2002) Soil microbial commu-
nity composition and land use history in cultivated and
grassland ecosystems of coastal California. Soil Biology
and Biochemistry, 34, 1599-1611.
doi:10.1016/S0038-0717(02)00144-X
[7] Balser, T.C. and Firestone, M.K. (2005) Linking micro-
bial community composition and soil processes in a
California annual grassland and mixed-conifer forest.
Biogeochemistry, 73, 395-415.
doi:10.1007/s10533-004-0372-y
[8] Nusslein, K. and Tiedje, J.M. (1999) Soil bacterial com-
munity shift correlated with change from forest to pas-
ture vegetation in a tropical soil. Applied and Environ-
mental Microbiology, 65, 3622-3626.
[9] Kennedy, A.C., Stubbs, T.L. and Schillinger, W.F. (2004)
Soil and crop management effects on soil microbiology.
CRC Press, Boca Raton, FL.
[10] Myers, R.T., Zak, D.R., White, D.C. and Peacock, A.
(2001) Landscape-Level Patterns of Microbial Commu-
nity Composition and Substrate Use in Upland Forest
Ecosystems. Soil Science Society of America Journal, 65,
359-367. doi:10.2136/sssaj2001.652359x
[11] Grayston, S.J., Griffith, G.S., Mawdsley, J.L., Campbell,
C.D. amd Bardgett, R.D. (2001) Accounting for variabil-
ity in soil microbial communities of temperate upland
grassland ecosystems. Soil Biology and Biochemistry, 33,
533-551. doi:10.1016/S0038-0717(00)00194-2
[12] Ushio, M., Wagai, R., Balser, T.C. and Kitayama, K.
(2008) Variations in the soil microbial community com-
position of a tropical montane forest ecosystem: Does
tree species matter? Soil Biology and Biochemistry, 40,
2699-2702. doi:10.1016/j.soilbio.2008.06.023
[13] Van der Heijden, M.G.A., Bardgett, R.D. and van
Straalen, N.M. (2008) The unseen majority: soil mi-
crobes as drivers of plant diversity and productivity in
terrestrial ecosystems. Ecology Letters, 11, 296-310.
doi:10.1111/j.1461-0248.2007.01139.x
[14] Zak, D.R., Holmes, W.E., White, D.C., Peacock, A.D.
and Tilman, D. (2003) Plant diversity, soil microbial
communities, and ecosystem function: are there any links?
Ecology, 84, 2042-2050. doi:10.1890/02-0433
[15] Bartelt-Ryser, J., Joshi, J., Schmid, B., Brandl, H. and
Balser, T. (2005) Soil feedbacks of plant diversity on soil
microbial communities and subsequent plant growth.
Perspectives in Plant Ecology, Evolution and Systematics,
7, 27-49. doi:10.1016/j.ppees.2004.11.002
[16] Pankhurst, C.E., Blair, B.L., Magarey, R.C., Stirling, G.R.,
Garside, A.L. (2005) Effects of biocides and rotation
breaks on soil organisms associated with the poor early
growth of sugarcane in continuous monoculture. Plant
and Soil, 268, 255-269.
doi:10.1007/s11104-004-0287-3
[17] Robertson, G.P., Dale, V.H., Doering, O.C., Hamburg,
S.P., Melillo, J.M., Wander, M.M., Parton, W.J., Adler,
P.R., Barney, J.N., Cruse, R.M., Duke, C.S., Fearnside,
C. Liang et al. / Agricultural Sciences 2 (2011) 131-137
Copyright © 2011 SciRes. http://www.scirp.org/journal/AS/Openly accessible at
137
P.M., Follett, R.F., Gibbs, H.K., Goldemberg, J.,
Mladenoff, D.J., Ojima, D., Palmer, M.W., Sharpley, A.,
Wallace, L., Weathers, K.C., Wiens, J.A. and Wilhelm,
W.W. (2008) Sustainable biofuels redux. Science, 322,
49-50. doi:10.1126/science.1161525
[18] Vadas, P., Barnett, K. and Undersander, D. (2008) Eco-
nomics and energy of ethanol production from alfalfa,
corn, and switchgrass in the Upper Midwest, USA. Bio-
Energy Research, 1, 44-55.
doi:10.1007/s12155-008-9002-1
[19] Samac, D.A., Jung, H.G. and Lamb, J.F. (2006) Devel-
opment of alfalfa (Medicago sativa L.) as a feedstock for
production of ethanol and other bioproducts. In: Alco-
holic, F. and Minteer, S. Eds., CRC Press, Boca Raton,
FL, 79-98.
[20] Hurlbert, S. (1984) Psudoreplication and the design of
ecological experiments. Ecological Monographs, 54,
187-211. doi:10.2307/1942661
[21] Simmons, B.L., Coleman, D.C. (2008) Microbial com-
munity response to transition from conventional to con-
servation tillage in cotton fields. Applied Soil Ecology,
40, 518-528. doi:10.1016/j.apsoil.2008.08.003
[22] Kao-Kniffin, J. and Balser, T.C. (2007) Elevated CO2
differentially alters belowground plant and soil microbial
community structure in reed canary grass-invaded ex-
perimental wetlands. Soil Biology and Biochemistry, 39,
517-525. doi:10.1016/j.soilbio.2006.08.024
[23] Bligh, E.G. and Dyer, W.J. (1959) A rapid method of total
lipid extraction and purification. Canadian Journal of
Physiology, 37, 911-917. doi:10.1139/y59-099
[24] Fritze, H., Pietikainen, J. and Pennanen, T. (2000) Dis-
tribution of microbial biomass and phospholipid fatty
acids in Podzol profiles under coniferous forest. Euro-
pean Journal of Soil Science, 51, 565-573.
[25] Fierer, N., Schimel, J.P. and Holden, P.A. (2003) Varia-
tions in microbial community composition through two
soil depth profiles. Soil Biology and Biochemistry, 35,
167-176. doi:10.1016/S0038-0717(02)00251-1
[26] Jansa, J., Mozafar, A., Kuhn, G., Anken, T., Ruh, R.,
Sanders, I.R. and Frossard, E. (2003) Soil tillage affects
the community structure of mycorrhizal fungi in maize
roots. Ecologica l Applic ations , 13, 1164-1176.
doi:10.1890/1051-0761(2003)13[1164:STATCS]2.0.CO;
2
[27] Xie, Z.P., Staehelin, C., Vierheilig, H., Wiemken, A.,
Jabbouri, S., Broughton, W.J., Vogeli-Lange, R. and
Boller, T. (1995) Rhizobial nodulation factors stimulate
mycorrhizal colonization of nodulating and nonnodulat-
ing soybeans. Plant Physiology, 108, 1519-1525.
[28] White, P.M., Rice, C.W. (2009) Tillage effects on micro-
bial and carbon dynamics during plant residue decompo-
sition. Soil Science Society of America Journal, 73,
138-145.doi:10.2136/sssaj2007.0384
[29] Paul, E.A. and Clark, F.E. (1996) Soil microbiology and
biochemistry. Academic Press, San Diego.
APPENDIX
Mol% of lipid in the different cropping sites shown as means of the measurements.
Mol%
Site
type
Depth
(cm) 14:0 i14:0 15:0 a15:0 i15:0 15:1
ISO G 16:0 16:0
2OH
16:0
ISO
16:1
2OH
16:1
ISO G1 6:1ω5c 16:1ω7c 16:1ω9c 17:0 a17:0 cy17:0 i17:0
0-10 1.63 0.56 0.67 3.15 4.74 0.66 12.76 0.47 1.91 0.59 0.64 2.58 4.33 0.52 0.49 1.10 1.45 1.51
Hay
10-25 1.50 0.10 0.46 3.93 5.35 0.26 11.93 0.00 2.30 1.05 0.00 2.45 3.88 0.27 0.17 1.31 0.99 1.85
0-10 1.40 0.55 0.78 3.18 5.08 0.72 11.18 0.57 1.92 0.72 0.63 2.19 4.03 0.50 0.53 1.15 1.42 1.68
Corn
10-25 1.46 0.10 0.56 3.89 5.35 0.08 11.70 0.07 2.17 1.12 0.00 2.75 4.13 0.49 0.37 1.40 1.53 1.98
Mol%
Site
type
Depth
(cm)
17:0
ISO
3OH
17:1
ω8c 18:0 18:0
2OH
18:1
ω9c
10Me
17:0
18:3
ω6c 19:0 cy19:0 20:020:1
ω9c
20:4ω
691215c
10Me
16:0
19:1
ω6c
18:2
ω6c
10Me
18:0
18:1
ω7c Total
0-10 0.40 0.47 4.38 0.33 7.78 0.92 1.65 0.16 1.88 1.74 0.48 0.53 3.58 0.92 5.58 1.10 4.19 75.85
Hay
10-25 0.00 0.00 5.65 0.05 6.61 0.59 1.76 0.24 2.98 2.75 0.21 0.00 4.71 1.89 3.29 1.28 3.62 73.43
0-10 0.47 0.55 4.04 0.42 8.89 0.68 0.93 0.16 1.91 1.98 0.52 0.51 3.81 1.10 6.15 1.19 3.92 75.48
Corn
10-25 0.00 0.00 5.31 0.23 6.32 0.70 0.98 0.31 2.86 2.70 0.00 0.00 5.24 1.68 3.10 1.39 3.49 73.41