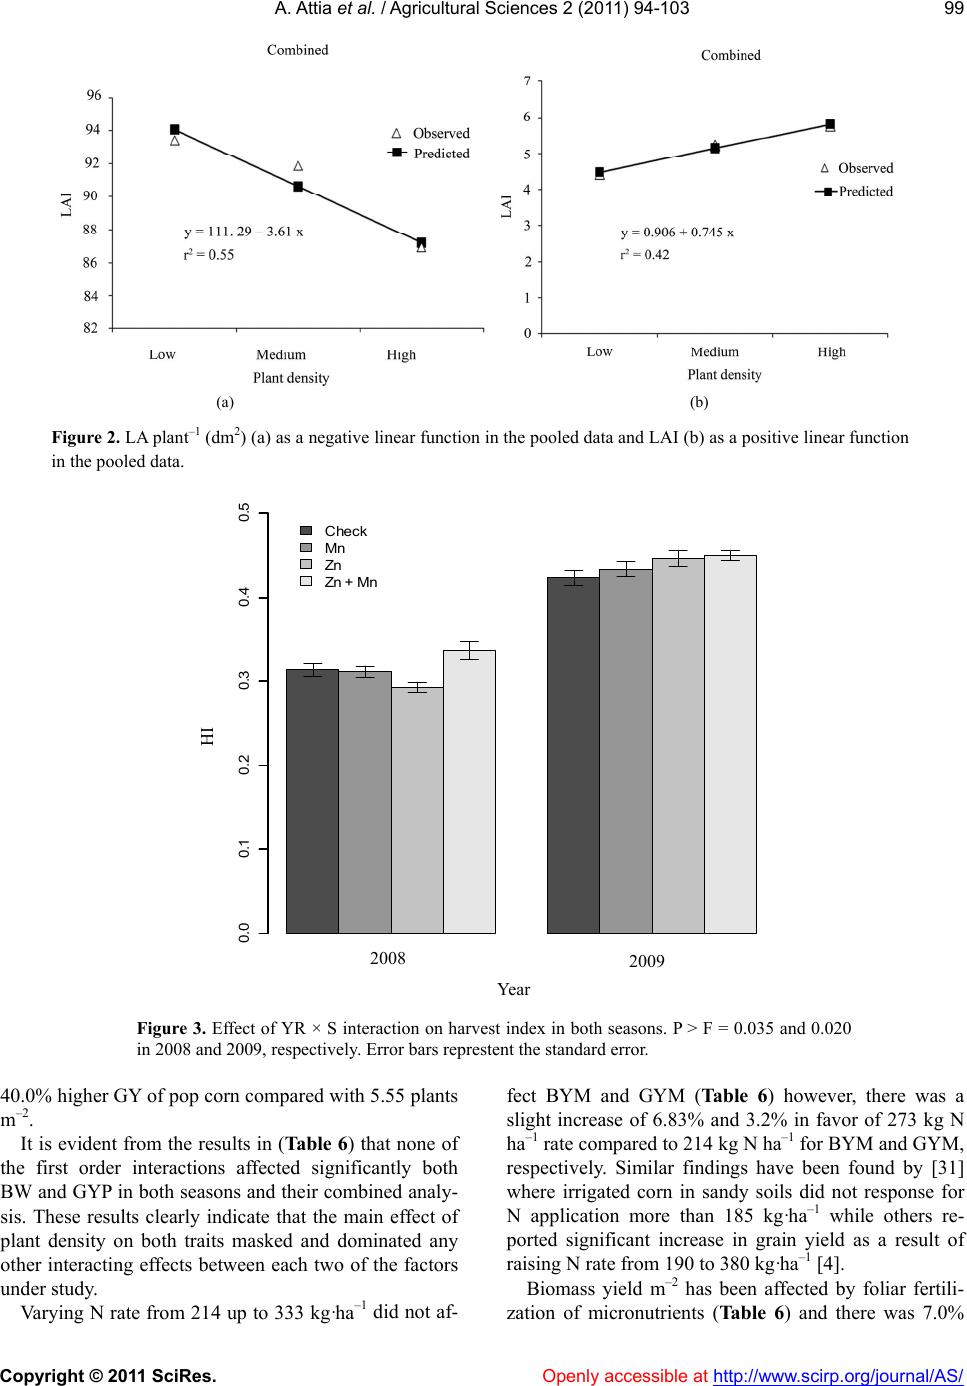
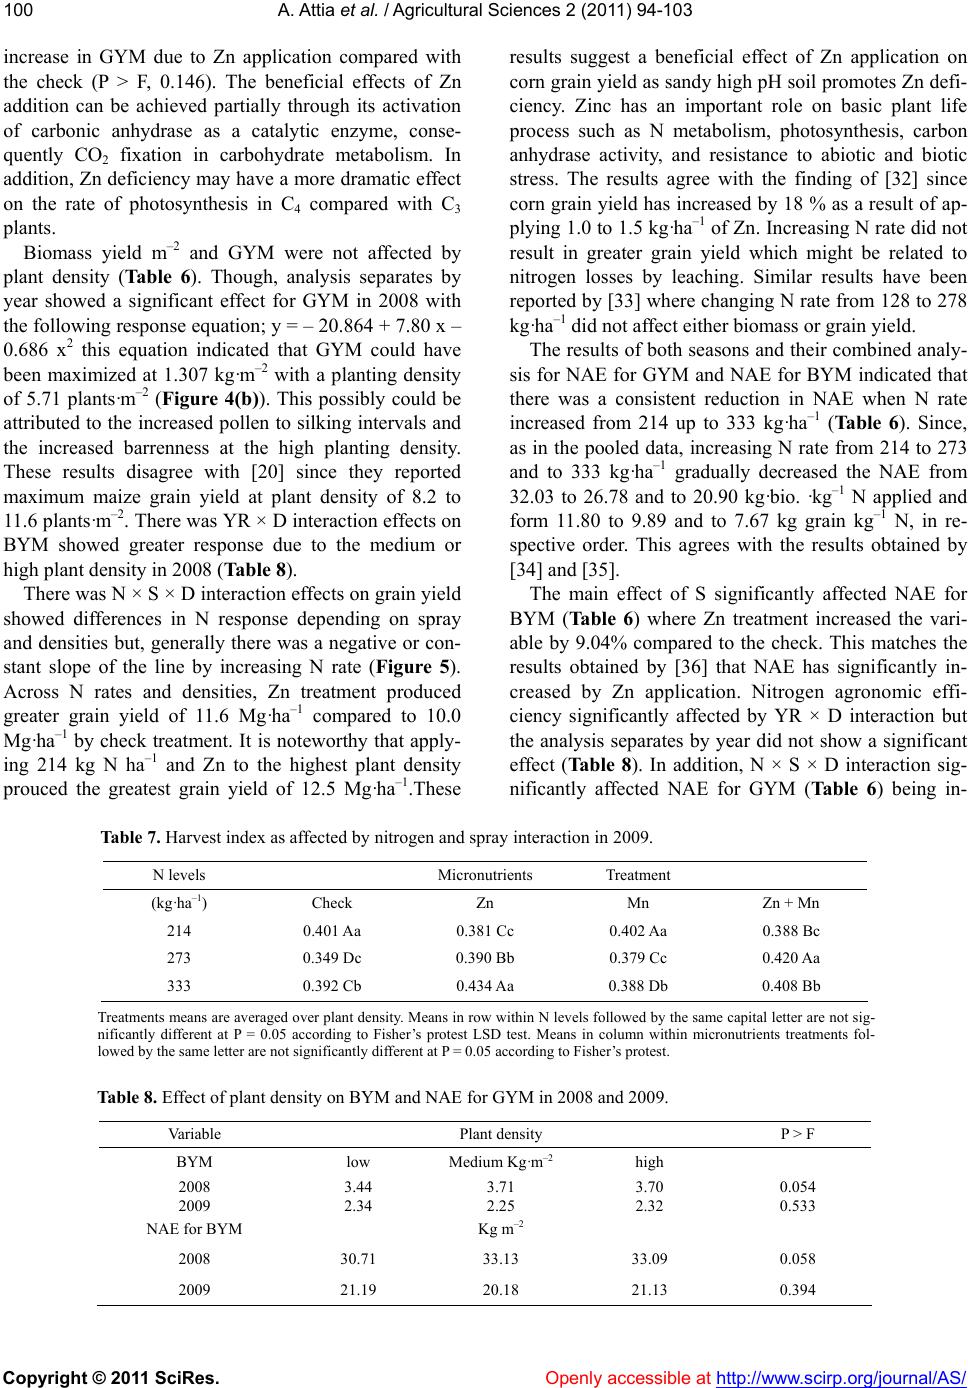
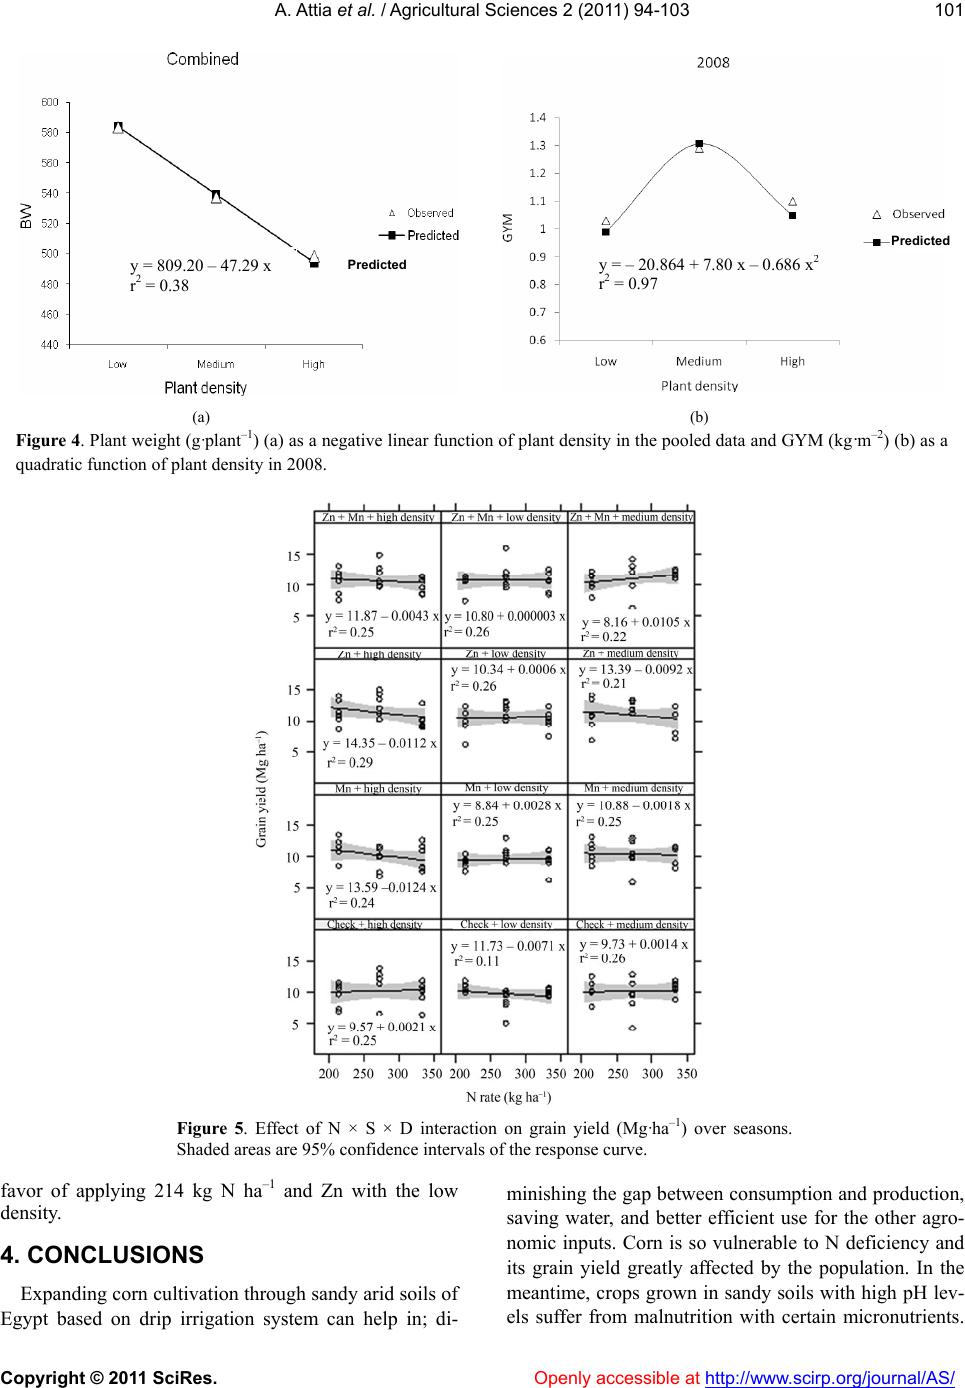
A. Attia et al. / Agricultural Sciences 2 (2 011) 94-103
Copyright © 2011 SciRes. Openly accessible at http://www.scirp.org/journal/AS/
102
Accordingly, these three agronomic aspects are of prior-
ity for studying.
The results of this study showed a maximum yield re-
sponse for N application up to 214 kg·ha–1 since there
was no significant effect due to any extra addition of N
on all the studied traits, except for both NAE traits
which gradually reduced as the N rate increased.
Co-application of the lowest fertigated N rate with Zn to
the highest plant density produced the greatest grain
yield of 14.4 Mg·ha–1, along with irrig ation frequency as
described in the material. Thus, splitting 214 kg N ha–1
considers the best rate and there is no need for further
addition of N under the study conditio ns especially when
it could result in ground water contamination by nitrate
N [37].
Micronutrients spray significantly affected BW, BYM,
NAE for BYM, and GYM in favor of Zn treatment
without response for the rest of the study characteristics.
Most of the study parameters have been affected by in-
creasing the plant density from 4.76 to 6.66 plant·m–2
except biomass and grain yield per m2 which may indi-
cate that a higher plant density might produce more
biomass and grain yield per unit area. These results arise
that more investigation is required in order to fully un-
derstanding the interaction between production factors
and optimum plant density for maximizing corn biomass
and grain yield under sandy so il conditions.
REFERENCES
[1] Ayars, J.E., Phene, C.J., Hutmacher, R.B., Davis, K.R.,
Schoneman, R.A., Vail, S.S. and Mead, R.M. (1999)
Subsurface drip irrigation of row crops: A review of 15
years of research at the Water Management Research
Laboratory. Agricultural Wa ter Managemen t, 42, 1-27.
doi:10.1016/S0378-3774(99)00025-6
[2] Shepherd, M.A. and Bennett, G. (1998) Nutrients leach-
ing losses from a sandy soil in lysimeter. Communica-
tions in Soil Science and Plant Analysis, 29, 931-946.
doi:10.1080/00103629809369997
[3] Haynes, R.J. (1985) Principles of fertilizers use for
trickle irrigated crops. Fert Research, 6, 235-255.
doi:10.1007/BF01048798
[4] El-Hendawy, S.E., Hokam, E.M. and Schmidhalter, U.
(2008) Drip irrigation frequency: The effects and their
interaction with nitrogen fertilization on sandy soil water
distribution, maize yield and water use efficiency under
Egyptian conditions. Journal of Agronomy and Crop
Science, 194, 180-192.
doi:10.1111/j.1439-037X.2008.00304.x
[5] Lamm, F.R., Trooien, T.P., Manges, L., Madani, H. and
Sunderman, H.D. (2001) Nitrogen fertilization for sub-
surface drip irrigated corn. Transactions of the ASAE, 44,
530-542.
[6] Halvorson, A.D. and Reule, C.A. (2006). Irrigated corn
and soybean response to nitrogen under no-till northern
Colorado. Agronomy Journal, 98, 1367-1374.
[7] Asadi, M.E., Clemente, R.S., Gupta, A.D., Loof, R. and
Hansen, G.K. (2002) Impacts of fertigation via sprinkler
irrigation on nitrate leaching and corn yield in an acid-
sulphate soil in Thailand. Agricultural Water Manage-
ment, 52, 197-213.
[8] Kargbo, C.S. (1985) Effect of plant reproductive stage
and rates of foliar fertilizer sprays on corn yield and yield
components. Zeitschrift fur Acker und pflanzenbau, 155,
268-273.
[9] Abdul-Galil, A.A., Ghanem, S.A., Zeiton O.A. and
Moselhy, M.M. (1990) Effect of planting density and
foliar N fertilization on yield of maize. Proceedings of
the 4th Conference Agron, Cairo, 1, 405-417.
[10] Kabata-Pendias, A. and Pendias, H. (1999) Biogeochem-
istry of Trace Elements. PWN, Warsaw, Poland, 398.
[11] Hefni, E.H.M., El-Hosary, A.A., Salwan, M.I.M. and
El-Sabbagh, A. (1993) Effect of soil moisture stress and
foliar application of Zn on some maize varieties. Annals
of Agricultural Science, Moshtohor, 31, 1811-1822.
[12] Badr, S.K.A. (1999) Effect of some preceding winter
crops and application time and yield components of yel-
low maize in sandy soil. Minufiya Journal Of Agricul-
tural Research, 24, 895-909.
[13] Bakry, M.A., Soliman, Y.R. and Moussa, S.A. (2009)
Importance of micronutrients, organic manure and bio-
fertilizer for improving maize yield and its components
grown in desert sandy soils. Research Journal of Agri-
culture and Biological Sciences, 5, 16-23.
[14] Sajedi, N.A., Ardakani, M.R., Naderi, A., Madani, H. and
Boojar, M.M.A. (2009) Response of Maize to Nutrients
Foliar Application Under Water Deficit Stress Conditions.
Research Journal of Agriculture and Biological Sciences,
4, 242-248. doi:10.3844/ajabssp.2009.242.248
[15] El-Bana, A.Y.A. and Gomaa, M.A. (1994) Response of
maize to time of nitrogen application and some micro-
elements under sandy soil conditions. Zagazig Journal of
Agriculture Research, 21, 1029-1040
[16] Schulte, E.E. (2004) Understanding plant nutrients, soil
and applied Zn. http://learningstore.uwex.edu/Assets/pdf
s/A2528.pdf.
[17] Tollenaar, M. and Aguilera, A. (1992) Radiation use effi-
ciency of an old and a new maize hybrid. Agronomy
Journal, 84, 536-541.
[18] Greish, M.H. and Yakout, G.M. (2001) Effect of plant
population density and nitrogen fertilization on yield and
yield components of some white and yellow maize hy-
brids under drip irrigation system in sandy soil. Pro-
ceeding of the International Conference on Plant Nutri-
tion—Food Security and Sustainability of Agro—Eco-
systems, Madrid, 810-811.
[19] Al-Kaisi, M.M. and Yin, X. (2003) Effects of nitrogen
rate, irrigation rate, and plant population on corn yield
and water use efficiency. Agronomy Journal, 95 , 1475-
1482.
[20] Porter, P., Hicks, D., Lueschen, W., Ford, J., Warnes, D.
and Hoverstad, T. (1997) Corn response to row width and
plant population in the northern Corn Belt. Journal of
Production Agriculture, 10, 293–300.
[21] Soil Survey Staff (1996) Keys to Soil Taxonomy. 7th
Edition, USDA Natural Resource Con-servation Service,
Washington DC, 644.