Technology and Investment
Vol. 4 No. 1 (2013) , Article ID: 28076 , 15 pages DOI:10.4236/ti.2013.41005
Structural Holes and Banner-Ad Click-Throughs
1Tepper School of Business, Carnegie Mellon University, Pittsburgh, USA
2Williams College of Business, Xavier University, Cincinnati, USA
Email: *starling@andrew.cmu.edu, chintar@xavier.edu
Received September 12, 2012; revised October 17, 2012; accepted October 25, 2012
Keywords: Online Advertising; Social Network Analysis; Social Capital; Social Networking; Twitter, Social Media; Banner Advertisements; Click-Through
ABSTRACT
This paper examines the impact of social capital on advertising performance in an online social network. Specifically, we show that a widely-employed measure of social capital—network constraint—explains variation in the number of click-throughs received by 5986 banner advertisements appearing on 25 Twitter-related websites. As predicted, banner advertisements receive significantly more clicks when placed on websites that bridge structural holes, i.e. bridge otherwise disconnected segments of the network.
1. Introduction
Successful advertising models for online social networks are proving elusive [1]. Last year Google co-founder Sergey Brin expressed some disappointment with the pace and performance of his firm’s social network advertising efforts.
“In general, it’s been improving but we still have a long way to go,” Brin told reporters… Brin said it would take time to find the best formula to develop the social networking advertising business, to develop the right technology and to educate advertisers and users. “People are expecting overnight to wake up to a miracle... but these things take time,” he added.
Google’s misery has company. The BBC recently described in highly unflattering terms the lackluster efforts and financial performance of popular social networking services Twitter and Facebook [2].
It remains the elephant in the room. Or, more to the point, the “fail whale” in the room. Just how are social networks, with their millions upon millions of users, going to make money? The profits should be rolling in: Twitter, which has been catapulted into the public-eye thanks to Stephen Fry and Barack Obama, is currently surviving on multi-million dollar handouts. And Facebook, the global force in social networking, has yet to harness its huge user base to bring in any significant revenue. Many believe answer (sic) may lie in advertising.
Twitter [3] recently explained its lack of progress in a post to its blog entitled “Does Twitter Hate Advertising?”
The idea of taking money to run traditional banner ads on Twitter.com has always been low on our list of interesting ways to generate revenue. However, facilitating connections between businesses and individuals in meaningful and relevant ways is compelling. We’re going to leave the door open for exploration in this area. Do we hate advertising? Of course not. It’s a huge industry filled with creativity and inspiration. There’s also room for new innovation in advertising, marketing, and public relations and Twitter is already part of that.
Ad agencies and industry executives aren’t faring any better. According to a recent KPMG-OnMedia survey of over 300 marketing executives, while the two most influential forces on the media industry were deemed to be social networking and online advertising, some “91% percent say advertisers have not figured out how social networking fits into their marketing mix” [4]. In early 2009, a panel of CEOs from social media start-ups participated in an OnMedia session entitled “Report Card: Advertising Meets Social Networks”. The majority had less than encouraging answers for the question “Have ads shown traction on major social networks and if not, how can they be optimized?” [5].
To date the supply of scholarly research on how to “crack the code of social network advertising” falls far below demand by industry professionals [6]. Only within the last twelve months have published empirical studies begun to appear that explicitly examine revenue models for social networking sites [7] or that apply the concepts and methods of social network analysis to the study of interactive marketing and advertising [8]. However, none of these studies directly address whether and how position and function in an online social network impacts measures of advertising effectiveness. In short, while the interactive aspects have been examined exhaustively, the networked nature of internet advertising has attracted little or no formal attention from scholars. This paper addresses that gap in the literature. Specifically, we show how and why one widely-employed measure of social network structure—network constraint [9]—explains variation in click-throughs on banner advertisements appearing on twenty-five “25” linked websites.
The remainder of this paper is organized as follows. In the next section we summarize the basic conceptual vocabulary and methods of social network analysis and then review the relevant literature relating network structure to organizational performance. We then link that review to the relevant literature on online advertising performance, especially that concerned with click-throughs on banner advertisements. Next we describe the data sample and research methods employed in this study and follow with a description of the results of the data analysis. We conclude the paper with a discussion of the implications of the results and with suggestions for future research.
2. Social Network Analysis: An Overview
Simply stated, social network analysis involves defining the structure of relationships or ties among a set of actors or nodes. Those actors may include “individuals within groups, teams, and organizations, organizations and firms themselves, computers and web sites, members of online communities, etc.” [10]. Ties occurring between pairs of actors are typically displayed either as an adjacency matrix where a “1” indicates a tie (Table 1) or as a network graph constructed from the matrix (Figure 1).
Social network analysis has been applied to a wide variety of academic fields and settings. Chief among them are the social sciences where it is frequently used in studies of individual, group/team and organizational performance [9]; the information sciences, most notably in studies of the interdisciplinarity of academic journals
Table 1. Generic adjacency matrix for six nodes.
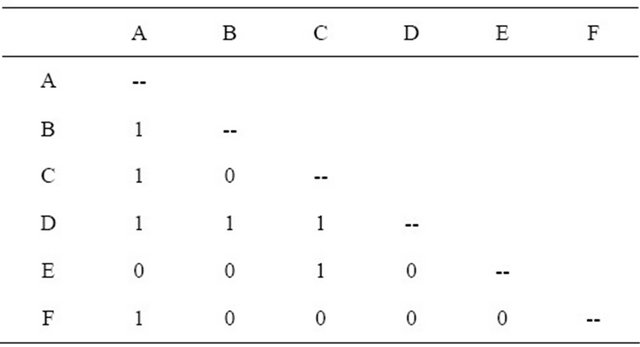
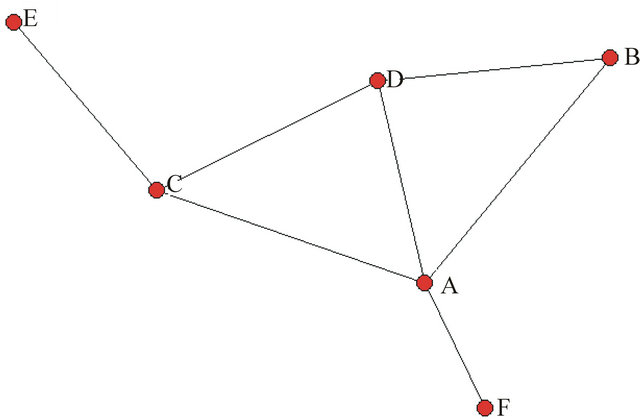
Figure 1. Network graph of the generic adjacency matrix.
[11]; criminology, particularly the analysis of terrorist, gang, and extremist activity [12]; and artificial intelligence, including the study of distributed expertise [13] and computer-supported learning [14]. The common thread among these studies is the quantification of the ties among actors/nodes and of the consequences of those ties on measures of performance [15].
This does not mean that the social network approach dismisses explanations for performance that emphasize the attributes of the actors or nodes—far from it. For example, while human capital theories might resort to individual characteristics to explain differences in the performance of a group of managers or scientists—some individuals are, after all, “more able… more intelligent, more attractive, more articulate, more skilled”—the social network argument treats social structure as “a kind of capital that can create for certain individuals and groups a competitive advantage in pursuing their ends”. In short, “better connected people enjoy higher returns” [16].
Not surprisingly, debate has arisen concerning the definition of “better connected” and the mechanisms by which social structure confers an advantage. Burt defines two distinct but related ways in which actors may be better connected. He terms them “brokerage” and “closure”. The “closure argument is that social capital is created by a network of strongly interconnected elements” while the “structural hole argument is that social capital is created by a network in which people broker connections between otherwise disconnected segments” [16].
In both cases the management of information flows in the network is mechanism by which advantage is achieved. Brokers, i.e. those who bridge structural holes, are advantaged by their “position in the social structure” in three distinct ways. First, because they are in contact with numerous distinct and disconnected groups, brokers have access to a wider variety of, and thus less redundant, information. Secondly, brokers have earlier access to this less redundant, more diverse information. Being stationed at the intersection of the information flow between groups permits brokers to be among the first to learn about the activities and interests of the different groups. Finally, brokers have some influence on information diffusion between the groups that they bridge. They are “more likely to know when it would be rewarding to bring together separate groups” and thus have “disproportionate say in whose interests are served when the contacts come together” [16].
The closure argument relies also on information flows, but the mechanism is different. Just like peer groups and gossip networks, a dense pattern of connections means that the behavior of each node is observed by most members and reported on to all other members. Such a structure increases the odds of an actor “being caught and punished for displaying belief or behavior inconsistent with preferences” of other members. As such, social capital in closed networks accrues from its ability to decrease variation in group behavior and to reinforce the status quo. But this should not be understood in a negative light. The cohesion, trust, and collaboration of closed networks are a precondition to realizing the value of brokerage: effective brokerage must occur between two or more groups whose members are well integrated and closely linked. Closure is, then, “a complement to brokerage such that the two together define social capital in a general way in terms of closure within a group and brokerage beyond the group” [17].
Despite the complementary nature of brokerage and closure, their consequences for performance are not equivalent. Burt’s [18] review of research on social networks and social capital in organizations concluded that “closed networks—more specifically, networks of densely interconnected contacts—are systematically associated with substandard performance. For individuals and groups, networks that span structural holes are associated with creativity and innovation, positive evaluations, early promotion, high compensation, and profits” [16]. Since Burt’s review several studies have reported a positive relationship between brokerage and the performance of individual managers [19], groups and teams [20], firms [21], and industries [22,23].
The benefits of brokerage have also been found in non-managerial settings and with non-economic measures of performance. Four recent studies in particular—two of citation patterns and two of online social networks—are especially relevant to this study. Oh, Choi, and Kim’s analysis of citation patterns in the management information systems field reported that “knowledge capital derived from a network rich in structural holes has a positive influence on an individual researcher’s academic performance” [24]. In their study of highly creative scientists in the field of nano-technology, Heinze and Bauer found that “scientists who effectively broker otherwise disconnected colleagues receive higher citation scores” [25]. Ganley and Lampe analyzed Slashdot, a technology-related news website which permits users to “declare relationships with other users” and which contains “Karma”, a peer reputation and ranking system. They found “the bridging of structural holes (to be) strongly related to the status of participants in the beginning and middle part of their Karma-building experience” [26]. Finally, Okoli and Oh found brokerage among participants in Wikipedia’s open content encyclopedia community to be positively associated with “recognition-based performance”, i.e. “the formal status accorded in the community” [27].
While there are ample studies showing brokerage to be associated with superior performance in organizational, strategic, and knowledge-based contexts, the role of social capital in relation to online advertising has not been empirically investigated. In the next section we review relevant literature on the effectiveness of web banner advertising and argue for a hypothesis that accommodates the potential contribution of the social network perspective.
3. Literature Review & Hypothesis
The rate and the number of click-throughs on web banners have been extensively studied in the last fifteen years [28,29]. Several cognitive, affective, and behavioral antecedents and covariates have been identified in the literature. They include brand recall and recognition [30-32], attitude toward the brand [33], and purchase intention [34,35]. Independent variables in these studies include characteristics of the banner ad itself, e.g. the type of appeal [36], and the information content of the ad copy [37], the use of animation, sound, or motion [38,39], as well as the banner’s size [40,41], design [42], location [43], visual complexity [44] and color scheme [45].
The predominant methodology in the above studies is experimental and, as such, has focused on attributes of the advertisement itself, the site upon which it appears, and/or the individuals who them both. As we expect, the social or networked context within which banner advertising takes place is excluded from consideration. Specifically, little or no attention has been given to the roles, relationships, or interdependencies among websites where advertisements appear. There is, however, one fairly recent case study whose results can be interpreted in this light.
Sherman and Deighton describe the case of one online retailer, drugstore.com, and how it improved response rates to its banner advertisements by tracking frequent visitors to its website. Using data obtained by cookies placed on visitors’ computers, drugstore.com identified 100 “high affinity” websites, i.e. sites whose visitors had “a disproportionate propensity to visit drugstore.com” [46, page 63]. Banner adverts for drugstore.com were then placed on the high-affinity sites and the results were compared with results for low-affinity sites. As predicted, the high affinity sites produced better results. In particular, the conversion rate (purchase per impression) on high-affinity sites was 900% higher than low-affinity sites. Additionally, without optimization the high affinity sites produced a cost-per-action that was “close to that achieved by drugstore.com’s long-term partner sites such as Yahoo! and AOL after a year of continual optimization” [ibid, page 64]. Further it was reported that the top 5 affinity sites had a cost-per-advertisement 27% lower than the rate for the Yahoo! and AOL partnerships. Finally, it was noted that one “genre” of high affinity sites “delivered 43% of all orders using only 32% of the total budget” [ibid, page 64]. Although click-through rates for the experiment were not provided, it can be reasonably inferred from the above that they were vastly improved, as well.
The results of Sherman & Deighton can understood from the perspective of social network analysis, as well. First and foremost the 100 affinities or publishers of drugstore.com would be treated as a network of linked and interdependent nodes, not as 100 isolated websites. Their social structure could have been determined from any number of pre-existing relationships—buyer-supplier, advertiser-publisher, joint venture or strategic alliance partnerships. Further, their top managers may have attended the same business schools, sat on the same boards of directors, or previously worked for the same employers or at the same start-ups. Additionally, measure of structure could have been constructed with data obtained from “cookies” placed on the computers of the frequent visitors. The number of visits to affinities, the time spent on them, the number of pages viewed, participation in discussion forums on the sites, the order or path by which the sites were visited, and the pattern of hyperlinks among them—any of these could provide the basis for treating the affinities as a network.
Once a basis for social structure was settled upon, it would be left to determine whether social capital is created in the network of drugstore.com’s affinities through brokerage or through closure. The prediction based on the prior literature would be that brokers, i.e. affinities that bridged gaps between otherwise disconnected groups of affinities, would have higher performance than closers, i.e. affinities that were central to tightly connected groups of other affinities. Performance could have been measured in several ways including purchase-per-impression, cost-per-action, and cost-per-advertisement, clickthrough rate, as well as measures of communication effectiveness like brand recall and recognition or attitude toward the brand.
In light of the prior research that finds brokerage associated with higher financial and reputational performance, we expect that in a social network formed by hyperlinked websites, brokerage will be positively associated with performance. Specifically, we predict that all else equal, banner advertisements appearing on websites that broker gaps in its social network will receive more clicks than ads placed on more constrained websites.
4. Data & Methods
We tested the above hypothesis with a data set collected from Austin, Texas-based FeaturedUsers.com (hereafter FeaturedUsers) a “Twitter application ad network” serving banner advertisements to 25 Twitter-related websites and portals. Membership in the network is limited to developers of applications making use of the Twitter API. Prospective members have to complete a detailed “publisher registration form” before being allowed to host banner ads served by FeaturedUsers. They are also required to maintain a minimum click-through rate which is not specified. Publishers are allowed to vary the ads according to orientation and size and to determine where on the page the ad will appear.
The advertisers are Twitter users who are looking to gain a greater number of followers. Another motivations given by FeaturedUsers as to why Twitter users might want to advertise on its networks includes the chance to “support Twitter app(lication) developers and gain brand exposure” [47]. Viewers who click on the banner are taken directly to the user’s personalized Twitter home page where they are invited to become a follower. These Twitter pages display the user’s 20 most recent updates along with links to other websites operated by the user. Figure 2 contains screen captures of four typical banner advertisements.
FeaturedUsers employs a cost-per-impression pricing model. Advertisers pay $10 for 1000 impressions (CPM = $10). They receive 90 additional impressions for purchases in increments of 3000 impressions (CPM = $9.71) and another 500 for purchases of 10,000 or more (CPM = $9.52). FeaturedUsers shares advertising revenue with publishers but does not make public what the percentage is, stating only that the amount is “extremely competitive” relative to other ad networks [47].
All data used in this study was collected in mid-June 2009 on 350 completed and in-progress advertising campaigns. The “Bio” segment of the ads is limited to 140 characters—just like the updates in the Twitter service itself—and can be placed into three categories: individuals promoting themselves; individuals promoting their businesses, products, and services; and businesses or organizations promoting the same. In the first category are Twitter users like “antno 38” whose ad copy reads like a personal description for a dating service—“Anthony. Separated. Sometimes Lonely. Sometimes Crowded. I rant I rave. Father. Blogger. Tells bad jokes in French. Has a Grip on reality.” So too does the ad copy from “binhog 737” which reads “SWA flight attendant— I love sushi, wine, Deadliest Catch TV Show, and cheese. I support our troops and law enforcement. Proud Army

Figure 2. Screen shots of four “4” FeaturedUsers banner advertisements.
sister!!!”
The second category contains a number of self-described entrepreneurs. Their ads often read like a combination resume and elevator pitch:
• “Finer 9”—Internet Entrepreneur, CTO, Google Ad Professional, Penn State MBA, Microcap Trader, Inventor, Hacker, BizDev Consultant: Need more revenue?
• “DaveDinwiddie”—Serial Entrepreneur, Student of New Media, Loving Husband, RE Investor & Developer... always looking at new opportunities... have one to share?
• “JodyGlidden”—Entrepreneur from Chalk, icGlobal, Scholars. Ruby/Rails Enthusiast. Canadian living in US. Seed investor.
• “BruceColwin”—Founder of Two Degrees Strategy & Development, a business development resource for early-stage technology companies.
There are also a number of self-described CEOs, consultants, and small business owners in this group:
• “FranchiseWhale”—Chad Harris CEO No Insurance Club. Franchise and Marketing Fanatic. Healthcare entrepreneur, Dad, reader, traveler, other ventures in Africa, Mexico and online.
• “MissSalon”—CEO Miss Salon™ | a nail bar and salon business consultancy... Hire us to help you or use our excellent step-by-step guide!
• “TxElderCare”—Owner/Founder of Elder Options of Texas, an Internet site of products and services for adults 55+ and their elder loved ones.
• “Drcarolynmiller”—The YOU CAN Psychologist! I’m a Christian, therapist, coach, consultant, speaker & writer! Love helping people change circumstances & turn dreams into reality.
In the latter category are ads which mention no one individual in particular, only a business, product, or service:
• “HisNibs1”—Fountain pens, ink and writing instruments from around the world
• “Microbilt”—MicroBilt is your one stop shop for making credit decisions, running background checks, collecting on past due accounts and protecting your company from fraud.
• “Milleniumlimo”—South Florida largest exotic limousine service. Number one choice for wedding planners. www.milleniumlimo.com.
• “Topdawg1”—Dog Clothier serving the USA from East TN-Fashion-Style-Affordability-Dog duds done dirt cheap. Dog clothing cheap, not cheap dog clothing Dress ur dog for less.
Dependent Variable. The number of clicks received by an ad in a given domain was taken as the dependent measure. Click-through data was obtained directly from the FeaturedUsers website. For every advertising campaign we obtained a listing of the date and time of every click a banner received on each domain, along with the total number impressions on that domain.
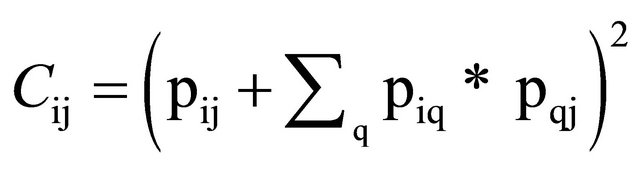
Independent Variable. The main theoretical variable was network constraint, “the extent to which a network is directly or indirectly concentrated in a single contact” (Burt, 2001, page 39). Network constraint on a node is high when it has few links to other nodes, those nodes are densely connected, and/or the nodes are indirectly connected to the same central node. The formula is given by Equation (1) below for q not equal to i,j and where pij is the proportion of i’s relations that are invested in contact j.
 (1)
(1)
The total appearing in the parentheses is, then, the proportion of i’s relations that are invested in connection with contact j. Network constraint is given by the sum of squared proportions, i.e. jcij. The direction of the relationship between performance and network constraint is crucial to determining which type of social capital prevails—brokerage or closure. In short, if the spanning of structural holes is the source of social capital, then performance will be negatively associated with constraint. If, however, social capital is derived from closure, then performance will increase with constraint (Burt, 2001). Because we hypothesize that returns to brokerage are positive, then we expect that the relationship between constraint and performance to be negative.
In this study, a linkage between two websites in the FeaturedUsers network was said to exist if one or both of the following conditions existed—1) one website in the network contained a hyperlink to another website in the network or 2) a Twitter account associated with the website or application developer in the network was listed as a “follower” of the Twitter account associated with the website or application developer. We used UCINet Version 6.221 [48] to calculate network constraint from the adjacency matrix formed by the 25 publishers in the FeaturedUsers advertising network: AwesomevsAwesome.com, Cheaptweet.com, DoesFollow. com, Followcost.com, Friendorfollow.com, Hashtags.org, Retweetrank.com, Secrettweet.com, TheTwitterTagProject.com, Tweepdiff.com, Tweetchat.com, Tweetfan.com, Tweetgrid.com, Tweetknot.com, Tweetreach.com, Tweetstats.com, TweetTop.com, Twibes.com, Twipstream. com, Twitdom.com, TwitterSticker.com, Twrivia.com, Twtbase.com, WhoShouldIFollow.com, and Wthashtag. com.
Control Variables. Several factors may influence the number of clicks on web banners. Thus, we developed a negative binomial regression model that included several variables, each of which was shown by prior research to have an effect on click-throughs and/or related measures such as advertising prices and communication effectiveness.
The number of impressions. The number of clicks on an advertisement is necessarily a function of the number of impressions it receives [49,50]. Obviously, the number of clicks must be less than or equal to the number of impressions. Typically the relationship is expressed as a percentage known as a click-through rate (CTR) and reported CTR are frequently under 1% [40]. FeaturedUsers counts one impression as having been “generated every time a user views a page displaying a Featured User’s banner” [47]. Click counts values range from a low zero to a high of 282 and impressions from a low of 1 to a high of 56,265. To reduce the influence of outliers, the natural log of the number impressions was used in subsequent analyses.
Banner size. The size of a banner ad has been shown to affect both click-through rates [29,31,40,50,51], as well as brand recall [52]. Because the dimensions of banner advertisements vary across the 25 member websites, we operationalize size with two variables—the number of pixels of the banner’s width and of its height. As with the number of impressions, the natural log of both measures was used in the negative binomial regression model specified below.
Banner location. A banner advertisement’s location has been shown to influence click-throughs [49,53], as well as brand recognition [37], recall [54], pre-attentive processing [43], and the level of attention given to content and advertisement areas of a web page. [55,56] The latter study recommended specifically that “web advertising located in the earlier and later stages of a (browsing) path should be priced higher than advertising in the middle phases because during these two phases the audience is more sensitive to peripheral advertising” [56, page 1404]. FeaturedUsers requires that all publishers place banners ads “above the fold” which they define as “the top 768 pixels” [57]. Within that range ads were placed in different locations on the page. As such, we operationalize location with two measures—the distance in pixels downward and rightward from the upper left corner of the page to the upper left hand corner of the banner. As above, the natural log of these two dimensions was used in the regression. Finally, because the banners could be placed on the front page, on subdomains, or on any other page on the site, a dummy variable was coded “1” for advertisements appearing only on the main page and “0” otherwise.
Banner format and style. Click-throughs are strongly influenced by the format and style of the advertisement. Sigel, Braun, and Sena found that leaderboards, i.e. wide but shallow banners placed at the top of a page, received higher click-through rates than either rectangular banners (320 × 250 pixels) or wide skyscrapers (160 × 600 pixels). [40] Burns and Lutz report that standard banners had higher a click-through rate and frequency than five other ad formats—pop-ups, skyscrapers, large rectangle, floating, and interstitials, i.e. ads placed between the current and the destination page [58, page 60]. Several websites in the FeaturedUsers network presented advertisements without borders, typically against a white background. This had the effect of lessening the distinction between the ad copy and the page content. Thus, a dummy variable named “Border” was created and coded one “1” if the banner was borderless and zero “0” otherwise.
Ad copy. Characteristics of the ad copy that have been shown to positively influence click-throughs include message length [53], the presence of incentives [36,59,60] and the use of affective appeals [59]. Accordingly, we created three variables. The natural log of the number of characters in the ad copy was taken as the measure of the message length. Ads containing a promise to become a follower of any Twitter user who first follows them were coded “1” and “0” otherwise. Finally, the proxy for emotional appeal was a dummy variable coded “1” if the banner contained a photo of an unaccompanied female and zero otherwise [61-63].
Finally, because FeaturedUsers reduces or in some cases eliminates websites from the network due to poor click-through performance, we also control for the natural log of the number of advertising campaigns in which a given website was involved. The expectation is that click-throughs are higher for websites involved in the most campaigns. Table 2 presents mean, standard deviation, and the minimum and maximum values for the dependent, independent, and all control variables. Table 3 contains the correlation matrix for the same variables.
5. Results
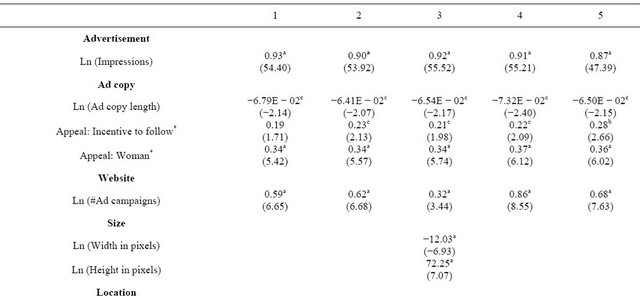
Table 4 presents the results of five negative binomial regressions used to test the hypothesis. The dependent variable in all models is the number of clicks a web banner received during its entire campaign at a member website. Four advertisement-specific and one website-specific variables are controlled in every model:
1) The natural log of the number of impressions received by the advertisement;
2) The natural log of the number of characters in the advertising copy;
3) The presence of an incentive to reciprocate followership;
4) The presence of an unaccompanied female in the advertising photo or logo;
5) The number of campaigns in which a website was involved.
Three groups of control variables related to size, location, format and placement of the ad were included in Models 3, 4 and 5 respectively. Specifically, in Model 3 the two advertisement size measures were controlled—the natural log of the banner advertisement’s width and the natural log of its height, both measured in pixels. In Model 4 we control for the two advertisement location variables—the natural log of the distance, measured in pixels, from the left side of the page to the left side of the banner and the distance measured in pixels from the top of the page to the top of the banner. And in Model 5 are included controls for the advertisement style and placement, specifically the presence of a border around the advertisement and placement of an advertisement on the main page. Both are dummy variables.
The reason why all are not included has to do with the correlation between the theoretical variable, constraint, and several of the control variables. Constraint is a measure that varies across websites—each website in the network has a position in the social structure which is calculated independently of the characteristics of the advertisements which appear upon it. Several of the control variables vary across—but not within—each website. Specifically these are the six size, location, and style and placement variables. Including all six of them in the same model creates collinearity problems among them and biases estimates on the constraint. Thus, they are included only two at a time.
Control Variables. Model 1 establishes a baseline upon which all other models are compared. Three of the four control variables are statistically significant. The number of impressions is, of course, the most highly so (β = 0.93, z = 55.40, p < 0.001). The strength of thisrelationship confirms intuition, industry practice, and that
Table 2. Descriptive statistics (n = 5986).
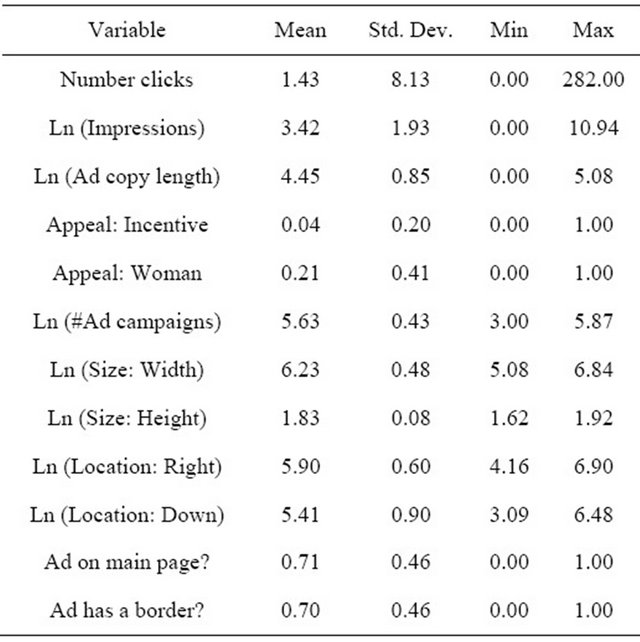
Table 3. Correlation matrix (n = 5986).

Legend: a = p < 0.001, b = p < 0.01, c = p < 0.05.
Table 4. Negative binomial regression of the number of click-throughs on constraint.

Legend: a = p < 0.001, b = p < 0.01, c = p < 0.05, two-tailed test.
an advertisement receives for advertising performance in general, and for click-throughs in particular. Moreover, the baseline model itself is highly significant as evidenced by the chi-squared statistic of 1642 for the difference between the “Full” and “Constant only” models. This value is far in excess 18.47, the critical value at the p < 0.001 level for models with four degrees of freedom.
The relationship between clicks and number of characters in the advertising copy is negative (β = −6.79 E − 02, z = −2.14, p < 0.05). This indicates that the shorter advertising copy the more clicks the advertisement received, a finding consistent with prior research [53]. As expected, the relationship between an incentive to reciprocate followership is positive though not significant (β = 0.19, z = 1.71, p > 0.05). The emotional appeal variable was positively and significantly related to the number of clicks (β = 0.34, z = 5.42, p < 0.001). Thus, advertisements with an unaccompanied woman received more clicks than ads with men, couples, pets, graphics, logos, etc. Finally, the number of advertising campaigns in which a website was involved is a positive and significant determinant of the number clicks on an ad (β = 0.59, z = 6.65, p < 0.001).
In Models 2 - 5 each of the variables that is significant remains so—and with the same p-values for the associated z-statistics. The one insignificant variable—incentive to follow—becomes significant at the 0.05-level in Models 2 - 4 and the 0.01-level in Model 5. Thus with one exception, all advertising-level control variables are statistically significant at the 0.05-level or better.
In Models 3 - 5, one of three pairs of website-level variables was added to the baseline model. In Model 3 both the natural log of the width and of the height of the banners are both significant predictors of the number of clicks on the ads, albeit in different directions. The former is negatively associated with the number of clicks (β = −12.03, z = −6.93, p < 0.001) while the latter is positively so (β = 72.25, z = 7.07, p < 0.001). Thus, the number of clicks decreases as ad became more narrow and increased as ads became grew in height. This suggests that standard rectangular and tall (“skyscraper”) banners outperformed leaderboards, i.e. wide but shallow banners placed across the top of the page.
Model 4 indicates that banner location also influences the dependent measure. Specifically, there is a significant and positive relationship between the number of clicks on an advertisement and its distance from the left side of the page (β = 0.49, z = 7.01, p < 0.001). No such relationship is found between clicks and the distance of the banner from the top of the page, however. Rather, the number of clicks declines as the location moves farther down the page, albeit marginally (β = 0.02, z = 0.60, p > 0.10). This result may explain FeaturedUsers’ requirement that all banners be displayed “above the fold” [57].
Model 5 indicates that both format/style and placement impact the click count. In particular, the presence of a border around a banner is negatively and significantly associated with the number of clicks on the banner (β = −0.59, z = −9.48, p < 0.001). The presentation of the banner on the main page, versus on content pages of the website is also associated with significantly lower numbers of clicks (β = −1.17, z = −6.02, p < 0.001).
Taken as a whole, the above results indicate ads receiving more clicks were ones that had a greater number of impressions, had fewer words in the ad copy, contained an offer to reciprocate followership, had a picture of an unaccompanied woman, was narrow and tall in terms of pixels, was placed to the right side of the page, did not have a border, and was found on a content pages as well as the front page.
Independent Variable. As predicted, constraint is significantly and negatively associated with the number of clicks-and quite strongly so (−1.77 < β < −1.27, −9.38 < z < −6.54, p < 0.001). In all four models the incremental improvement in the Log Likelihood χ2 is far above 10.83—the critical values for one degree of freedom at the p < 0.001 level. When we recall that the baseline model itself is highly significant and note that the addition of constraint adds significantly to that model, then it can be concluded that there is significant support for the hypothesis. Specifically, the significant and negative relationship between constraint and the number of clicks indicates that, as predicted, banner advertisements on websites that bridge structural holes receive more clicks—even when controlling for several other determinants of click-throughs, chief among them the number of impressions. In the Discussion section of this paper we offer an explanation as to why this is so and why it is important.
Sensitivity Analysis. In order to test the robustness of the coefficient estimates for the constraint, we re-ran Model 2 on twenty “20” sub-samples of the data. These sub-samples were created by dividing the data at the median for continuous variables—the number of impresssions, ad copy length, ad width, ad height, distance to the right, distance from the top—and into subsets of one or zero for the dummy variables—incentives, emotional appeal, main page, and border. Fifteen of the twenty tests had coefficients for constraint negatively associated with the number of clicks and at the same and significance level (p < 0.001). A sixteenth—using only ads with the followership incentive—showed a lower significance level for constraint (p < 0.05). Three other sub-samples—ad width below the median, ad height below the median, and ads with borders—all showed a negative but non-significant relationships (−1.15 < z < −0.36). Interestingly, there was one sub-sample—ads placed rightward as much or more than the median of 394 pixels—showed a highly significant and positive relationship between constraint and the number of clicks (β = 2.24, z = 9.34). Despite this anomalous result, the negative relationship between constraint and advertising prices is quite robust.
6. Discussion
The above results can be summarized succinctly: all else equal, a banner ad receives significantly more clicks if placed on a website that spans structural holes in its social network. That finding is both new and old. It is old in that it confirms the findings from the organizations and social networks literatures that brokerage is positively associated with performance. The finding is new primarily because of the phenomenon to which we applied extant theories of social capital—online advertising. That said, what matters most in studies of social networks and performance is the matter of mechanisms, i.e. the “how” and “why” that explain what has been found. In this study that end is best achieved through a detailed examination of the linkages between the nodes in the network. The FeaturedUsers ad network contains 25 sites—a number too large to permit every linkage to be described, let alone analyzed. However, there is much to be learned from examining the linkages among the five sites with the lowest constraint values—Twitdom, WhoShouldIFollow (WSIF), Hashtags.org (HDO) What the Hashtag (WTH), and Twtbase. Twenty-four of the 25 websites in the network is linked to at least one of these five.
Twtdom and Twtbase are directories containing links to, reviews and ratings of, and other information about several hundred Twitter-based web applications. HDO and WTH both track and categorize trends in “hashtags” created by Twitter users. Hashtags are created by adding a number sign or hash mark to a keyword, e.g. #finance. The former of these two sites—wthashtag.com—is more concerned with real time tracking while the latter describes itself as a “user-editable encyclopedia”. WSIF is a Twitter application that helps people find other “interesting people” to follow on Twitter by pointing them to other people “similar” to those that the person already follows. Thus, among the five least constrained sites are two searchable directories of applications created by Twitter developers, two searchable directories and trackers of topics and tags popular among Twitter users, and another searchable directory of the users themselves.
Below we consider the ego networks for three of these five websites, where an ego network is defined as the focal website, the websites to which it is directly connected, and the ties, if any, among the them [64]. This is done with the idea of determining what motivates the connections among the sites and what information is being exchanged or gained. Figure 3 below shows the ego network for Twtbase, a Twitter application directory, and the fifth least constrained site in the network. Constraint values appear in parentheses following the website name. Twtbase has links to 13 other websites, four of which are the other “directories”—WTH, HDO, WSIF, and Twitdom—the websites that are also that are fourth, third, second, and least constrained, respectively. The other nine sites to which it is linked are comprised of a service that provides tracking statistics and tag clouds of updates from individual Twitter users (Tweetstats), a Twitter-based trivia game (Twrivia), an application for posting bookmarked weblinks to a user’s Twitter page (Tweetalink), a topic, url, and hashtag tracking and statistics application (Tweetreach), a site where Twitter users can talk and brag about, as well as post photos of their favorite breakfast items (AwesomevsAwesome), a directory of Twitter users organized by topic area, e.g. fitness, stock trading, education, politics, etc. (Tweettop), a platform for creating and communicating with public and private “knots” or communities of Twitter users (Tweetknot), a suite of messaging and follower tracking applications (TheTwitterTagProject), and an application for determining the number of followers user has (FriendorFollow). These nine sites form three distinct clusters. In one cluster are Twettop and Tweetknot which connect only to Twtbase and not to each other. The second cluster is formed by Tweetreach, Tweetalink, Twrivia, and Tweetstats which form a chain-link, respectively. The third cluster is formed by three websites—Awesom-

Figure 3. Ego network for twtbase with network constraint scores.
evsAwesome, FriendorFollow, and TheTwitter-TagProject—which are linked in a triangular pattern. Twtbase is the bridge between these three otherwise disconnected segments of FeaturedUsers’ network. That is to say, it is a broker between the structural holes between these three clusters.
The ego network for the third least constrained network member, Hashtags.org (HDO) is shown in Figure 4 below. Its structure is quite similar to that for Twtbase. Specifically, it has links to 11 other sites, four of which are to the least constraint sites, i.e. Twtbase, WTH, WSIF, and Twitdom. It’s other seven links are to two sites that help a user determine which users follow one another (DoesFollow and FriendorFollow), one that indicates how much time is involved in following another user (FollowCost), a community building site (Twibes), a trivia game (Twrivia), a breakfast club (AwesomevsAwesome), and a service that creates sticky notes emblazoned with the text of a user’s recent Twitter updates (Twitter Sticker).
As with Twtbase, the graph shows clearly the brokerage role fulfilled by HDO. One cluster is formed by AwesomevsAwesome, FriendorFollow, and DoesFollow which are chain-linked. The second cluster is formed by four blogs which share no links to one another, only to HDO—Twibes, Twittersticker, FollowCost, and Twrivia. The third cluster is four directories—Twtbase, WSIF, WTH, and Twitdom.
Figure 5 contains the ego network of the second least constrained site, WhoShouldIFollow (WSIF), an application that analyzes a Twitter user’s profile and identifies other Twitter user’s with similar interests. WSIF has linkages to 11 other sites in the network, three of which are to other least constrained sites—Twtbase, Twitdom, and HDO. The other eight linkages are to a directory of Twitter applications and reviews (Tweetfan), a site through which anonymous updates can be posted to Twitter (SecretTweet), an application for posting bookmarked weblinks to a user’s Twitter page (Tweetalink), an site for posting advice and tips as updates (Twipstream), an application to compare the friends and followers of two Twitter users (Tweepdiff), tracking statistics and tag clouds for individual Twitter users (Tweetstats), an application for determining the number of followers and followings a user has (FriendorFollow), and a trivia game (Twrivia).
A familiar pattern emerges when the clusters of links in WSIF’s ego network are examined. Again we have three chain-linked websites—Twrivia, Tweetalink, and Tweetstats—a group of five disconnected websites, and a third cluster formed by the other four directories—WTH, WSIF, Twtbase, and Twitdom. Thus, WSIF fills the structural hole between these groups.
With the linkages of three of the least constrained sites
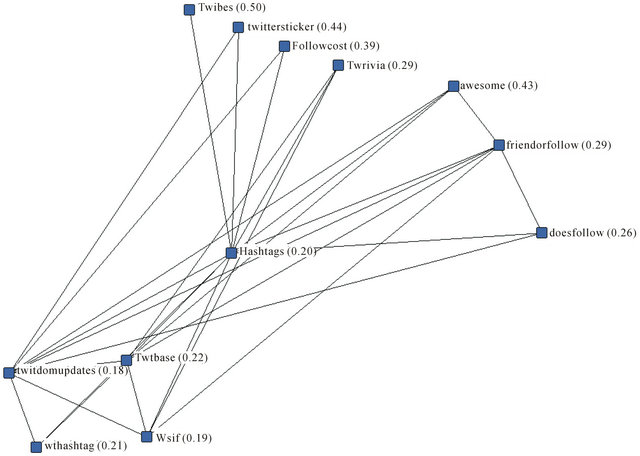
Figure 4. Ego network for hashtags.org with network constraint scores.

Figure 5. Ego network for whoshouldifollow.com with network constraint scores.
identified and described, the question arises as to why the linkages exist. As noted earlier, at the center of each of the above ego networks is site acting as a searchable database, tracker, or registry of Twitter applications, of Twitter conversation topics, and of Twitter users themselves. The large number and pattern of linkages to the applications registries—Twtbase and Twitdom—is probably explained by an information processing and search efficiency argument. Because all of the members of the network are application developers, whether amateur or professional, they have a strong incentive to get listed in, register with, and to follow the Twitter updates of the applications directories like Twtbase and Twitdom. Following updates is particularly important in this regard because it is from them that developers can readily learn about new applications which compete with or complement their own. Moreover, these registries are the place where Twitter users and enthusiasts—as distinguished from developers—will look for new and interesting applications that can increase their Twitter user experience and functionality. Lastly, these are all topics about which Twitter users also like to post updates and to share with fellow their followers.
The large number of links to the hashtag trackers—WTH and HDO—is probably motivated by similar concerns. While any Twitter user can create a hashtag just by adding a “#” to the front of any “tag” or contiguous string of letters and/or numbers, there is no easy way to determine how frequently that tag or meme has been used, by which Twitter users, or when. Linkages to sites like HDO and WTH from (to) Twitter-related sites would keep both parties informed and up-to-date about trends that would not be apparent from examining their own network. In a similar way we can explain linkages to WSIF. It is quite possible that WSIF obtains information for its evaluation and comparison of user profiles from these sites and others ones linked them.
Just as the function of the least constrained sites can be used to explain the pattern of linkages, it can also be used to explain variation in click-through rates across the advertising network. These five sites have an average constraint level of 0.20 and a CTR of 0.548% (903 clicks from 164799 impressions). By comparison, the five most constrained sites have an average constraint of 0.67 and a CTR of 0.103% (605 clicks from 585748 impressions). Thus with 72% fewer impressions the five least constrained sites achieved 49% more clicks—a better than five-fold difference. This ratio is comparable to the improvements earlier described for drugstore.com [46]. One variable that the present study did not take into the account was viewing mode, i.e. information seeking vs. surfing. Several studies have shown viewing mode’s positive influence on CTR by defining click-throughs as information seeking behavior [31,60,65,66]. Seen in this light, it follows that ads on the least constrained sites would have received more click-throughs: it is quite possible that a higher percentage of viewers on these five sites are in the information-seeking mode compared to visitors to other sites in the network. These five are, after all, directories, registries, and repositories of Twitter applications, Twitter users, and topics currently or recently of interest to the Twitter community. They are sites where Twitter developers make their applications known and available, where the developers look for complementary and competing applications; where early-adopting Twitter users look for new and useful applications; and where all of the above can learn about the most popular topics of discussion on Twitter as evidenced by hashtags.
Even without a viewer mode explanation for the results, this study’s central finding—that web banners on sites that bridge structural holes garner more click-throughs—has important implications for advertising with social networking sites like Twitter, Facebook, and MySpace. A key feature of these services is the structure of linkages that users have to other users in the network, linkages called “followers” or “friends” and from which network measures can be constructed. Future research should examine whether and to what degree measures like constraint, network density, and centrality influence click-throughs on ads or on other links on the webpages. But future studies need not be limited only to social networking services. Advertising performance an also be examined on corporate-owned and -operated social networks organized around specific products and services. So too can financial and advertising performance of the numerous start-ups in the social network advertising space, many of which are targeting Twitter users.
The opportunity that such studies present for both the theory and the practice should not be overlooked and must be stated clearly. Social structure and the position of a website within it are conceptually independent of attributes of the websites like impressions. It is very notable that the five least constrained sites had about 50% more click-throughs on about 72% fewer impressions. Impressions are the dominant model for pricing advertisement, as well as an extraordinarily strong predictor of click-throughs. But impressions do explain all of the variance. As this study shows, social structure matters as well. And if social network advertising is to be as successful as hoped for, it must take into account and take advantage of what makes social networking sites different than popular but asocial sites. Without taking social structure into account, advertising on Twitter or Facebook is no different than advertising on any other website where banner prices are set primarily by the number of impressions the banner will receive. The results of this study suggest that even though impressions exerts a powerful influence on click-throughs, the location of a website within its social network is also an important factor—and the more social the web becomes, the important social structure stands to factor into advertising performance therein.
REFERENCES
- Interactive Advertising Bureau, “April 2009: Worldwide Social Network Ad Spending,” 2009. http://www.iab.net/insights_research/530422/1675/804264
- D. Lee, “Making Money on a Social Network,” 2009. http://news.bbc.co.uk/2/hi/technology/7914351.stm
- Twitter, “Does Twitter Hate Advertising?” 2009. http://blog.twitter.com/2009/05/does-twitter-hate-advertising.html
- M. Monahan, “KPMG/Always on VC Survey: What You’re Telling Us,” On Media NYC, New York, 2008.
- P. Kafka and A. Hallberg, “Report Card: Advertising Meets Social Networks-Have Ads Shown Traction on Major Social Networks and if Not, How Can They Be Optimized?” On Media NYC, New York, 2008.
- D. A. Williamson, “Social Network Marketing: Slow Growth Ahead for Ad Spending,” e-Marketer, 2008.
- A. Enders, H. Hungenberg, H.-P. Denker and S. Mauch, “The Long Tail of Social Networking: Revenue Models of Social Networking Sites,” European Management Journal, Vol. 26, No. 3, 2008, pp. 199-211. doi:10.1016/j.emj.2008.02.002
- C. P. Campbell, P. Maglio, A. Cozzi and B. Dorn, “Expertise Identification Using Email Communications,” Conference on Information and Knowledge Management, New Orleans, 2003, pp. 528-531.
- T. Palonen and K. Hakkarainen, “Patterns of Interaction in Computer-Supported Learning: A Social Network Analysis,” In: B. Fishman and S. O’Connor-Divelbiss, Eds., Fourth International Conferences of the Learning Sciences, Mahwah, 2000, pp. 334-339.
- L. Leydesdorff, “Betweenness Centrality as an Indicator of the Interdisciplinarity of Scientific Journals,” Journal of the American Society for Information Science and Technology, Vol. 58, No. 9, 2007, pp. 1303-1319. doi:10.1002/asi.20614
- J. Xu and H. Chen, “Criminal Network Analysis and Visualization,” Communications of the ACM, Vol. 486, No. 6, 2005, pp. 101-107.
- S. P. Borgatti and L. Xun, “On Network Theory. Organization Science,” Journal of Supply Chain Management, Vol. 45, No. 2, 2009, pp. 5-22. doi:10.1111/j.1745-493X.2009.03166.x
- S. Rodan and C. Galunic, “More than Network Structure: How Knowledge Heterogeneity Influences Managerial Performance and Innovativeness,” Strategic Management Journal, Vol. 25, No. 6, 2004, pp. 541-556. doi:10.1002/smj.398
- P. Balkundi, M. Kilduff, Z. Barsness and J. Michael, “Demographic Antecedents and Performance Consequences of Structural Holes,” Journal of Organizational Behavior, Vol. 28, No. 2, 2007, pp. 241-260. doi:10.1002/job.428
- S. Okazaki, “The Tactical Use of Mobile Marketing: How Adolescents: Social Networking Can Best Shape Brand Extensions,” Journal of Advertising Research, Vol. 49, No. 1, 2009, pp. 12-26. doi:10.2501/S0021849909090102
- N. Lin, K. Cook and R. Burt, “Social Capital: Theory and Research,” Aldine de Gruyter, New York, 2001.
- R. Burt, “Brokerage and Closure: An Introduction to Social Capital,” Oxford University Press, Oxford, 2005.
- R. Burt, “Structural Holes: The Social Structure of Competition,” Harvard University Press, Cambridge, 1995.
- V. Krebs, “Social Network Analysis, A Brief Introduction,” 2009. http://www.orgnet.com/sna.html
- R. Burt, “The Network Structure of Social Capital,” Research in Organizational Behavior, Vol. 22, No. 3, 2000, pp. 325-423.
- P. Moran, “Structural and Relational Embeddedness: Social Capital and Managerial Performance,” Strategic Management Journal, Vol. 26, No. 12, 2005, pp. 1129-1151. doi:10.1002/smj.486
- G. Soda, A. Usai and A. Zaheer, “Network Memory: The Influence of Past and Current Networks on Performance,” Academy of Management Journal, Vol. 47, No. 6, 2004, pp. 893-906. doi:10.2307/20159629
- B. Iyer, C. Lee and N. Venkatraman, “Managing in a Small World Ecosystem: Some Lessons from the Software Sector,” California Management Review, Vol. 48, No. 3, 2008, pp. 28-47. doi:10.2307/41166348
- W. Oh, J. Choi and K. Kim, “Coauthorship Dynamics and Knowledge Capital: The Patterns of Cross-Disciplinary Collaboration in Information Systems Research,” Journal of Management Information Systems, Vol. 22, No. 3, 2006, pp. 265-292. doi:10.2753/MIS0742-1222220309
- T. Heinze, G. Bauer and P. Moran, “Structural and Relational Embeddedness: Social Capital and Managerial Performance,” Strategic Management Journal, Vol. 26, No. 12, 2005, pp. 1129-1151. doi:10.1002/smj.486
- D. Ganley and C. Lampe, “The Ties that Bind: Social Network Principles in Online Communities,” Decision Support Systems, Vol. 47, No. 3, 2009. pp. 266-274. doi:10.1016/j.dss.2009.02.013
- C. Okoli and W. Oh, “Investigating Recognition-Based Performance in an Open Content Community: A Social Capital Perspective,” Information and Management, Vol. 44, No. 3, 2007, pp. 240-252. doi:10.1016/j.im.2006.12.007
- R. Gatarski, “Breed Better Banners: Design Automation through On-Line Interaction,” Journal of Interactive Marketing, Vol. 16, No. 1, 2001, pp. 2-13. doi:10.1002/dir.10002
- H. Robinson, A. Wysocka and C. Hand, “Internet Advertising Effectiveness: The Effect of Design for ClickThrough Rates for Banner Ads,” International Journal of Advertising, Vol. 26, No. 4, 2007, pp. 527-541.
- R. Briggs and N. Hollis, “Advertising on the Web: Is There Response before Click-Through?” Journal of Advertising Research, Vol. 37, No. 2, 1997, pp. 33-45.
- H. Li and J. Bukovac, “Cognitive Impact of Banner Ad Characteristics: An Experimental Study,” Journalism & Mass Communication, Vol. 76, No. 2, 1999, pp. 341-353. doi:10.1177/107769909907600211
- X. Dreze and F. Hussherr, “Internet Advertising: Is Anyone Watching,” Journal of Interactive Advertising, Vol. 17, No. 4, 2003, pp. 8-23.
- M. Dahlen, A. Rasch and S. Rosengren, “Love at First Site? A Study of Website Advertising Effectiveness,” Journal of Advertising Research, Vol. 43, No. 1, 2003, pp. 25-33.
- M. Dahlen, Y. Ekborn and N. Morner, “To Click or Not to Click: An Empirical Study of Response to Banner Ads for High & Low Involvement Products,” Consumption Markets and Culture, Vol. 4, No. 1, 2000, pp. 57-76. doi:10.1080/10253866.2000.9670349
- W. Gong and L. M. Maddox, “Measuring Web Advertising Effectiveness in China,” Journal of Advertising Research, Vol. 43, No. 1, 2003, pp. 34-49.
- F. Xie, N. Donthu, R. Lohtia and T. Osmonbekov, “Emotional Appeal and Incentive Offering in Banner Advertisements,” Journal of Interactive Advertising, Vol. 4, No. 2, 2004, p. 6.
- F. Calisir and D. Karaali, “The Impacts of Banner Location, Banner Content and Navigation Style on Banner Recognition,” Computers in Human Behavior, Vol. 24, No. 2, 2008, pp. 535-543. doi:10.1016/j.chb.2007.02.019
- C. Yoo and K. Kim, “Processing of Animation in Online Banner Advertising: The Roles of Cognitive and Emotional Responses,” Journal of Interactive Marketing, Vol. 19, No. 4, 2005, pp. 18-34. doi:10.1002/dir.20047
- J. Chen, W. Ross, D. Yen and L. Akhapon, “The Effect of Types of Banner Ad, Web Localization, and Customer Involvement on Internet Users’ Attitudes,” Cyberpsychology & Behavior, Vol. 12, No. 1, 2009, pp. 71-73. doi:10.1089/cpb.2008.0199
- A. Sigel, G. Braun and M. Sena, “The Impact of Banner Ad Styles On Interaction And Click-Through Rates,” Issues in Information Systems, Vol. 9, No. 2, 2008, pp. 337- 342.
- K. Burns and R. Lutz, “Web Users’ Perceptions of and Attitudes toward Online Advertising Formats,” International Journal of Internet Marketing and Advertising, Vol. 4, No. 4, 2008, pp. 281-301. doi:10.1504/IJIMA.2008.019150
- R. Lohtia, N. Donthu and E. Hershberger, “The Impact of Content and Design Elements on Banner Advertising Click-Through Rates,” Journal of Advertising Research, Vol. 43, No. 4, 2003, pp. 410-418.
- G. Ryu, E. Lim, L. Tan and Y. Han, “Preattentive Processing of Banner Advertisements: The Role of Modality, Location, and Interference,” Electronic Commerce Research and Applications, Vol. 6, No. 1, 2007, pp. 6-18. doi:10.1016/j.elerap.2005.11.001
- B. Huhmann, “Visual Complexity in Banner Ads: The Role of Color, Photography, and Animation,” Visual Communication Quarterly, Vol. 10, No. 3, 2003, pp. 10- 17. doi:10.1080/15551390309363510
- R. Moore, C. Stammerjohan and R. Coulter, “Banner Advertiser-Web Site Context Congruity and Color Effects on Attention and Attitudes,” Journal of Advertising, Vol. 34, No. 2, 2003, pp. 71-84.
- L. Sherman and J. Deighton, “Banner Advertising: Measuring Effectiveness and Optimizing Placement,” Journal of Interactive Marketing, Vol. 15, No. 2, 2001, pp. 60-64. doi:10.1002/dir.1011
- FeaturedUsers, “Frequently Asked Questions: Featured Users,” 2009. http://featuredusers.com/faq#featuredUsers
- S. Borgatti, M. Everett and L. Freeman, “Ucinet for Windows: Software for Social Network Analysis,” Cambridge, 2009.
- P. Chatterjee, D. Hoffman and T. Novak, “Modeling the Clickstream: Implications for Web-Based Advertising Efforts,” Marketing Science, Vol. 22, No. 4, 2003, pp. 520- 541. doi:10.1287/mksc.22.4.520.24906
- J. Chandon, M. Chtourou and D. Fortin, “Effects of Configuration and Exposure Levels on Responses to Web Advertisements,” Journal of Advertising Research, Vol. 43, No. 2, 2003, pp. 217-229.
- C. Cho, “How Advertising Works on the WWW: Modified Elaboration Likelihood Model,” Journal of Current Issues and Research in Advertising, Vol. 21, No. 1, 1999, pp. 34-50. doi:10.1080/10641734.1999.10505087
- P. Chatterjee, “Are Unclicked Ads Wasted? Enduring Effects of Banner and Pop-Up Ad Exposures on Brand Memory and Attitudes,” Journal of Electronic Commerce Research, Vol. 9, No, 1, 2008, pp. 56-61.
- J. Murphy, C. Hofacker and Y. Racine, “Testing Position Effects and Copy to Increase Web Page Visits,” Information Technology & Tourism, Vol. 8, No. 1, 2006, pp. 3-13. doi:10.3727/109830506778193869
- N. Razzouk and V. Seitz, “Banner Advertising and Consumer Recall: An Empirical Study,” Journal of Promotion Management, Vol. 9, No. 1-2, 2003, pp. 71-80. doi:10.1300/J057v09n01_07
- J. Wang and R. Day, “The Effects of Attention Inertia on Advertisements on the WWW,” Computers in Human Behavior, Vol. 23, No. 3, 2007, pp. 1390-1407. doi:10.1016/j.chb.2004.12.014
- R. Dewan, M. Freimer and J. Zhang, “Management and Valuation of Advertisement-Supported Web Sites,” Journal of Management Information Systems, Vol. 19, No. 3, 2003, pp. 87-98.
- FeaturedUsers, “Frequently Asked Questions: Publishers,” 1979. http://featuredusers.com/faq#featuredUsers
- K. Burns and R. Lutz, “The Function of Format: Consumer Responses to Six On-Line Advertising Formats,” Journal of Advertising, Vol. 35, No. 1, 2006, pp. 53-63. doi:10.2753/JOA0091-3367350104
- R. Lohtia, N. Donthu and I. Yaveroglu, “Evaluating the Efficiency of Internet Banner Advertisements,” Journal of Business Research, Vol. 60, No. 4, 2007, pp. 365-370. doi:10.1016/j.jbusres.2006.10.023
- [61] M. Hupfer and A. Grey, “Getting Something for Nothing: The Impact of a Sample Offer and User Mode on Banner Ad Response,” Journal of Interactive Advertising, Vol. 6, No. 1, 2006, pp. 105-117.
- [62] E. Plakoyiannaki, K. Mathioudaki, P. Dimitratos and Y. Zotos, “Images of Women in Online Advertisements of Global Products: Does Sexism Exist?” Journal of Business Ethics, Vol. 83, No. 1, 2008, pp. 101-112. doi:10.1007/s10551-007-9651-6
- [63] J. Severn, G. Belch and M. Belch, “The Effects of Sexual and Non-Sexual Advertising Appeals and Information on Cognitive Processing and Communication Effectiveness,” Journal of Advertising, Vol. 19, No. 1, 1990, pp. 14-22.
- [64] R. Kerin, W. Lundstrom, J. William and D. Sciglimpaglia, “Women in Advertisements: Retrospect and Prospect,” Journal of Advertising, Vol. 8, No. 3, 1979, pp. 37-42.
- [65] V. Krebs, “Social Network Analysis, A Brief Introduction,” 2009. http://www.analytictech.com/networks/egonet.htm
- [66] P. Danaher and G. Mullarkey, “Factors Affecting Online Advertising Recall: A Study of Students,” Journal of Advertising Research, Vol. 43, No. 3, 2003, pp. 252-267. doi:10.1017/S0021849903030319
- [67] K. Yang, “Effects of Consumer Motives on Search Behavior Using Internet Advertising,” CyberPsychology & Behavior, Vol. 7, No. 4, 2008, pp. 430-442. doi:10.1089/cpb.2004.7.430
NOTES
*Corresponding author.