Technology and Investment
Vol.1 No.2(2010), Article ID:1761,4 pages DOI:10.4236/ti.2010.12013
Simple Differential Equations of A & H Stock Prices and Application to Analysis of Equilibrium State
1Department of Mechanics, School of Civil Engineering and Transportation, South China University of Technology, Guangzhou, China
2China Construction Bank Guangdong Branch, Guangzhou, China
E-mail: cttqyun@scut.edu.cn, samyun@126.com
Received December 13, 2009; revised December 18, 2009; accepted December 20, 2009
Keywords: A & H Stock Markets, Differential Equation, G-Contraction Mapping, Equilibrium State, Stock Value
Abstract
Similar to the simplest differential equation of stock price, a set of simultaneous differential equations of stock prices of the same share in both A and H stock markets have been established. This is a set of simultaneous nonlinear differential equations, which can be solved by iteration method via a proof by g-contraction mapping theorem. Further more, the exact solution for equilibrium state and an example of checking the price prediction of “China Petroleum” (601857) at a conference held in May 2008 are given.
1. Introduction
The “A-stock market” in China is a new developing market approaching to connect with the regulations of international markets. The Hong Kong stock market (H-stock market) is a district international stock market. Many Chinese companies issue their stocks in both A and H stock markets. The difference between A and H stock market makes the same share have different prices in A and H stock markets, and thus speculating on different stock prices happens frequently. The technique of evaluating the value of a stock is most important for investors. Usually, for the same share, a higher value, or PE ratio, is estimated in A-stock market than that for H-stock market due to many reasons. However, no paper concerned with quantitative analysis for stock price in A & H stock markets has been found. This paper establishes a set of simultaneous differential equations for stock prices in A & H stock markets based on a certain mathematic model developed by a serious works of the author [1-11]. The simultaneous differential equations can be solved by iteration method via the similar proof by g-contractive mapping theorem [12]. Further more, an exact solution for a usefully special case is obtained. An example of checking the predicting of stock price of “China Petroleum” (601857) at a conference held in May 2008 is given.
2. Simultaneous Differential Equations of Stock Prices of A & H Stock Markets
Similar to the establish of simplest differential equation of stock price [9], we set up:
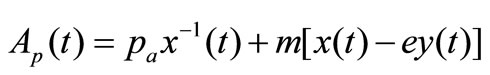
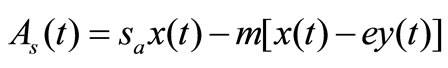
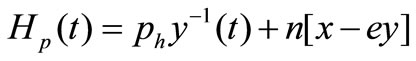
a) equations of amount of purchasing and selling:
 (1)
(1)
 (2)
(2)
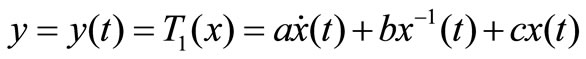
where  represents time;
 ,
,  represent the amount of purchasing and selling respectively;
 ,
,  represent the stock price (unit by RMB) of a share in A and H stock market respectively;
 ,
,  ,
,  ,
,  are constants. In which we assume that the amount of purchasing
  is inverse proportion to the stock price
 , and proportion to the difference of
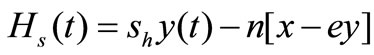
 ; the amount of selling
  is proportion to the stock price
  and minus proportion to the difference of
 , since selling and purchasing are opposite action of trading.
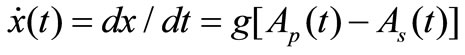
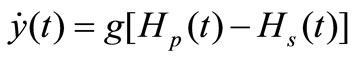
b) equation of the changing rate of stock price:
We assume that the changing rate of stock price is proportion to the difference between demand and supply, i.e.,
 (3)
(3)
where  is a constant to make sure same dimension on both sides.
c) Simultaneous differential Aquations of stock prices in A & H stock markets Substituting (1), (2) into (3), we have
 (4)
(4)
 (5)
(5)
Similarly, for H stock market, we have
 (6)
(6)
 , (7)
, (7)
 , (8)
, (8)
where ,
,  are the amount of purchasing and selling respectively;
 ,
,  ,
,  are constants. Substituting (6), (7) into (8), we have
 (9)
(9)
 (10)
(10)
(4), (9) are the simultaneous differential equations of stock prices. Which are a cycling nonlinear differential equations, and can be shown the existence of solutions  and
and , i.e., the fixed points

 , and
, and , via g-contractive mapping theorem [12]. We are not going to the details of the proof but focus our attention to the more useful problem, i.e., where is the equilibrium point?
3. The Exact Solution of Simultaneous Differential Equations for a Special Case, the Equilibrium State = 0
= 0
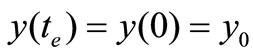
We say that  = 0 is an equilibrium state, at which no profit can be made from speculating the difference between the A and H stock prices, or no money moves on balance from A-stock to H-stock (or from H-stock to A-stock) for speculation. If
  > 0, then, A-stock price
  is chipper, and thus money moves from H-stock market to A-stock market; If
  < 0, then money moves from A-stock market to H-stock market.
In an equilibrium state  = 0, we have
 (11)
(11)
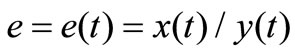
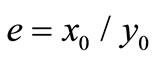
where  is the ratio of A and H stock prices at equilibrium state.
There are a lot of argue on the value of . How much should
  be?
be?
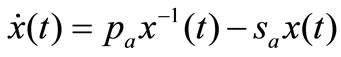
If  = 0, then substituting (1), (2) into (3), we have
 (12)
(12)
The solution of (12) is
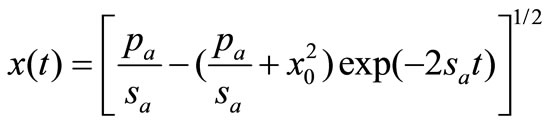 (13)
(13)
where  is the stock price at the beginning of the equilibrium state.
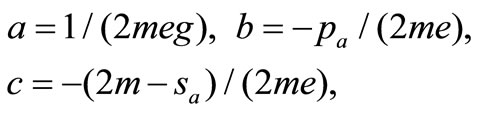
Similarly, for  = 0, substituting (6), (7) into (8), we have
 (14)
(14)
The solution of (14) is
 (15)
(15)
where  is the stock price at the beginning of the equilibrium state.
Substituting (13), (15) into (11), we get
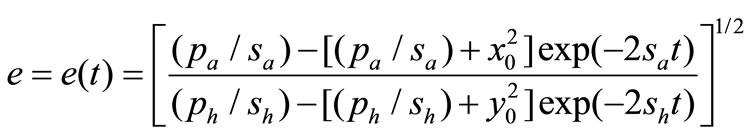 (16)
(16)
Once the coefficients ,
,  ,
,  ,
,  have been found ([10] for the determination of coefficients),
  can be calculated by (16).
However, how can we find an equilibrium state from the markets data?
The “equilibrium state” is an ideal concept, in which no money moves on balance from either A-stock market to H-stock market or from H-stock market to A-stock market for speculating profits. But how can we know no money moving between both stock markets from markets data? The market data only provide information of stock prices, turn-over volumes. The coefficients ,
, ,
, ,
, can be calculated from the market data [10] of different time in a short time interval such that these coefficients keep unchanged. However, it is more accurate to use the information at the same time. In the following, we consider a special case of an equilibrium state, i.e.,
  = 0 and
  = 0 hold at the same time
 , i.e., both stock prices
  and
and  are in a “stationary point” (or the so-called “Doji” in marketing term, or a “cross star” in Chinese marketing term).
 , and
, and (17)
(17)
Substituting (17) into (12) and (14), we have
 (18)
(18)
 (19)
(19)
Substituting (18), (19) into (11) we have
 (20)
(20)
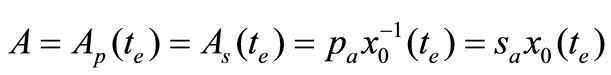
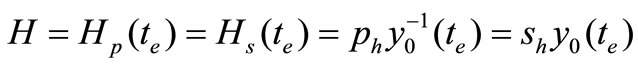
Since at a stationary point,  ,
,  keep unchanged, then
 ,
,  , i.e., let the time
  be the starting time
  of the equilibrium state, then (16) becomes
 (21)
(21)
(21) and (20) are equivalent, but (21) is easier to know  and
and  from the market data.
Now we have not used the information of turn-over volumes. Notice that Substituting (3) and (8) into (17), together with (1), (2), (6), (7), we have
 , (22)
 , (23)
where  and
and  are the turn-over volumes of the stock s in A and H markets respectively.
Now we have three independent Equations (22) and (23) and can determine three unknown coefficients  =
= ,
,  ,
,  , (let
  =
= , i.e., the purchasing condition is the same for A and H stock markets)
 =
=  =
=  =
= ,
,  =
= ,
,
 =
= (24)
(24)
From (24) and (21), we have
 , (25)
Substituting ,
,  ,
,  , and
, and  into (21) and (25), if both (21) and (25) are satisfied, i.e.,
 (26)
(26)
i.e., the turn-over volume is inverse proportion to the stock price, then, we can consider that such a state is in equilibrium.
4. An Example of Checking the Prediction on Stock Price of “China Petroleum” (601857) at a Conference Held on May 23-25, 2008 [13].
“China Petroleum” (601857) has the largest weight on Shanghai SSE Index and the tendency of the prices of both “Petroleum China” (HK0857) and “China Petroleum” (601857) become the focus of attention for A & H stock speculators and investigators. When the price of “China Petroleum” went down from 48 (Yuan of RMB) to about 20, since Oct. 2007, many analysts revised their price bottom estimations from 45, 42, 40, 35, 32, 30, 25, 20. At last, 16.7 (the issuing price) was considered as the bottom line by the market. The author analyzed the market data according to the theory of equilibrium state based on simultaneous differential equations of A, H stock prices and made a prediction that “16.7 is not the bottom” published in a “Collecting papers” of “forum on district economic cooperation and district development” held on May 23-25, 2008 [13].
From the markets data, we tried to find both “Doji” appeared at the same time 2008-04-10, the opening price 17.11, the closing price 17.35 (near “Doji”), turn-over volume 51.887 (million Yuan, RMB) of “China Petroleum” (601857); while opening price 10.20 (HKD), Closing price 9.82 (HKD) (near “Doji”), turn-over volume 172.785 (million HKD) of “Petroleum China” (HK0857). We considered that the time 2008-04-10 can be viewed as the time  of equilibrium state and
  = 17.35,
  = 9.82 × 0.90 = 8.838 (0.90 is the ratio of RMB to HKD). By (21), we have
 = 1.963
By (25), we have
 (27)
(27)
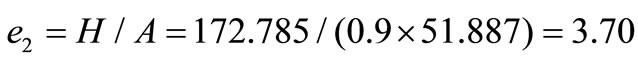
However,  , which means that 2008-04-10 is not a strict equilibrium state, in which the turn-over volume in H-stock market is 3.7 times the turn-over volume in A-stock market. This means that the same stock “Petroleum China” (HK0857) is much chipper than that of “China Petroleum” (601857), therefore the speculating money rushed into H-stock market, and made a larger turn-over volume. This also showed that the price of (601857) 17.35 had rooms for getting down, especially for the tendency of (HK0857) was going down (opening price < closing price) at 2008-04-10. Again, even if 2008-04-10 is an equilibrium state, then, 17.35 is a mean value (or the value of stock) and is not the bottom line, so that 16.7 (the so-called “political bottom”, “technical bottom” etc.) is not a real bottom of the A stock market.
According to the above analysis, the author made a prediction that “16.7 is not the bottom” at a conference held in May 23-25, 2008 [13]. The history shows that the prediction is correct, the stock price of “China Petroleum” went down and break the issuing price 16.7 since June-July 2008, until now its price is below 13.8 (lowest 9.9).
5. Conclusion Remarks
Stock value estimation is an important evaluation to investigators. Stock value is defined herein as the stock price at the “equilibrium state”. The “equilibrium state” is an ideal concept, in which no money moves on balance between A and H stock markets for gaining speculating profits from the difference of A and H markets. How to find the equilibrium state from the markets data? At first, finding both “Doji” (i.e., the stationary point) at the same time  from the daily K-line of A and H stock markets; then, calculating the ratios
  and
and  by (26) and (27), if
  =
= , i.e., the turn-over volume is inversely proportion to the stock price, then,
  is the time at equilibrium. Usually, it is hard is find a strict equilibrium state from the markets data, and a near equilibrium state is excepted for rough estimation.
6. References
[1] T. Q. Yun, “A Basic Integral-Differential Equation of Changing Rate of Stock Price,” Journal of South China University of Technology, in Chinese,Vol. 24, No. 6, 1996, pp. 35-39.
[2] T. Q. Yun, “A Short-Term Prediction of Stock Price for the Normal Case,” Journal of South China University of Technology, in Chinese, Vol. 25, No. 5, 1997, pp. 47-51.
[3] T. Q. Yun, “Basic Equations, Theory and Principles for Computational Stock Markets (I)—Basic Equations,” Applied Mathematics and Mechanics, Vol. 20, No. 2, 1999, pp. 154-162.
[4] T. Q. Yun, “Basic Equations, Theory and Principles for Computational Stock Markets (II)—Basic Principles,” Applied Mathematics and Mechanics, Vol. 20, No. 7, 1999, pp. 721-728.
[5] T. Q. Yun, “Basic Equations, Theory and Principles For Computational Stock Markets (III)—Basic Theory,” Applied Mathematics and Mechanics, Vol. 21, No. 8, 2000, pp. 861-868.
[6] T. Q. Yun, “Analysis of Financial Derivatives by Mechanical Method (I)—Basic Equation of Price Of Index Futures,” Applied Mathematics and Mechanics, Vol. 22, No. 1, 2001, pp. 118-125.
[7] T. Q. Yun, “Analysis of Financial Derivatives By Mechanical Method (II)—Basic Equation of Market Price of Option,” Applied Mathematics and Mechanics, 2001, Vol. 22, No. 9, pp. 1004-1011.
[8] T. Q. Yun, “The Application of Game Theory to Stock/Option Trading,” Forecasting, in Chinese, Vol. 20, No. 5, 2001, pp. 36-38.
[9] T. Q. Yun and G. L. Lei, “Simplest Differential Equation of Stock Price, Its Solution and Relation to Assumptions of Black-Scholes Model,” Applied Mathematics and Mechanics, Vol. 24, No. 6, 2003, pp. 654-658.
[10] T. Q. Yun and J. S Yu, “Mathematical Analysis for Operators—Gaps, Optimum Pushing Up, Tactics of Run Away, and Reliability Calculation,” Research on Financial and Economic Issues (additional copy), in Chinese, Vol. 5, May 2005, pp. 32-35.
[11] J. S. Yu, T. Q. Yun and Z. M. Gao, Theory of Computational Securities, Scientific Publishers, Beijing, 2008.
[12] T. Q. Yun, “Fixed Point Theorem of Composition GContractive Mapping and its Applications,” Applied Mathematics and Mechanics, Vol. 22, No. 10, 2001, pp. 1132-1139.
[13] T. Q. Yun, “Simultaneous Differential Equations of A, H Stock Prices,” Forum on District Economic Cooperation and District Economic Development, Journal of Economic Research, University of Guangzhou, Guangzhou, 23-25 May 2008, pp. 599-604.