Journal of Electromagnetic Analysis and Applications
Vol.07 No.03(2015), Article ID:54952,6 pages
10.4236/jemaa.2015.73010
Collapse of Nonlinear Dust Sound Pulses in Cylindrical Dusty Plasma Waveguides
Volodymyr Grimalsky1, Svetlana Koshevaya1, Anatoliy Kotsarenko2, Alvaro Zamudio-Lara1
1CIICAp, Autonomous University of State Morelos (UAEM), Cuernavaca, Mexico
2Faculty of Engineering, Autonomous University of Carmen (UNACAR), Ciudad Del Carmen, Mexico
Email: v_grim@yahoo.com, svetlana@uaem.mx, azamudio@uaem.mx, kotsarenko@gmail.com
Copyright © 2015 by authors and Scientific Research Publishing Inc.
This work is licensed under the Creative Commons Attribution International License (CC BY).
http://creativecommons.org/licenses/by/4.0/


Received 12 February 2015; accepted 20 March 2015; published 24 March 2015
ABSTRACT
Nonlinear monopulses of dust sound waves in cylindrical dusty plasma waveguides bounded by a dielectric are investigated. The dusty plasma includes the positive ions as a light component and the negative dust as a heavy one. The dusty plasma with different masses of dust particles is considered. The set of hydrodynamic equations for the dust jointly with the Poisson one are used. The Boltzmann distribution is valid for the ions. The boundary conditions are applied at the smooth interface. When the moderate volume nonlinearity manifests, near the interface the variations of the dust concentration reach extremely high values, and the collapse of the dust sound waves occurs. In the cylindrical waveguides the collapse manifests at the values of the initial wave amplitudes essentially smaller than in the planar geometry. When the particles of lower masses are near the interface, the collapse realizes more rapidly.
Keywords:
Dusty Plasma, Cylindrical Waveguide, Different Masses, Wave Collapse

1. Introduction
Last time the investigations of dusty plasmas are of great interest, not only due to various technological applications, but also because of atmosphere and ionosphere contaminations by a space trash and volcano activity [1] - [5] . An important property of dusty plasmas is the support of various waves and oscillations, both linear and nonlinear ones [3] - [8] . The dusty plasmas can be bounded and can be the waveguides for plasma waves. In the bounded plasma waves the oscillations of the surface charge take place [2] [6] . Even in the case when the volume nonlinearity is small, the variations of the dust concentration near interfaces can reach essential values [9] [10] and cannot be considered as moderate. Earlier it demonstrated the sharp increase of the dust concentration in the thin layer near the boundary, which was called the collapse of the surface plasma waves [9] . The collapse of surface plasma wave was observed experimentally [11] .
In the present paper the nonlinear monopulses of dust sound waves in the cylindrical dusty plasma waveguides bounded by a dielectric are investigated. The waves propagate along OZ-axis, see Figure 1.
The dusty plasma includes the positive ions as the light component and the negative dust as the heavy component. The set of hydrodynamic equations for the dust, namely, the continuity equation and the equation for the momentum jointly with the Poisson one for the electric field are used. The Boltzmann distribution is used for the ions. The electric and hydrodynamic boundary conditions are applied at the smooth interface dusty plasma-dielectric. The initial condition for the electric potential is monopulse-like, as well as for the perturbation of the dust concentration. The simulations have demonstrated that the wave collapse occurs near the interface at essentially smaller initial amplitudes, when compared with the planar case. The dynamics of the wave collapse depends on the distribution of the dust particles with different masses near the interface. When the particles of lower masses are near the interface, the collapse realizes more quickly.
2. Basic Equations
Consider the dusty cylindrical plasma waveguide, 0 < r < R, bounded by a dielectric of the permittivity e > 1 at r > R, see Figure 1(a). The dusty plasma includes positively charged ions (+e) and negative charged dust particles (−Q). The temperature of ion fluid is Ti, one of the dust is Td. It is assumed that . Note that Td is the temperature of the collective motion of the dust particles but not the temperature within each particle. The mass of the ion is mi, the mass of the dust particle is
 . Generally the dust particles can possess different masses in different regions:
 .
.
The set of hydrodynamic equations for the dust fluid concentration nd and the velocity vd is [2] [3] [12] - [14] :
 (1)
(1)
The ion concentration ni obeys the Boltzmann distribution:
 (2)
(2)
here ni0, nd0 are unperturbed concentrations, in the neutral state there is .
.
Equation (1) are added by the Poisson equation for the electric potential j (in absolute units):
 (3)
(3)
The basic equations have been reduced to the undimensional form. The following units have been used for prepare of undimensional values like jTi for the potential,  for distances,
 for time. The parameter md0 is some typical value of the dust particle mass. As the result the basic equations are:
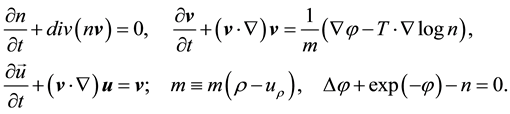 (4)
(4)
Here n, v, u are undimensional dust concentration, velocity, and displacement; ; the undimensional dust mass is
 . One can see that the dependence of mass on the coordinate results in an additional mechanism of nonlinearity. In calculations the value of T ¹ 0 is used, because in the limiting case T = 0 it is necessary to consider the motion of the surface charge separately. Our results are independent on the value of T, when T < 0.01.

 (a) (b)
Figure 1. Geometry of the problem. Part (a) is the cylindrical dusty plasma waveguide, (b) is the planar one.
Within the dielectric at r > R the Laplace equation is valid:
 (5)
(5)
The system possesses the axial symmetry. Therefore, the dust velocity v has only the two components vr, vz.
The volume equations are added by the boundary condition at r = R. Namely, the electric potential j and the normal component of the electric induction Dr should be continuous at r = R:
 (6)
(6)
Also, because it is considered the case T ¹ 0, it should be . Otherwise, in the limiting case T ® 0 the surface dust concentration should be considered separately. Note that the interface is assumed as smooth, so the tangential component of the dust velocity is
 .
.
To solve the equations, the explicit 3-layer finite difference schemes have been applied for n, vr, vz, ur. For the Poisson equation at r < R the fast Fourier transform has been used:
 (7a)
(7a)
Equation (5) for the potential j within the dielectric at r > R is:
 (7b)
(7b)
The proper solution of Equation (7b) that decreases at r ® +¥ is
 (8)
(8)
Therefore, the boundary conditions (6) are rewritten as:
 (9)
(9)
In the center of the waveguide r = 0 the following condition is , because the radial component of the electric field is Er = 0 there due to symmetry.
Equations (7a), (9) have been solved by the finite differences within the region r < R with several iterations, which show a good convergence.
3. Results of Simulations
Earlier it was demonstrated that a manifestation of nonlinearity near the surfaces is more essential than in the volume [9] [10] . Moreover, it is possible to expect that an influence of the interface plasma?dielectric is more important in the cylindrical geometry than in the plane one, analogously to the wave collapse within framework of the nonlinear Schrödinger equation [15] [16] .
Equations (4) (5) added by boundary conditions (6) have been simulated. It is possible to solve these equations under the proper initial conditions. Namely, the initial monopulses of almost rectangular shape and of moderate maximum values  have been considered:
 (10)
(10)
Here  is the perturbation of the dust concentration.
The following distribution of the masses of the dust particles has been used:
 (11)
(11)
Namely, the values of the masses of the dust are m1 and m2 in the center of the waveguide and at the boundary, respectively; rq is the scale of variation of the mass. The used parameters are: z0 = 10, R = 3, rq = 1 − 0.1, e = 4. The results of simulations are tolerant to the change of the radius of the cylindrical waveguide 2 < R < 6.
In Figure 2 there are the dependencies of the maximum values of perturbations of the dust concentration ñ on the time t in the cylindrical waveguide. The sharp peaks of the dust concentration near the surfaces are formed, which are localized both in longitudinal (z) and transverse (ρ) directions. The maximum values of ñ are 40 - 50 times higher then in the volume. The nonlinearity ceases to be moderate near the surface. Moreover, under the levels of , see Equation (10), the calculations overflow. It is possible to interpret this phenomenon of the sharp growing and the narrowing of the dust concentration near the surface as a manifestation of the wave collapse [9] [11] . At the undimensional dust temperatures T < 0.01 the dynamics of surface dust sound waves does not depend on the value of this temperature.

Figure 2. The dependencies of the maximum values of perturbations of dust concentration ñ on the time t in the cylindrical waveguide. Curve 1 is for the initial amplitude a0 = −0.012, constant masses m1 = m2 = 1; curve 2 is for a0 = −0.012, m1 = 0.5, m2 = 1 (the lighter particles are within the volume), rq = 0.3; curve 3 is for a0 = −0.012, m1 = 1, m2 = 0.5 (the lighter particles are near the boundary), rq = 0.3; curve 4 is for a0 = −0.012, constant masses m1 = m2 = 0.5; curve 5 is for a0 = −0.01, constant masses m1 = m2 = 1; curve 6 is for a0 = −0.008, constant masses m1 = m2 = 1.
One can see that in the cylindrical geometry the wave collapse occurs at very low values of initial amplitudes of . These values are one order lower than in the plane geometry [9] [10] . The analogous dependencies for the planar waveguide are presented in Figure 3. The thickness of the planar waveguide is Lx = 6, e1 =e2 = 4. The shape of the initial perturbation of the dust concentration ñ is the same as in the cylindrical geometry, Equation (10). In the planar geometry the wave collapse occurs at higher initial amplitudes
 . Moreover, the tendencies to the collapse are different when the initial amplitudes are slightly above the threshold. Namely, the curves in Figure 3, planar geometry, are oscillatory, whereas in Figure 2 the curves are similar to ones in the case of the explosive instability [17] .
The wave dynamics depends on the values of the dust particle mass at the boundaries; see different curves in Figure 2 and corresponding Figure 4, Figure 5. The wave collapse occurs at smaller times t when the lighter particles are near the boundary: m2 < m1. Figure 4 and Figure 5 are for the same masses of the particles near the center, m1 = 1. The collapse occurs more quickly for the nonuniform distribution of masses m1 ¹ m2 within the waveguide, compare Figure 4 (greater masses of the dust particles near the boundary, m2 = 1) and Figure 5 (smaller masses near the boundary, m2 = 0.5). The dynamics of the plasma wave below the collapse is presented in Figure 6. The perturbation of the dust concentration ñ reaches its maximum value at some time moment and then decreases there.

Figure 3. The dependencies of the maximum values of perturbations of dust concentration ñ on the time t in the planar waveguide of the thickness Lx = 6. For all the cases the dust masses are constant m1 = m2 = 1. Curve 1 is for the initial amplitude a0 = −0.13; curve 2 is for the initial amplitude a0 = −0.12; curve 3 is for the initial amplitude a0 = −0.11; curve 4 is for the initial amplitude a0 = −0.10; curve 5 is for the initial amplitude a0 = −0.08.


 (a) (b) (c)
 (d) (e)
Figure 4. The spatiotemporal evolution of the perturbation of the dust concentration above the threshold for a0 = −0.012, m1 = m2 = 1 (see curve 1 in Figure 2). Part (a) is at t = 0; part (b) is for t = 4; part (c) is for t = 5; parts (d), (e) are for t = 5.42, the general view and the details near the boundary.

 (a) (b)
Figure 5. The spatiotemporal evolution of the perturbation of the dust concentration above the threshold for a0 = −0.012, m1 = 1, m2 = 0.5 (see curve 3 in Figure 2). Part (a) is at t = 4.5; part (b) is for t = 4.53. The initial pulse is the same as in Figure 4(a).

 (a) (b)
Figure 6. The spatiotemporal evolution of the perturbation of the dust concentration below the threshold (curve 6 in Figure 2). Part (a) is the initial distribution at t = 0; part (b) is at t = 8.


 (a) (b) (c)

 (d) (e) (f)
Figure 7. The spatiotemporal evolution of the pulses in the planar dusty waveguide. The initial data a0 = −0.12 correspond to Figure 3, curve 1. Part (a) is the initial distribution at t = 0; part (b), is at t = 2; parts (c), (d) are at t = 4; parts (e), (f) are at t = 4.5.
The dynamics of wave collapse in the planar geometry is presented in Figure 7. There is some difference between the wave dynamics in the cylindrical and planar geometries. In the cylindrical geometry, Figure 4, there are two sharp peaks of the perturbation of the dust concentration in the transverse direction r. In the planar geometry, Figure 7, there are two peaks in the longitudinal direction z.
4. Conclusions
The evolution of initial rectangular pulses of dust sound waves in the cylindrical plasma waveguides with dielectrics has demonstrated the essential surface nonlinearity near the interface. Under low values of the input amplitudes the values of the dust concentrations near the surface dusty plasma-dielectric reach high values, and the formation of narrow peaks of the dust concentration occurs. The nonlinearity near the surface ceases to be moderate, the compression of these pulses both in longitudinal and transverse directions takes place, and the wave collapse can be observed. The dynamics of the wave collapse depends on the distribution of the masses of the dust particles within the waveguide.
The estimated temporal and spatial scales have demonstrated that an appearance of the investigated phenomena of the nonlinear wave collapse could be possible in the dust objects within the atmosphere and in laboratory plasmas.
Acknowledgements
The authors are grateful to SEP-CONACyT (Mexico) for a partial support of our work.
References
- Fortov, V.E., Ivlev, A.V., Khrapak, S.A., Khrapak, A.G. and Morfill, G.E. (2005) Complex (Dusty) Plasmas: Current Status, Open issues, Perspectives. Physics Reports, 421, 1-103. http://dx.doi.org/10.1016/j.physrep.2005.08.007
- Shukla, P.K. and Mamun, A.A. (2002) Introduction to Dusty Plasma Physics. IoP Publisher, Bristol, 270. http://dx.doi.org/10.1887/075030653X
- Verheest, F. (2001) Waves in Dusty Space Plasmas. Kluwer, Dordrecht, 280.
- Shukla, P.K. and Mamun, A.A. (2003) Solitons, Shocks and Vortices in Dusty Plasmas. New Journal of Physics, 5, 17.1-17.37.
- Popel, S.I., Kopnin, S.I., Kosarev, I.N. and Yu, M.Y. (2006) Solitons in Earth’s Dusty Mesosphere. Advances in Space Research, 37, 414-419. http://dx.doi.org/10.1016/j.asr.2005.12.003
- Ostrikov, K.N., Yu, M.Y. and Stenflo, L. (2000) Surface Waves in Strongly Irradiated Dusty Plasmas. Physical Review E, 61, 782-787. http://dx.doi.org/10.1103/PhysRevE.61.782
- Kopnin, S.I. and Popel, S.I. (2005) Dust Acoustic Mode Manifestations in Earth’s Dusty Ionosphere. AIP Conference Proceedings, 799, 161-164. http://dx.doi.org/10.1063/1.2134590
- Popel, S.I., Golub’, A.P., Losseva, T.V., Bingham, R. and Benkadda, S. (2001) Evolution of Perturbation in Charge- Varying Dusty Plasmas. Physics of Plasmas, 8, 1497-1504. http://dx.doi.org/10.1063/1.1359743
- Grimalsky, V., Koshevaya, S., Kotsarenko, A. and Perez Enriquez, R. (2012) Collapse of Nonlinear Surface Dust Sound Waves in the Dusty Plasma-Dielectric System. Physica Scripta, 85, 1-6. http://dx.doi.org/10.1088/0031-8949/85/03/035503
- Bustos De La Rosa, M.E., Grimalsky, V., Koshevaya, S. and Kotsarenko, A. (2013) Collapse of Nonlinear Dust Sound Pulses in Dusty Plasma Waveguides. Progress in Electromagnetics Research Symposium Proceedings, Stockholm, 12-15 August 2013, 1463-1467.
- Sarkar, S., Bose, M., Mukherjee, S. and Pramanik, J. (2013) Spatiotemporal Evolution of Dielectric Driven Cogenerated Dust Density Waves. Physics of Plasmas, 20, Article ID: 064502. http://dx.doi.org/10.1063/1.4810804
- Infeld, E. and Rowlands, G. (2000) Nonlinear Waves, Solitons and Chaos. CUP, Cambridge, UK, 391. http://dx.doi.org/10.1017/CBO9781139171281
- Lifshitz, E.M. and Pitaevskii, L.P. (1981) Physical Kinetics. Pergamon, London, 452.
- Ostrovsky, L. and Potapov, A. (2002) Modulated Waves: Theory and Applications. The John Hopkins University Press, New York, 392.
- Berge, L. (1998) Wave Collapse in Physics: Principles and Applications to Light and Plasma Waves. Physics Reports, 303, 259-370. http://dx.doi.org/10.1016/S0370-1573(97)00092-6
- Kivshar, Yu. and Agrawal, G. (2003) Optical Solitons. From Fibers to Photonic Crystals. Academic Press, New York, 540.
- Weiland, J. and Wilhelmsson, H. (1977) Coherent Non-Linear Interaction of Waves on Plasmas. Pergamon, Oxford, 353.