Journal of Electromagnetic Analysis and Applications
Vol. 3 No. 12 (2011) , Article ID: 16521 , 8 pages DOI:10.4236/jemaa.2011.312080
Optimization of Sensor Orientation in Railway Wheel Detector, Using Kriging Method
![]()
School of Railway Engineering, Iran University of Science and Technology, Tehran, Iran.
E-mail: ali_zamani@rail.iust.ac.ir, mirabadi@iust.ac.ir
Received September 2nd, 2011; revised October 21st, 2011; accepted November 21st, 2011.
Keywords: Electromagnetic sensor, Finite Element Method (FEM), Kriging, Optimization, Railway axle counter, Response Surface Methodology (RSM)
ABSTRACT
Considering the importance of axle counter function in detecting the train wheels and determining the clearance or occupancy of a track section, it is important to ensure a safe and reliable performance of this system. In this paper, in order to improve the sensor performance, the authors have focused on the orientation of magnetic sensors’ coils. In order to improve the detection capability of the system, through measuring the induced voltage in the receiver coil, it is important to adjust the relative orientation of the transmitter and receiver coils. Due to the existence of infinite relative orientations, in order to determine the optimum orientation for the sensor coils, Kriging methods which is one of the Response Surface Methodologies (RSMs) is applied. Finite Element Method (FEM) is utilized to provide sample data, as inputs to the Kriging algorithm. The analysis not only provides the optimum relative orientation of the sensor coils, it also improves analysis time, comparing to field based measurements. The analysis results are validated by the laboratory based data implemented in the control and signaling laboratory of the school of railway engineering and also field based tests in Iranian railway.
1. Introduction
Axle counter is one of the most important railway signaling devices, in detecting the train wheels and determining the clearance or occupation of a track section. The detector senses the wheels through evaluating the changes in the magnetic coupling between the coils placed at either rail sides.
With increasing the application of power electronic and semiconductor devices in railcars, the radio based communication systems, and magnetic braking systems, the electromagnetic noises in the railway environment has faced with a considerable increase in the electromagnetic interference sources. These sources may affect the track side signaling equipment, such as axle counters, track circuits, balises and etc., and degrade their safety and performance. Therefore, it is important to consider appropriate protection and/or mitigation approaches. The noise reduction is especially indispensable in the case of the axle counter, which is one of the most important railway signaling devices for accurate and safe train detection and control systems.
Different parameters which affect the performance of the axle counters in proximity of electromagnetic interference sources are needed to be investigated. The working frequency, current and voltage amplitudes, sensors orientation, shielding of the sensors and their connections and also software and hardware based signal processing algorithms, are from the areas which need to be investigated and studies in detail.
In this paper, optimizing the orientation of magnetic sensors’ coils to improve the signal to noise ratio of the sensor output signal and improving its mitigation against the interfering signals is investigated.
Different optimization algorithms are used by researchers in different applications so far, from which genetic algorithm, response surface methodology (RSM), simulated annealing and tabu search are just a few examples. Kleijnen in [1] and [2], and Myers and Montgomery in [3] provide and extensive overview on optimization methods and their applications. Among the various optimization approaches introduced by researchers, the response surface methodology, RSM, due to its advantages and capabilities is chosen.
The important point about RSM is that in this method a large amount of information are extracted from a small number of experiments. In contrast with classical methods in which a large number of experiments are required to explain the behavior of a system and are time consuming.
Response surface methodology is a combination of mathematical and statistical techniques for analyzing computational experiments. The analysis of experiments uses a metamodel (also called response surface), which is an approximation of the I/O function of the experiment; i.e., the experiment yields I/O data that are used to estimate this function. Due to the existence of infinite relative orientations of the sensor coils, Kriging method which is one of the response surface methodologies is applied in order to analyze the whole range of orientation of the coils and introduce the optimum orientation.
Because of the difficulties in testing the sensors in all possible positions and orientations, finite element modeling, FEM, approach is utilized. The data provided by FEM, is fed to Kriging method. The approach and resulting algorithms are validated by testing on real system.
2. Railway Axle Counter
An axle counter system is used for counting the number of train axles coming in and going out of a section of rail track. The system consists of sensor coils for detection of the train wheels, electronic unit (electronic junction box) for signal conditioning and counting of the wheels and evaluator unit which compares the number of the wheels entering the rail section and the wheels exiting the section. The comparison result approves that the section is clear of the train or it still is occupied by a train (Figure 1). Axle counter detector makes use of electromagnetic flux linkage between two coils mounted on either side of the rail, to detect the passage of the wheels. Figure 2 shows the image of the axle counter detectors installed in the School of Railway Engineering, SRE, in Iran University of Science and Technology, IUST.
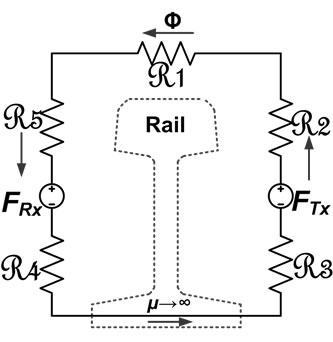
To analyze the system’s behavior, its simplified magnetic equivalent circuit can be used. Magnetic equivalent
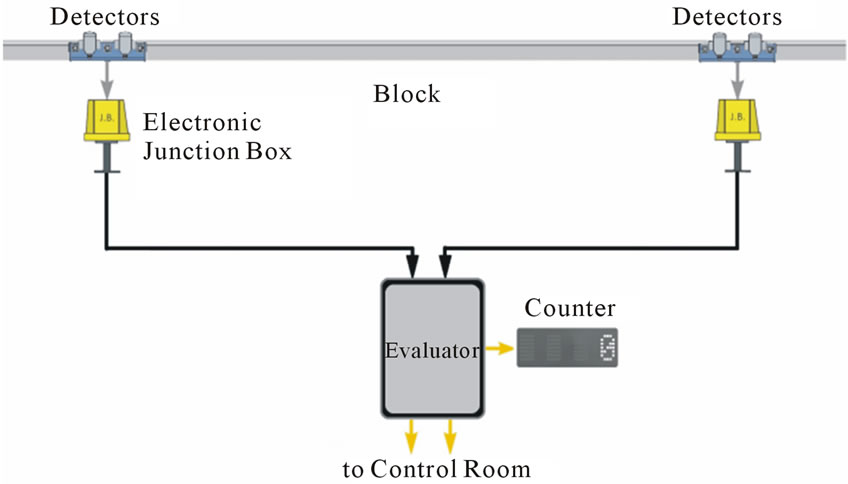
Figure 1. Schematic of a railway axle counter system.
circuit of system in presence and absence of wheel is shown in Figure 3. In this model the reluctance Ri is defined as Ri = l/μA and the magnetomotive force F as F = NI, where l is the mean length of the flux path around the coil, A is the mean cross sectional area of the flux path, µ is permeability of the material and N is number of coil turns and I is amplitude of coil current.
The permeability of air is about 4π ´ 10−7, while the permeability of the rail and wheel is much higher. In this model the reluctance of the wheel and rail is considered to be zero.
The magnetic flux generated by the transmitting coil flows through the path with lower reluctance. In the presence of the wheel, the magnetic path is shaped through the wheel and rail, causing less flux flow in the receiving coil and hence lower induced voltage in the receiver.
In order to detect the passage of a wheel, the induced voltage in the receiving coil is monitored continuously and its changes beyond some predefined threshold is interpreted as existence or absence of a wheel. In other words, the wheel detector detects the wheel when the amplitude of induced voltage in the receiving coil is less than a threshold level, as shown in Figure 4.
Van Alphen in [4] and Bloomfield [5] mentioned that axle counters can get affected by the magnetic fields close to the rails and also from the magnetic fluxes emitted from the train or caused by the traction return current.
In addition in converter-fed traction drives, the repeti-
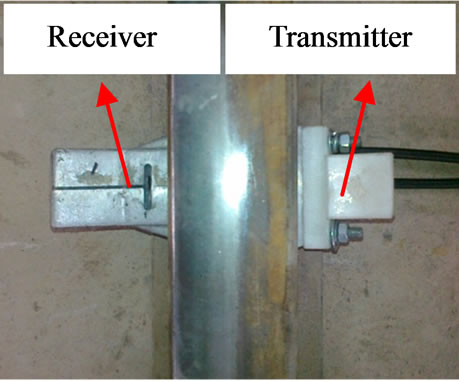
Figure 2. Axle counter sensor coils in signaling laboratory of SRE.
 (a)
(a)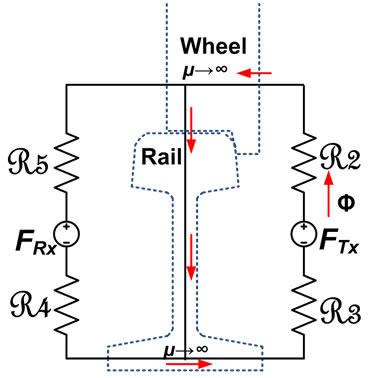 (b)
(b)
Figure 3. Magnetic equivalent circuit of system (a) In absence of wheel; (b) In presence of wheel.
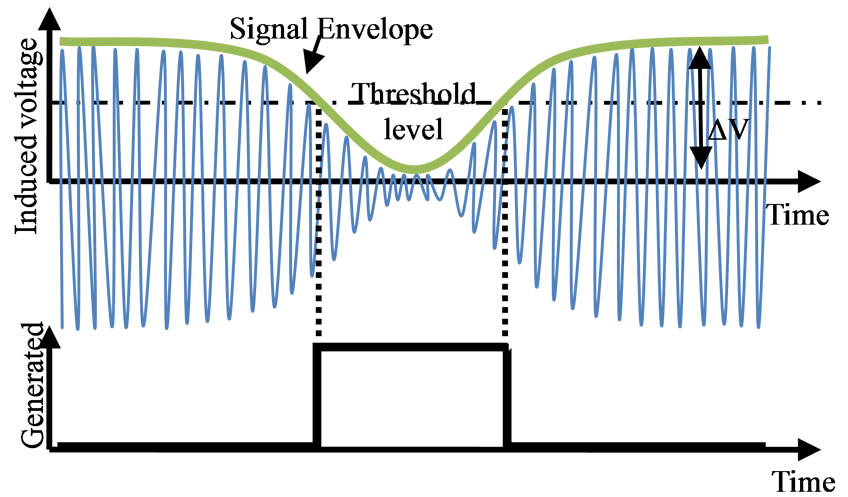
Figure 4. Induced voltage and detecting principles.
tive charging and discharging currents which flow in the rail can appear as electromagnetic interference at multiples of the converter modulation frequency. This type of interference has been detected during regenerative braking. Practical measurements have shown that transient rail current values can reach 10 A [6]. This interference can cause the sensor to count, taking the system to failure mode, where the number of wheels entering the block will not be the same as the number of wheel exiting it.
In order to reduce or eliminate the effect of noises on induced voltage, voltage amplitude difference in the presence and absence of a wheel (ΔV), should be as great as possible. Having fixed the transmitting coil voltage, frequency and also the number of coils’ turns, induced voltage in the receiver depends on the relative orientation of the coils. Optimum orientation of sensors is where ΔV has its maximum value, in which the highest signal to noise ratio for a particular level of noise can be achieved. In fact, greater ΔV in no-interference and noise conditions, results in higher sensor detectability of the wheels and less sensitivity to the noise.
3. Modeling of Axle Counter System by FEM
The Finite Element Method (FEM) is a numerical technique for finding approximate solutions of partial differential equations as well as of integral equations.
By using the FEM, the original boundary-value problem with an infinite number of degrees of freedom convert into a problem with a finite number of degrees of freedom. Then a system of algebraic equation obtain. And finally, solution of the boundary-value problem achieve by solving the system of equations.
The FEM is used to determine the electromagnetic field around the sensor coils and also the induced voltage in the receiving coil. This provides the opportunity to model the system in a variety of coil orientations.
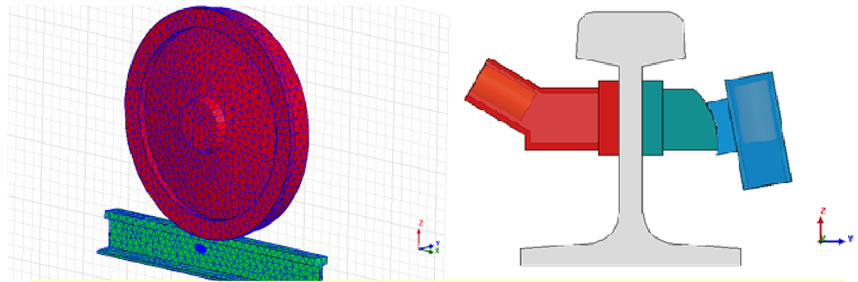
In order to validate the model developed in FEM (Figure 5), the FEM results are compared with experimentally measured induced voltages in different sensor arrangements. Table 1 indicates that the modeled values of induced voltages are in reasonable agreement with the measured ones.
Figure 6 shows the laboratory set up of the axle counter sensors, studied in the research work.
The flux density distributions around the receiving coil in presence and absence of the wheel are shown in Figure 7. When the wheel is located in between of the transmitting and receiving coils, flux magnitude decreases owing to the lower reluctance of the wheel rather than the air, which results in a reduction of the induced voltage in the receiving coil. Additionally, with the presence of the wheel, the flux density direction becomes
 (a) (b)
Figure 5. 3D Axle Counter Model, (a) Meshed rail and wheel; (b) Receiver, transmitter and rail model.

Figure 6. Laboratory set up.
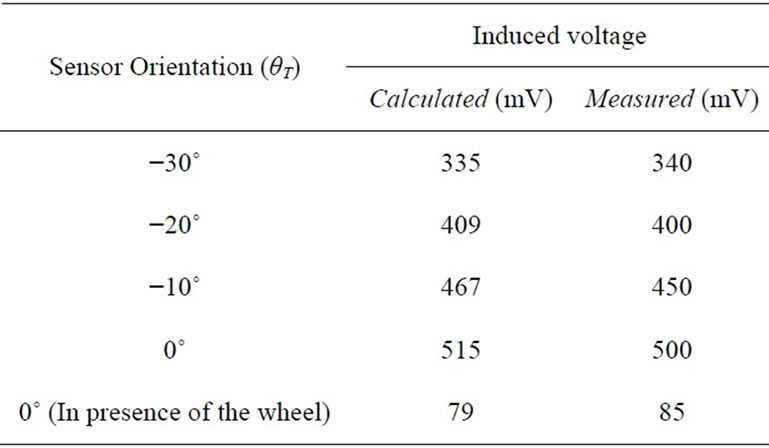
Table 1. Comparison between measured and calculated induced voltages (θR is fixed in −40˚).
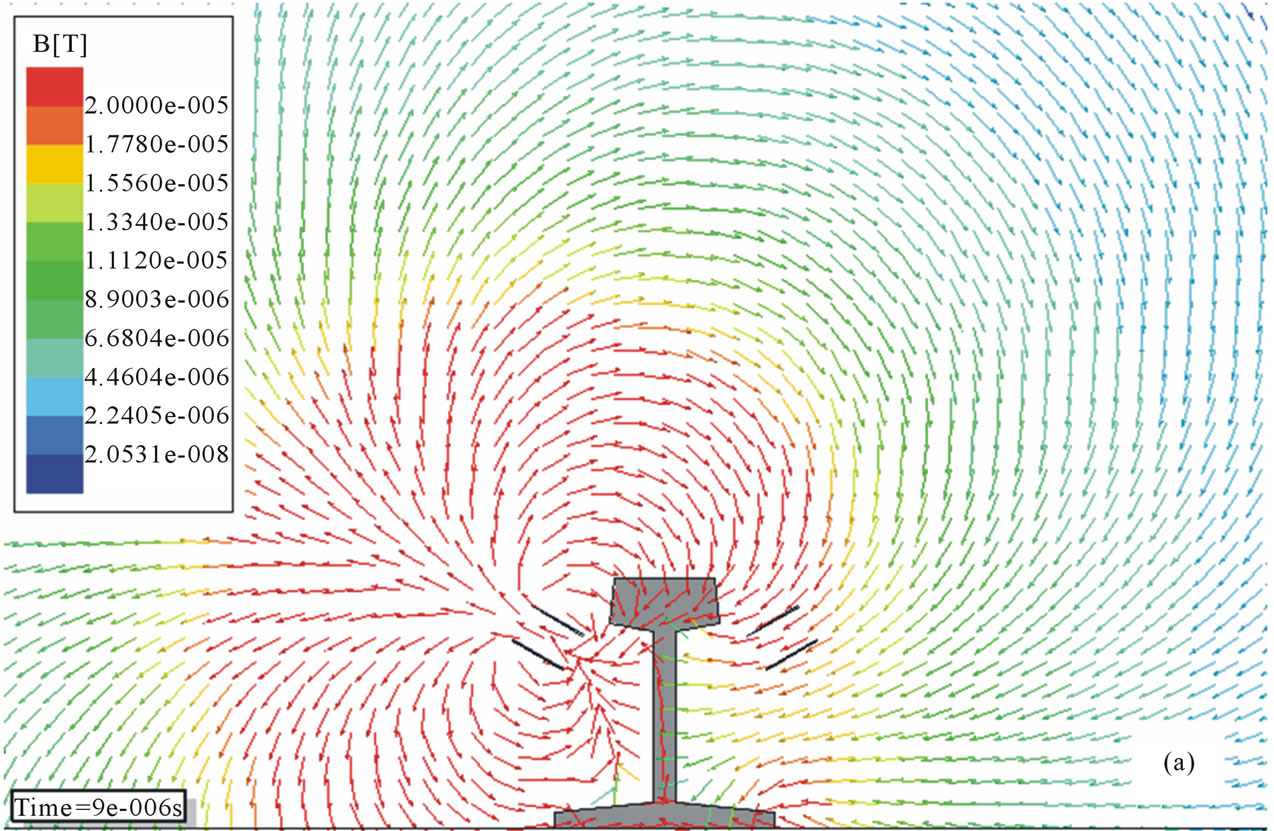
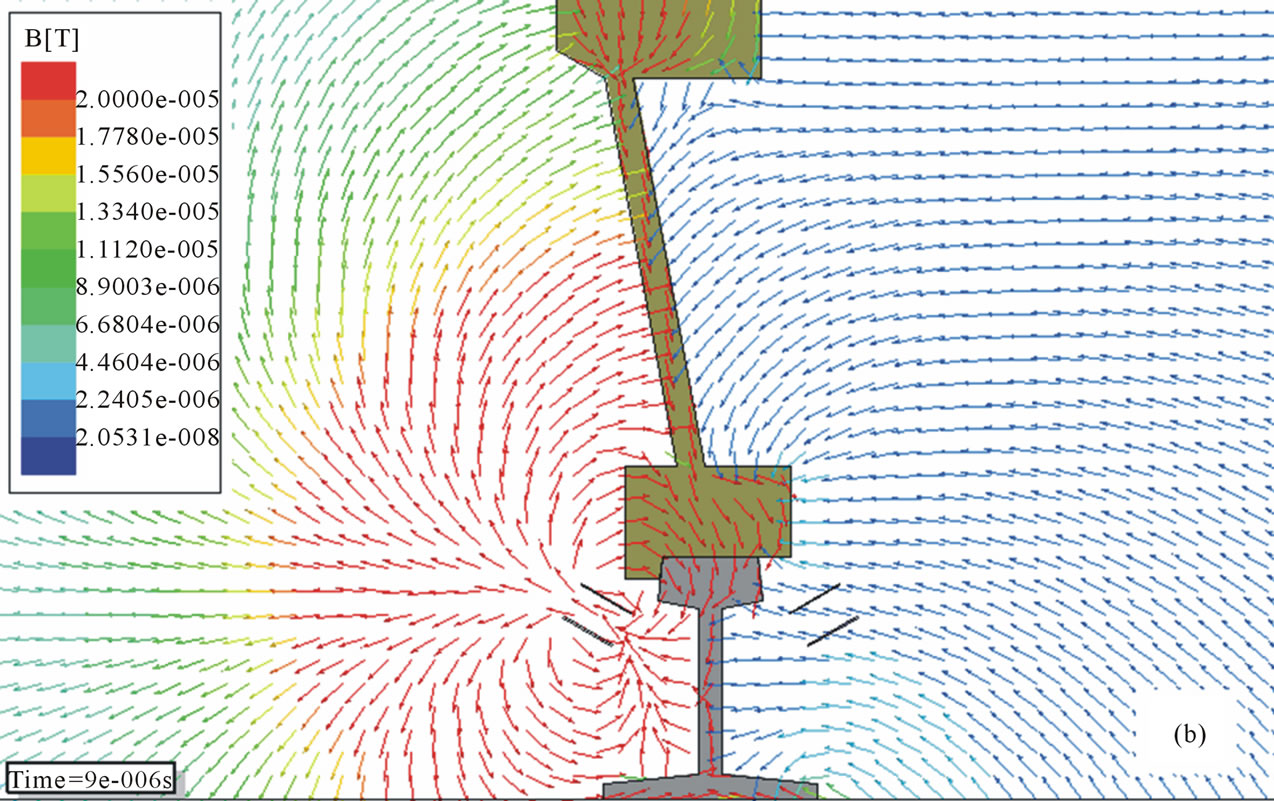
Figure 7. Distribution of magnetic flux density θR = −60˚ and θT = 60˚ (a) No wheel; (b) In presence of the wheel.
nearly normal to the coil axis, which results in reduction in the flux passing through the receiving coil, and results in further reduction in the induced voltage.
4. Optimization
Optimization is a method of making the system or the design as perfect, cost effective and/or qualified as possible, considering the existing environmental and operational constraints and conditions.
The aim of utilizing optimization in the axle counter design, as an electromagnetic system, is to determine the most appropriate orientation and location of the coils relative to the rail and to each other, to provide the maximum affordable sensitivity in detecting the train wheels and at the same time maximum protection against the environmental noises and interferences. In other words finding the set of optimum θR and θT values which provides the maximum ΔV.
Different researchers have used highly accurate models such as Finite Element Model with direct optimization algorithms such as differential evolution and Genetic algorithms.
Due to the fact that these approaches are computationally expensive, using statistical approximate models, such as Response Surface Model (RSM) and Kriging model are recommended in some engineering cases [2]. Although these approaches are not as accurate as direct optimization methods, but they can be categorized as fast methods. A short explanation on the above mentioned methods is represented as follows:
4.1. Response Surface Methodology (RSM)
RSM or Classic RSM is the basic approach to statistical optimization problems, used in various cases by researchers. Assuming a set of n sample points x = {x1, x2, ···, xn} of an m-dimensional input with  and responses y = {y1, y2, ···, yn} with yi Îℝ, the response value y(x) can be expressed as a realization of a loworder polynomial regression model with a random error function.
Then the approximate model can be expressed as:
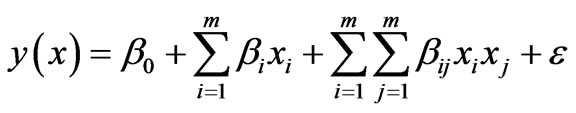 (1)
(1)
where e is the error function and βs are the unknown parameters which are solved by least squares method. To estimate the model parameters, equation (1) can be written in matrix notation as
 (2)
(2)
where Y is an n ´ 1 vector of observations with respect to n sample points x, X is a known n ´ m observation matrix, β is an m ´ 1 vector of regression coefficients (unknown parameters), and e is an n ´ 1 error vector with zero mean and covariance C. The vector of least squares estimators,  , can be determined subject to the minimization of
 (3)
(3)
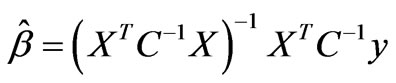
Then the least square estimation (LSE) of β is:
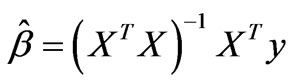 (4)
(4)
Different researchers have used RSM for optimization of the electromagnetic devices. Due to the constraints of the RSM approach in global approximation [2], this approach is not suitable for optimizing the axle counter sensors in all their possible orientations.
The authors have investigated the suitability of the RSM approach for optimization of the axle counter coils in [7]. In the mentioned research the range of coils orientations’ changes are limited to θR = [−20˚, 80˚] and θT = [−80˚, 20˚]. The results of this study are evaluated with the results of other approaches in the section 5 of this paper.
Due to singularity problems in some modes of the LSE estimation process, some researchers have proposed other optimization approaches such as Kriging and MARS methods.
4.2. Kriging Method
Kriging, also called spatial modeling, is a regression method that is becoming more popular in optimization algorithms due to its advantages in modeling nonlinear surfaces [2].
Considering the equation (2), the best linear unbiased estimation of β, has the form of
 (5)
(5)
The above estimation is the minimum variance linear unbiased estimation, which is an optimal estimation in the statistical sense [8].
The covariance matrix C = [cij] can be defined as
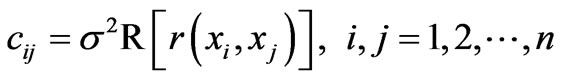 (6)
(6)
where s2 is the variance, R is the correlation matrix and r is the user specified correlation functions. A popular choice for the correlation function, proposed by [13] is:
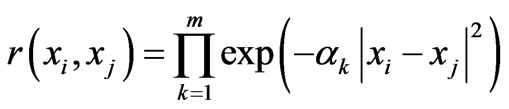 (7)
(7)
where m is the number of design variables and αk represents the unknown correlation function parameter vector. Small values of αk smoothen the Kriging prediction, while for large values of αk the Kriging model has accurate predictions around the sampled points over which it is built, and very false predictions elsewhere.
Kriging method, besides providing better performances, comparing to RSM, avoids the problem of singularity in matrices. In addition Kriging models are fitted to data that are obtained for larger experimental areas than the areas used in low-order polynomial regression metamodels; that is, Kriging models are global rather than local [2]. This is in contrast with the RSM, which due its low order, suits for problem with local optimization requirements.
5. Results and Analysis
For the improvement of the signal to noise ratio of the output signal of axle counter sensor, optimal orientation of coils is investigated.
For this optimization problem, ΔV is the objective function, and receiver and transmitter coils’ angles (θR and θT) are considered as independent variables (inputs). The ranges of θR and θT are −90 to +90 degrees (Figure 8).
In the mentioned range of coils’ orientation, unlimited relative setups for the coils can be assumed and studied. For evaluation of this range in steps of one degree, a set of 32,400 (=1802) situations needs to be analyzed. Considering the limitations of the FEM method in analysis of such an amount of test points, the above mentioned op-
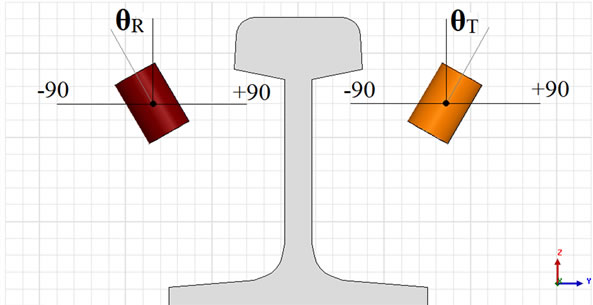
Figure 8. Design variables and search domain.
timization methods are highly effective.
To construct an approximation model that can capture interactions between N design variables, a full factorial approach [3] can be used to investigate all possible combinations. A factorial experiment is an experimental strategy in which design variables are varied together, instead of one at a time. The adequacy of the experiments is validated in the accuracy validation stage of Kriging, followed in this section.
Using the Design and Analysis of Computer Experiments DACE software Matlab toolbox [9], all parameters of Kriging model can be estimated. Figure 9 shows the Kriging response surfaces of ΔV, which is created from the 64 experimental points with full factorial approach.
In order to validate the accuracy of Kriging, the results of the Kriging and that of the FEM analysis for 15 different orientation examples are compared. Figure 10 indicates that Kriging model is a reasonable estimator for this problem. Maximum value of ΔV for Kriging response surface is 840 mV in (θR , θT) = (−45˚, 45˚). Table 2 shows the comparison of the induced voltages between the initial and optimized arrangements with FEM calculations. As the table shows, using the optimization method, a 400 mV larger voltage difference is achieved, comparing to the initial setup used in railway.
In order to investigate the validity of the models and their outputs, the system is installed and tested in Iranian railway lines. Figures 11 and 12 show some sample of the real output signal which is used for post processing and wheel counting purposes. The sensors were installed in different orientations including the (−45˚, 45˚), as was the optimum orientation achieved by the Kriging method.
In this figures the complete axle counter signal for different trains passing through a station is represented.
Table 3 represents the minimum ΔV which is provided by various installations. The real output data also approves the optimality of the orientations proposed by the Kriging approach.
One of the main differences of the real system output and the modeled one is in ignoring the effects of the train body and rail current on the receiving coil. This induces a considerable noise on the receiving signals, hence reducing the induced voltage difference for different wheels.
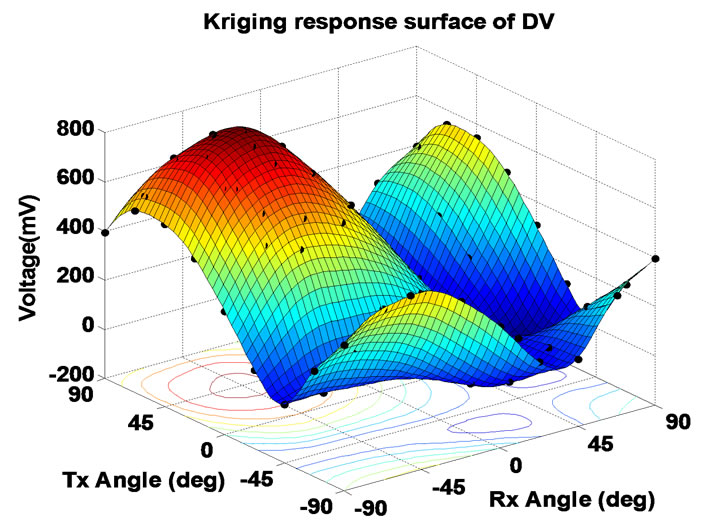
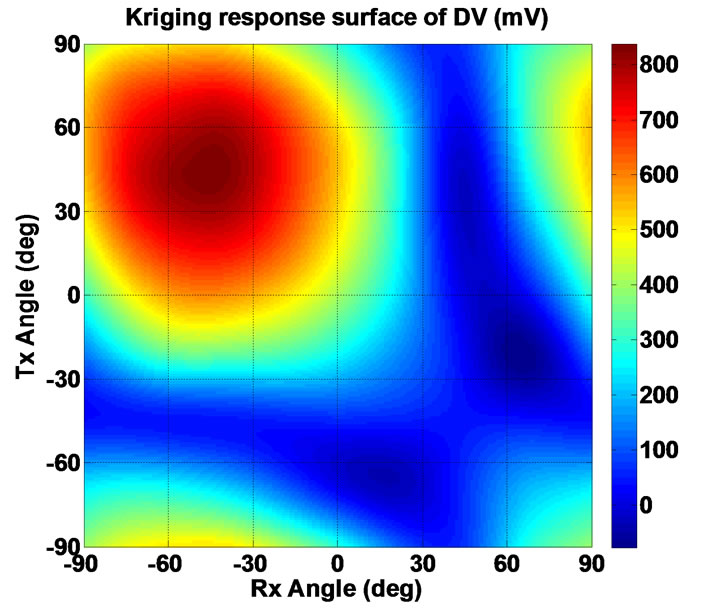
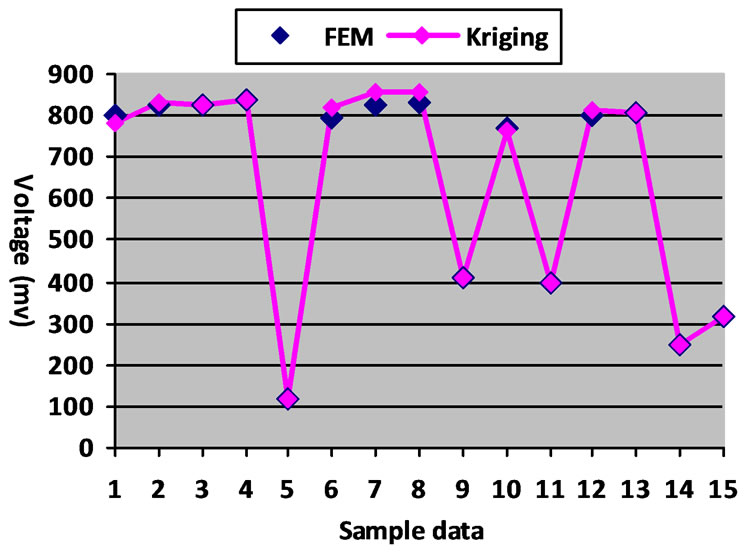
Figure 10. Accuracy validation of Kriging.
The test data shows a ΔV is sometimes reduced to about 500 mV, which is about 300 mV less than what was achieved in the FEM model.
6. Conclusions
In this paper, combination of FEM and Kriging approaches are used to optimize the railway axle counter
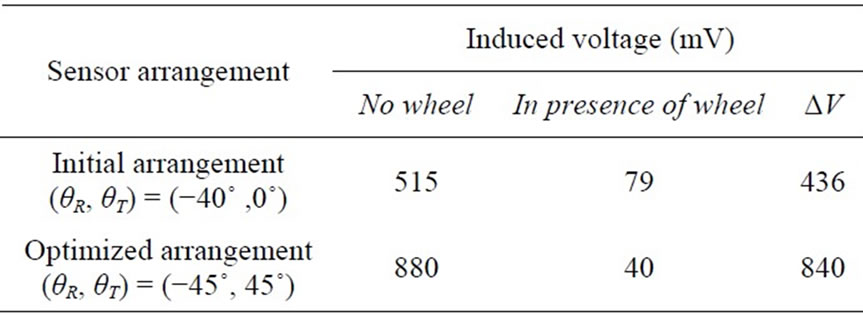
Table 2. Comparison between the initial and optimized arrangements.
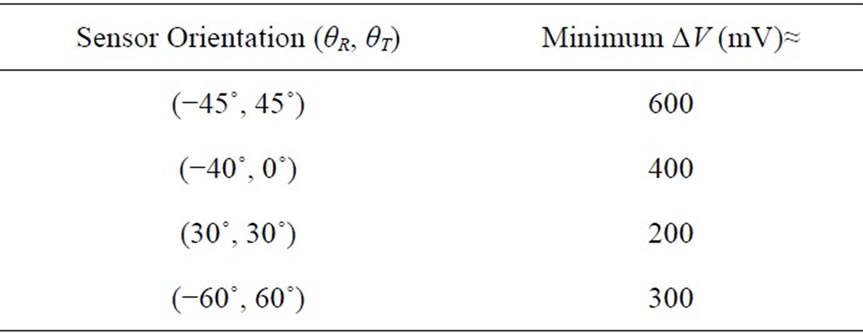
Table 3. Minimum ΔV for different coil orientations.
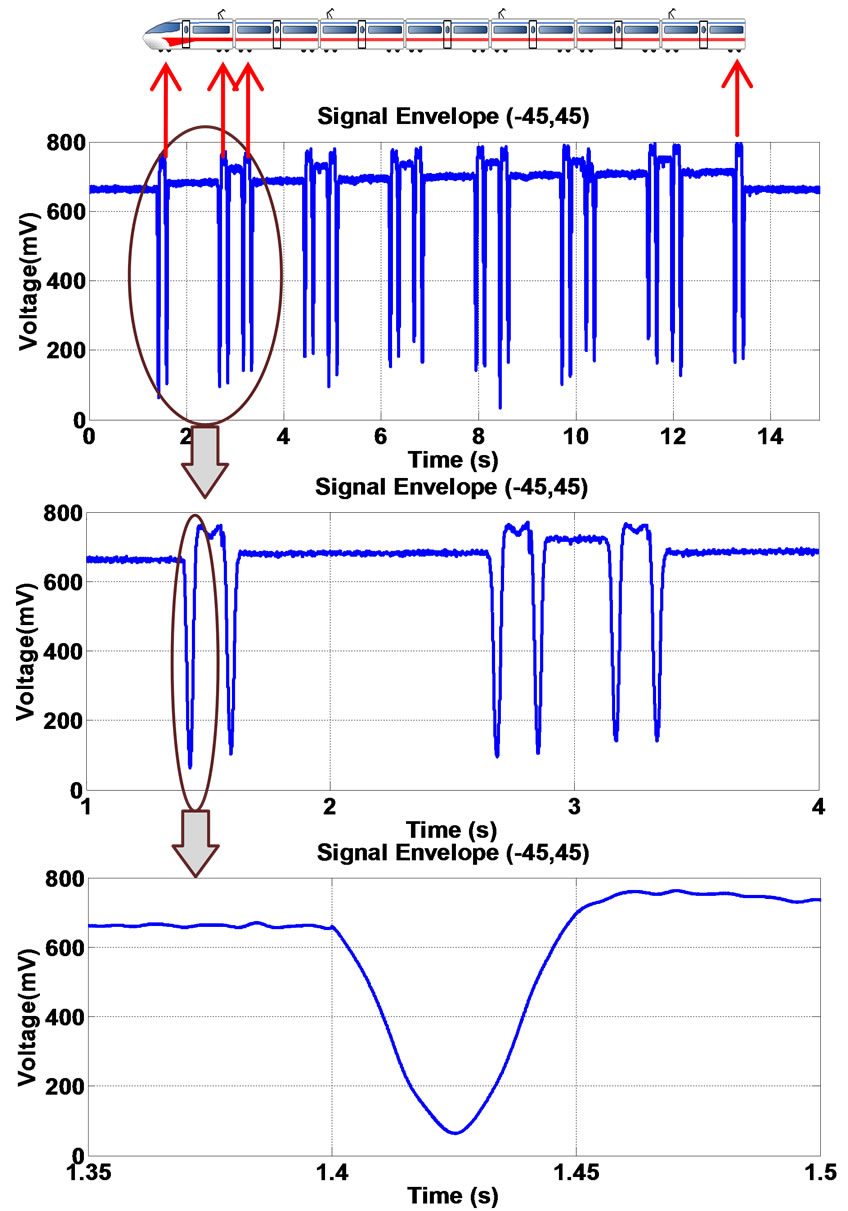
Figure 11. Output signal of the receiver in (−45˚, 45˚).
coils orientation, which is more insusceptible to electro magnetic noise than initial arrangement used by some signalers.
As the result shows, larger voltage difference by at
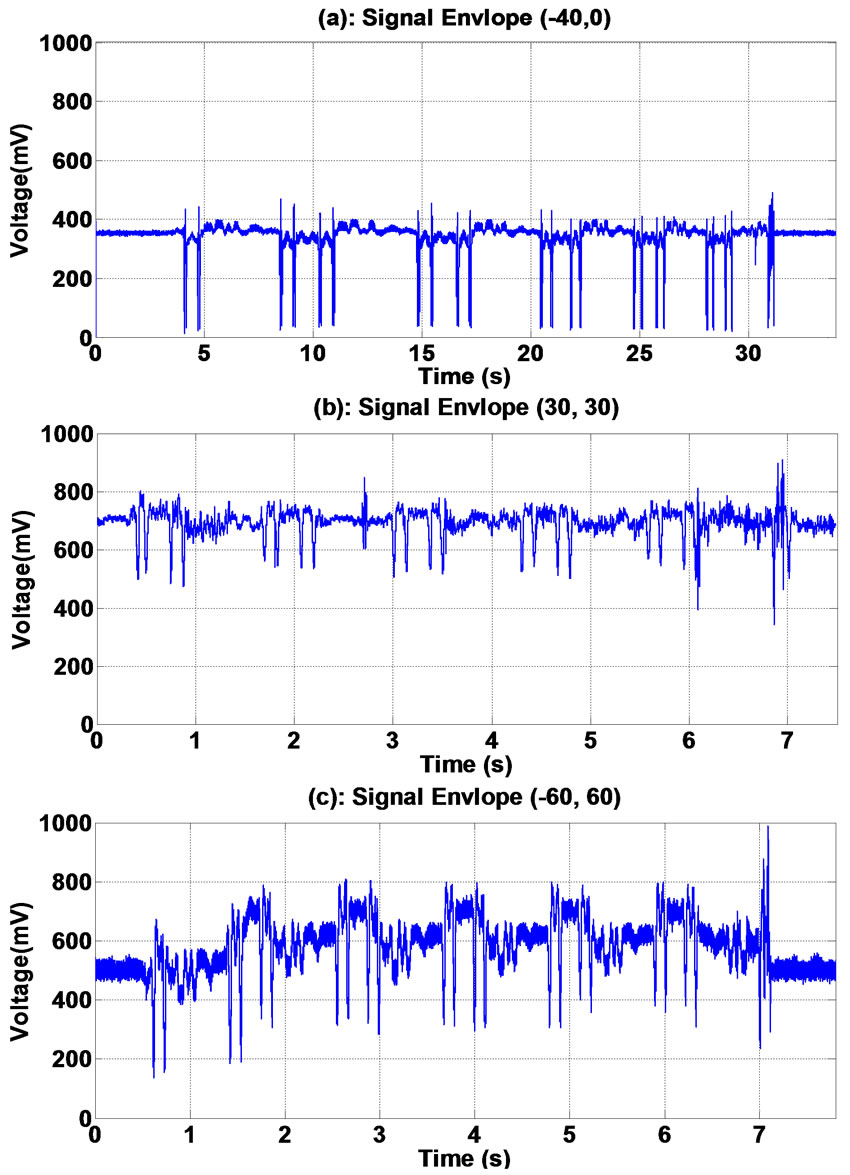
Figure 12. Induced voltage envelope for different coil orientations (a) ( −40˚, 0˚); (b) (30˚, 30˚); (c) ( −60˚, 60˚).
least 400 mV is achieved with the optimized arrangement (−45˚, +45˚), compared to the initial arrangement (−40˚, 0˚), which results in reducing the effect of electromagnetic noise in railway axle counter sensor.
The field test results validate the outcome of this research work. Further improvement in the model can be considered by a detailed investigation of the environmental noises and electromagnetic interferences via various sources. As the results show the effects of noises caused by the train body and also by the track circuit current flow through the rails, can reduce the induced voltage level in the receiving coil, by maximum of 30%.
The effect of individual parameters on the system performance can be the subject for further investigation in future.
7. Acknowledgements
This research work has been implemented by the help and support of the Iranian railway research center, by facilitating the field tests.
REFERENCES
- J. P. C. Kleijnen, “Design and Analysis of Computational Experiments: Overview,” In: T. Bartz-Beielstein, Ed., Experimental Methods for the Analysis of Optimization Algorithm, Springer, 2010, pp. 51-72. doi:10.1007/978-3-642-02538-9_3
- J. P. C. Kleijnen, “Kriging Metamodeling in Simulation: A Review,” European Journal of Operation Research, Vol. 192, No. 3, 2009, pp. 707-716. doi:10.1016/j.ejor.2007.10.013
- R. H. Meyers and D. C. Montgomery, “Response Surface Methodology: Process and Product Optimization Using Designed Experiments,” John Wiley & Sons Ltd., New York, 1995.
- G. J. Van Alphen, “Electromagnetic Compatibility between Rolling Stock and Rail-Infrastructure Encouraging European Interoperability,” Proposal to EU Specific Targeted Research Project RAILCOM, 2004.
- R. Bloomfield, “Fundamentals of European Rail Traffic Management System-ERTMS,” Proceedings of the 11th IET Professional Development Course on Railway Signaling and Control Systems, York, 5-9 June 2006, pp. 165-184.
- R. J. Hill, “Electric Railway Traction: Part 7 Electromagnetic Interference in Traction Systems,” IEE Power Engineering Journal, Vol. 11, No. 6, 1997, pp. 259-266. doi:10.1049/pe:19970610
- A. Zamani and A. Mirabadi, “Analysis of Sensor Orientation in Railway Axle Counters Using Response Surface Methodology,” 5th SASTech, Khavaran Higher-Education Institute, Mashhad, 2011.
- G. Lei, K. R. Shao, Y. Guo, J. Zhu and J. D. Lavers, “Sequential Optimization Method for the Design of Electromagnetic Device,” IEEE Transactions on Magnetic, Vol. 44, No. 11, 2008, pp. 3217-3220. doi:10.1109/TMAG.2008.2002779
- S. N. Lophaven, H. B. Nielsen and J. Sondergaard, “DACE: A MATLAB Kriging Toolbox Version 2.0,” Technical University of Denmark, Denmark, 2002.