Journal of Electromagnetic Analysis and Applications
Vol. 2 No. 1 (2010) , Article ID: 1228 , 8 pages DOI:10.4236/jemaa.2010.21005
Extracting Power Transformer Vibration Features by a Time-Scale-Frequency Analysis Method
![]()
1Department of Precision Machinery and Precision Instrumentation, University of Science and Technology of China, Hefei, China.
Email: wsy1982@mail.ustc.edu.cn
Frequency Bands Screening
Received September 6th, 2009; revised October 8th, 2009; accepted October 15th, 2009.
Keywords: Power Transformer, Wavelet Packet Transform, Hilbert-Huang Transform, Mother Wavelet Selection,
ABSTRACT
In order to take advantage of the merits of WPT and HHT in feature extraction from vibration signals of power transformer, a time-scale-frequency analysis method is developed based on the combination of these two techniques. This method consists of two steps. First, the desirable wavelet packet nodes corresponding to characteristic frequency bands of power transformer are selected through a Correlation Degree Threshold Screening (CDTS) technique for reconstructing a time-domain signal that contains useful information of power transformer. Second, the HHT is then conducted on the reconstructed signal to track the instantaneous frequencies corresponding to natural characteristics of power transformer. Experimental results are provided by analyzing a real power transformer vibration signal. Compared with the features extracted by directly using HHT, the features obtained by the proposed method reveal clearer condition pattern of the transformer, which shows the potential of this method in condition monitoring of power transformer.
1. Introduction
Power transformer is one of the most significant equipments in power system. Failures of power transformer, especially those caused by core and winding vibration, can lead to worse defects or even severe accident, which will disturb regular production and cause huge economic losses [1]. Therefore, it is necessary to carry out preventive tests and online monitoring.
Moreover, core and winding vibration resulting from core magnetostriction and electrodynamic forces will induce body vibration of transformer. As a result, vibration signals from transformer tank have been widely used to analyze and extract the features which are very important in condition monitoring and health diagnosis of power transformer [2–4]. Early research on vibration analysis methods focused on building power transformer model, and developing the relations between vibration parameters and load current, temperature, etc, while neglecting the rich information hidden in vibration signature. Until the early of this century, research focus has been established that the conditions of winding and core are diagnosed by monitoring and analyzing the vibration signals obtained from the surface of power transformer tank.
Advanced signal processing methods, including Wavelet Transform (WT) and Hilbert Huang Transformation (HHT), have been presented to extract vibration features in recent years [5–9]. WT, which can realize separation of feature information from noises, represents the vibration signals of power transformer in terms of wavelet functions at different scales in the time domain, and then calculates the energy percentages of each signal components in different scale domain and tracks their changes to diagnose if there is any fault. However it should be noted that WT can’t provide frequency representation since it is a time-scale analysis technique. Meanwhile the changes of instantaneous frequency and corresponding frequency bands are able to reflect the abnormality of transformer structure [3], such as winding deformation, degeneration of compression and loosening of foundation bolt, etc. Compared to WT, HHT [11] can trace the changes of instantaneous frequency so that it provides unique advantage in analyzing and processing transformer vibration signals. Meanwhile, due to the intrinsic shortcomings [12] in Empirical Mode Decomposition (EMD) process, the fundamental part of the HHT, the results from HHT will lead to misinterpretation, such as mode mixing and meaningless Intrinsic Mode Functions (IMFs) generation, etc.
The objective of this paper is intended to combine Wavelet Packet Transform (WPT) with HHT to fully use the advantages of both techniques in features extraction from vibration signals and compensate for these specific limitations, consequently a time-scale-frequency analysis method based on WPT and HHT is developed. The paper is arranged as follows. Section 2 will present the theoretical frame, including the brief concepts of WPT and HHT, the selection and optimization of mother wavelet, the screening of desirable frequency bands as well as the flow chart of time-scale-frequency analysis methods. Verification and discussion based on practical experiments will be addressed in Section 3, which shows the potential of this method in condition monitoring of power transformer. A summary will be presented in the final section.
2. Principle
Using the advantages of WPT and HHT techniques in features extraction from vibration signals, a timescalefrequency analysis method is developed. In this method, effective extraction of vibration features is realized by selecting the energy distribution in each scale domain as feature parameters and tracking the changes of instantaneous frequency and corresponding frequency bands. The procedure of the proposed method is shown in Figure 1, and several specific steps are described as follows.
2.1 Wavelet Packet Transform
WT is an important signal processing method to extract signal features because of its ability in multi resolution analysis. Moreover, the versatility and effectiveness of WT is significantly extended by WPT, the generalized form of WT. Figure 2 shows the decomposition tree of WPT. It is inferred that WPT can be applied to cope with both the approximation and detail coefficients, while WT can only decompose the approximation portion.
Wavelet packet  is defined as
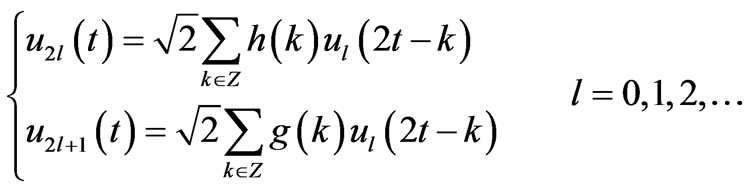 (1)
(1)
where  is the orthogonal scaling function,
  and
and  are two-scale sequences.
Because WPT is a time-scale domain technique, the energy distributions and variations in each subspace are often selected as signal features. However, it can not provide signal frequency characteristics. Theoretically, increasing decomposition levels can solve this problem, but it is obviously unacceptable due to time cost. Therefore, it is necessary to apply an appropriate time-frequency analysis method to extract frequency information.
2.2 Mother Wavelet Selection
WPT is a process that projects the signal into orthogonal subspaces constructed by the basis functions, which are determined by the selection of mother wavelet. Therefore, the selection of mother wavelet can determine the performance of WPT, for instance, representing the local signal in time-scale domains with the most similarity comparing to the original signal as well as separating the low-energy features from noises. In the researches on features extraction and compression processing for different signals [13–14], such as Electromyography (EMG)
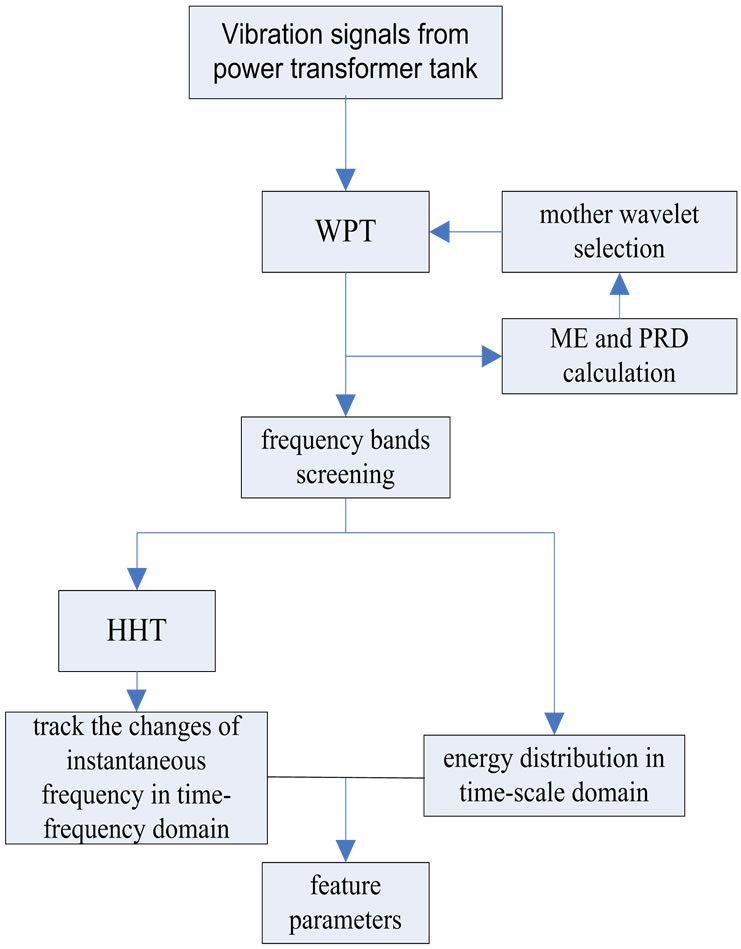
Figure 1. Flow chart of features extraction from vibration signals from power transformer tank based on the timescale-frequency analysis method proposed in this paper
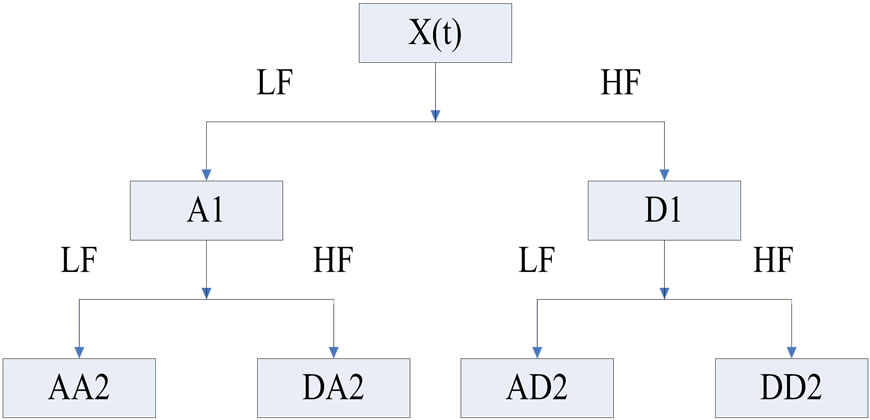
Figure 2. A 2-level WPT decomposition tree
signals, Electrocardiography (ECG) signals, speech signals and images, there are mature research theories for the selection of mother wavelet.
The vibration from the surface of power transformer tank is generated by the vibration of core, winding and cooling devices. Because there is rich vibration information reflecting the conditions of core and winding and huge amounts of noises resulted from electromagnetic interference, selection of mother wavelet function becomes important in features extraction from this kind of vibration signals. However related researches results about how to choose the most appropriate mother wavelet for vibration signals of power transformer tank have not been reported yet.
In this paper 6 kinds of mother wavelets are given, including db20, bior3.7, coif5, rbio5.5, sym10 and dmey, and WPT with these 6 mother wavelets is applied to the signals. From results, the primary frequency features can be acquired by frequency spectrum analysis, and this information can be used to realize wavelet packet reconstruction with the original mother wavelet as the basis function. In order to remove the influence of electromagnetic noises the mean error (ME) and the percent residual difference (PRD) between original signals and reconstructed ones are calculated. Meanwhile ME and PRD have been selected as the criterion to measure the performance of different mother wavelets, that is, smaller ME and PRD values indicate more similar statistical characteristics between the corresponding mother wavelet and analyzed signals. Consequently the optimal mother wavelet is established for vibration signals of power transformer tank, which reduces the blindness of wavelet basis selection and the uncertainty of subsequent features extraction.
2.3 Correlation Degree Threshold Screening
Since each narrow-band signal decomposed by WPT is the orthogonal projection of the inspected signal, the relevant narrow-band signals which contain valuable vibration features should show strong correlation with the original signal, while the meaningless components are expected to indicate weak correlation. According to the above analysis, correlation factor ![]() between each decomposed narrow-band signal and the original signal is obtained and taken as the criterion for screening the meaningful signals. For each correlation factor
between each decomposed narrow-band signal and the original signal is obtained and taken as the criterion for screening the meaningful signals. For each correlation factor ![]() (where
(where  is the number of nodes by WPT), the Correlation Degree Threshold (CDT)
 ![]() is defined as
is defined as
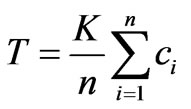 (2)
(2)
where  is the correction factor and determines the strict degree of screening standard, that is, the bigger K is, the stronger correlation degree between screened frequency bands and original signal there is. In this study, K is set to 1.0.
The frequency bands those corresponding correlation factors are more than or equal to CDT will be retained, and other frequency bands will be discarded.
The screen processing can reduce the noise disturbance and reserve some low-energy but relevant components. Consequently, the efficiency of HHT is further improved and the convincing result will be validated in Section 3.
2.4 Hilbert Huang Transform
HHT, which consists of the EMD and the Hilbert Transform (HT), is firstly proposed by Norden E. Huang in [11]. It has proven to be quite versatile in a broad range of applications to extract useful information from signals generated in noisy nonlinear and non-stationary processes, just like the vibration of power transformer’s core and winding, disturbed by electromagnetic field and discharged current.
In the results from HHT, the amplitude a(t) and instantaneous frequency f(t) are also the single-valued function of the time t, so the time-frequency distribution of the amplitude can be extracted. Compared with WT, HHT has its own advantages:
1) HHT can obtain more accurate spectrum structure for higher resolution; 2) HHT is able to extract the frequency distribution properties of vibration signals from power transformer tank; 3) Because the abnormality of transformer structure will be reflected by the changes of modal parameters like natural frequency and corresponding bands, HHT can find those changes to detect the presence of incipient faults.
3. Results and Discussion
3.1 Experiment Principle [2]
Vibrations in a transformer are generated by different forces appearing in the core and winding during the operation.
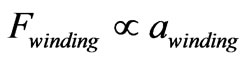
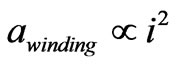
Winding vibrations are due to electromagnetic forces that are generated by the interaction of the current in a winding with leakage flux. These forces are proportional to the square of the load current
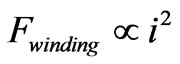 (3)
(3)
where  is electromagnetic forces and
  is load current (50 Hz in China).
Meanwhile it is known that the electromagnetic forces are proportional to the windings vibration acceleration
 (4)
(4)
So we can conclude that
 (5)
(5)
Then the fundamental frequency of winding vibration acceleration is, 100 Hz, twice the current.
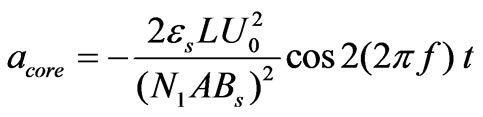
Core vibration is caused by magnetostriction forces. Referring to the conclusion in [10], the core vibration acceleration  caused by magnetostriction is
 (6)
(6)
where
 coefficient of saturation magnetostriction of the silicon steel sheet;
![]() length of the silicon steel sheet;
length of the silicon steel sheet;
 magnitude of voltage-driving source;
 frequency of voltage-driving source (50Hz in China);
 number of drive turns;
 cross sectional area of arm of the core;
 saturated magnetic flux density.
Equation (6) indicates that the magnitude of core vibration acceleration is proportional to the square of driving voltage amplitude while the fundamental frequency is 100 Hz (in China), with harmonics being an even multiple of 50 Hz. Higher frequency harmonics are due to the nonlinear character of magnetostriction phenomenon.
Core and winding vibrations caused by the forces transmit through transformer oil and the supporting elements to the tank. When the vibration acceleration signals are obtained from the transformer tank, the fundamental frequency component consists of vibration signals of the windings and that of the core.
When pre-compression is loose or winding deformation occurs, the winding vibration acceleration will enlarge. On the other hand, once the core’s compression decreases, temperature varies or insulating layer gets scathing, the core vibration signal will change. Therefore monitoring vibration of the transformer tank is able to acquire essential information about compression and other conditions for both windings and core.
3.2 Testing
Experiments were carried out on a 3-phase power transformer under normal working condition, which related parameters are listed in Table 1. Since the vibration signals obtained from power transformer tank belong to electrical and mechanical vibration ones, it is known that the frequency bandwidth of the inspected signals is about 10-2000 Hz. As a result, piezoelectric accelerometers are prior choice and ICP 601A01, which scope is ±50g and has a sensitivity of 100 mv/g as well as the frequency response within 0.27~10 kHz, is adopted. The AD data acquisition card with USB ports ART USB2000A is selected to convert the analog signals to digital ones with the resolution of 16 bits and 100 kHz maximum sampling frequency. The laptop is used for signals processing and storage center.
Three ICP 601A01 type vibration acceleration sensors are placed on the surface of phase A, B and C in high voltage side of power transformer tank via the magnetic pedestal, and another three vibration acceleration sensors are attached in low voltage side. It should be noted that all the sensors are tightly fixed on the surface of the tank and at the same horizontal level. The sampling frequency is set to be 10 kHz. Thus desirable digital signals are collected and to be analyzed.
The time-domain vibration wave of phase A in high voltage is shown in Figure 3(a). As shown in FFT spectrum in Figure 3(b), the spectrum of the signal indicates the fundamental frequency is 100 Hz with multiple harmonics in tank vibration signals of power transformer. Above 1000 Hz, frequency components are near zero.
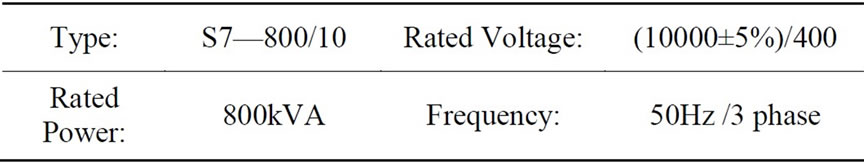
Table 1. Power transformer parameters
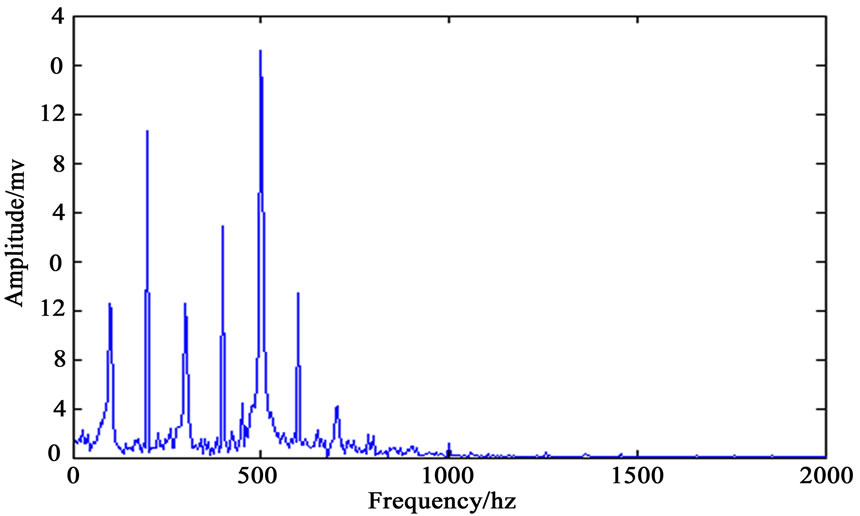 (a)
(a)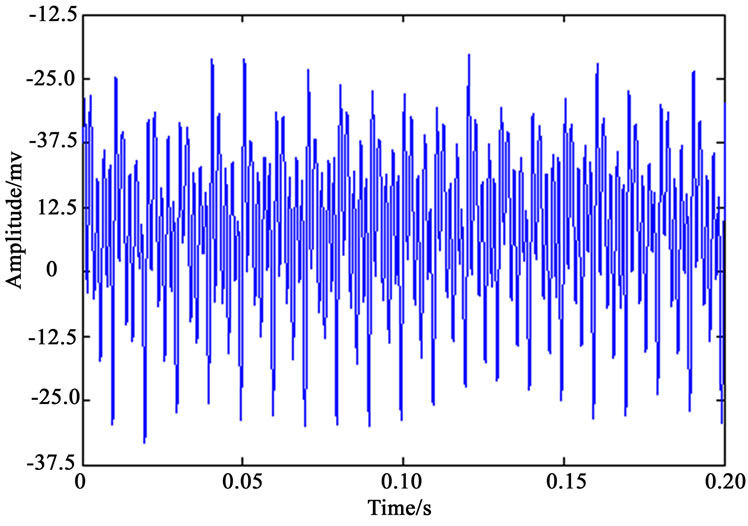 (b)
(b)
Figure 3. The time-domain wave of power transformer tank and corresponding FFT spectrum
3.3 WPT Processing
First 6 kinds of mother wavelets are given, including db20, bior3.7, coif5, rbio5.5, sym10 and dmey, and 6-level WPT with these 6 mother wavelets is performed to 20 groups of vibration signals obtained from phase A in high voltage side of power transformer tank. Then based on the rough frequency characteristics inferred from the FFT spectrum of the vibration signal of power transformer tank in Figure 3, low-frequency parts (lower than 1200 Hz) are selected for wavelet packet reconstruction using the original mother wavelet as the basis function. Finally the mean error (ME) and the percent residual difference (PRD) between original signals and reconstructed ones are calculated and quantified, which are described in Figure 4 and Figure 5.
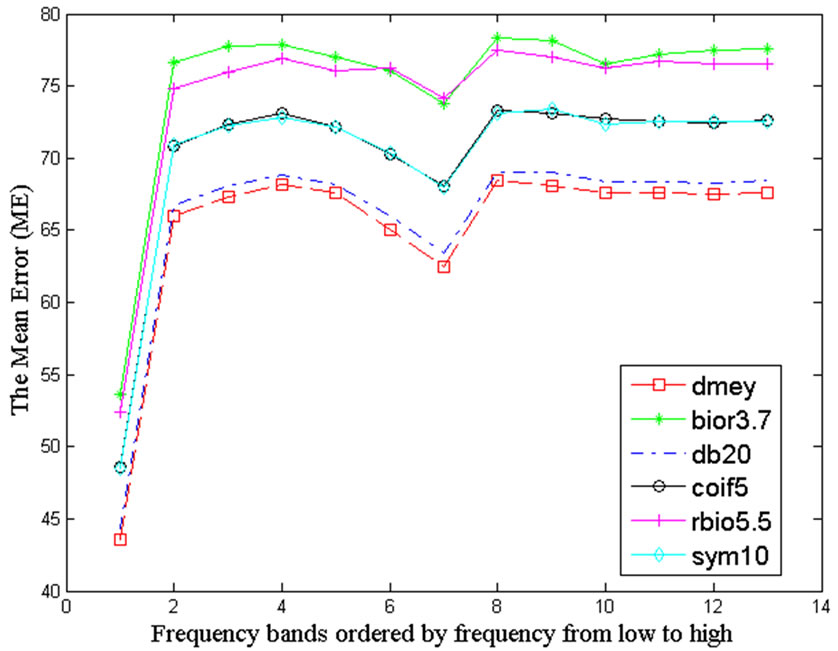
Figure 4. The mean error (ME) between original signals and reconstructed ones using 6 mother wavelets
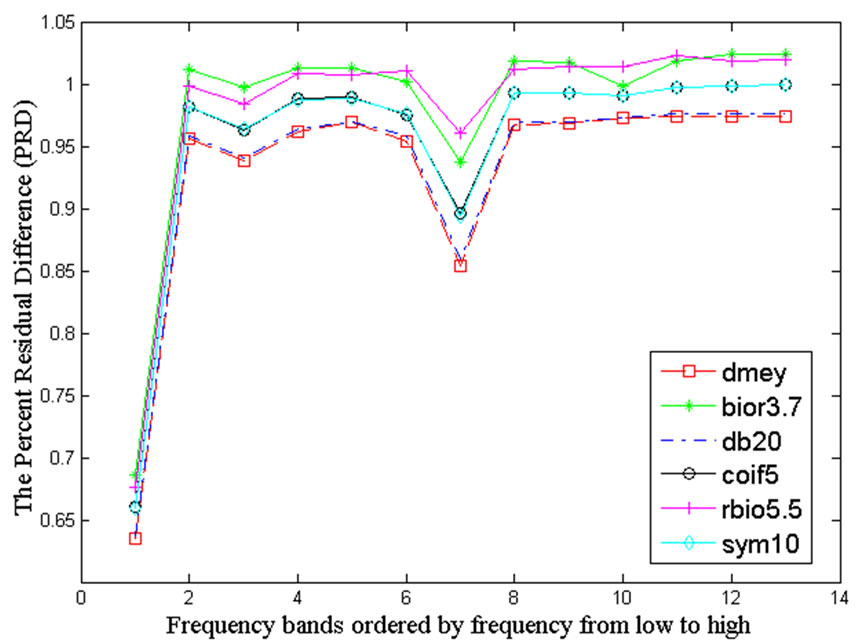
Figure 5. The percent residual difference (PRD) between original signals and reconstructed ones using 6 mother wavelets
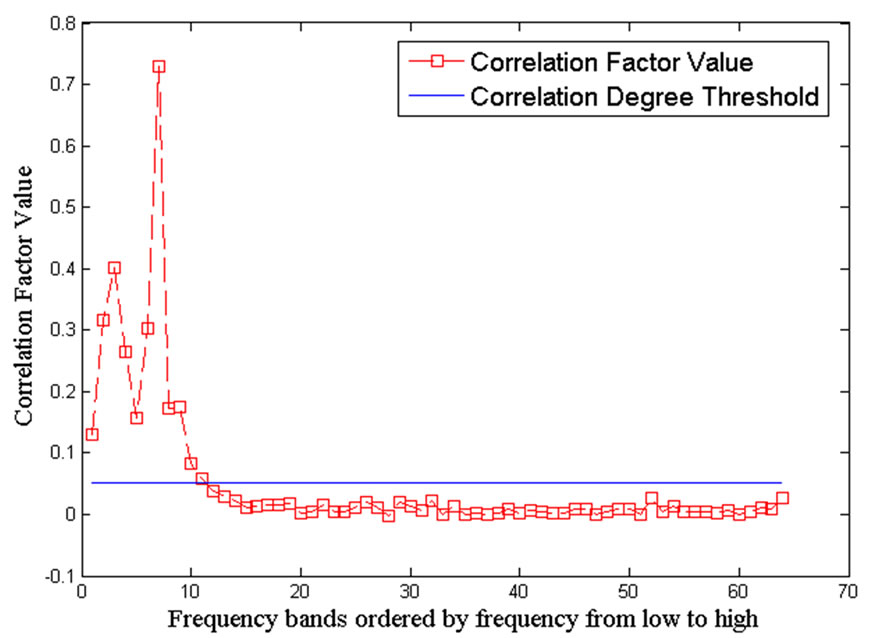
Figure 6. The Correlation Degree Threshold (CDT) and correlation factors that show the correlation degree between the reconstructed signals and original signal
It is inferred from Figure 4 and Figure 5 that mother wavelets dmey and db20 showed their potential for decomposing the signals from power transformer tank and guaranteed the minimum distortion, that is, there are more similar statistical characteristics between the corresponding mother wavelet and analyzed signals. However mother wavelets bior3.7 and rbio5.5 are not suitable for this kind of vibration signals and should not be used. Therefore the results can provide theoretical and practical basis if wavelet theory is adopted for monitoring and analyzing the conditions of power transformer.
According to the above experiment results, the Dmey mother wavelet has been chosen to apply 6-level wavelet packet decomposition with the original vibration signals. Wavelet packet reconstruction is carried out on the 64- group wavelet coefficients generated by wavelet packet decomposition and then the correlation factors that show the correlation degree between the reconstructed signals and original signal are calculated. Meanwhile the Correlation Degree Threshold (CDT) is given by Equation (2). The 64 correlation factors and the CDT are displayed in Figure 6, in which red square box and blue line have been used as markers respectively. Those frequency bands which correlation factors are over than CDT will be reserved and other bands discarded. Through the frequency bands screening process, 11 frequency bands are obtained. The energy distribution percentage is acquired by calculating and normalizing the energy of 11 reserved frequency bands. The above energy distribution in timescale domain is selected as feature parameters (listed in Table 2) because it can reflect the conditions of power transformer [3].
3.4 HHT Processing
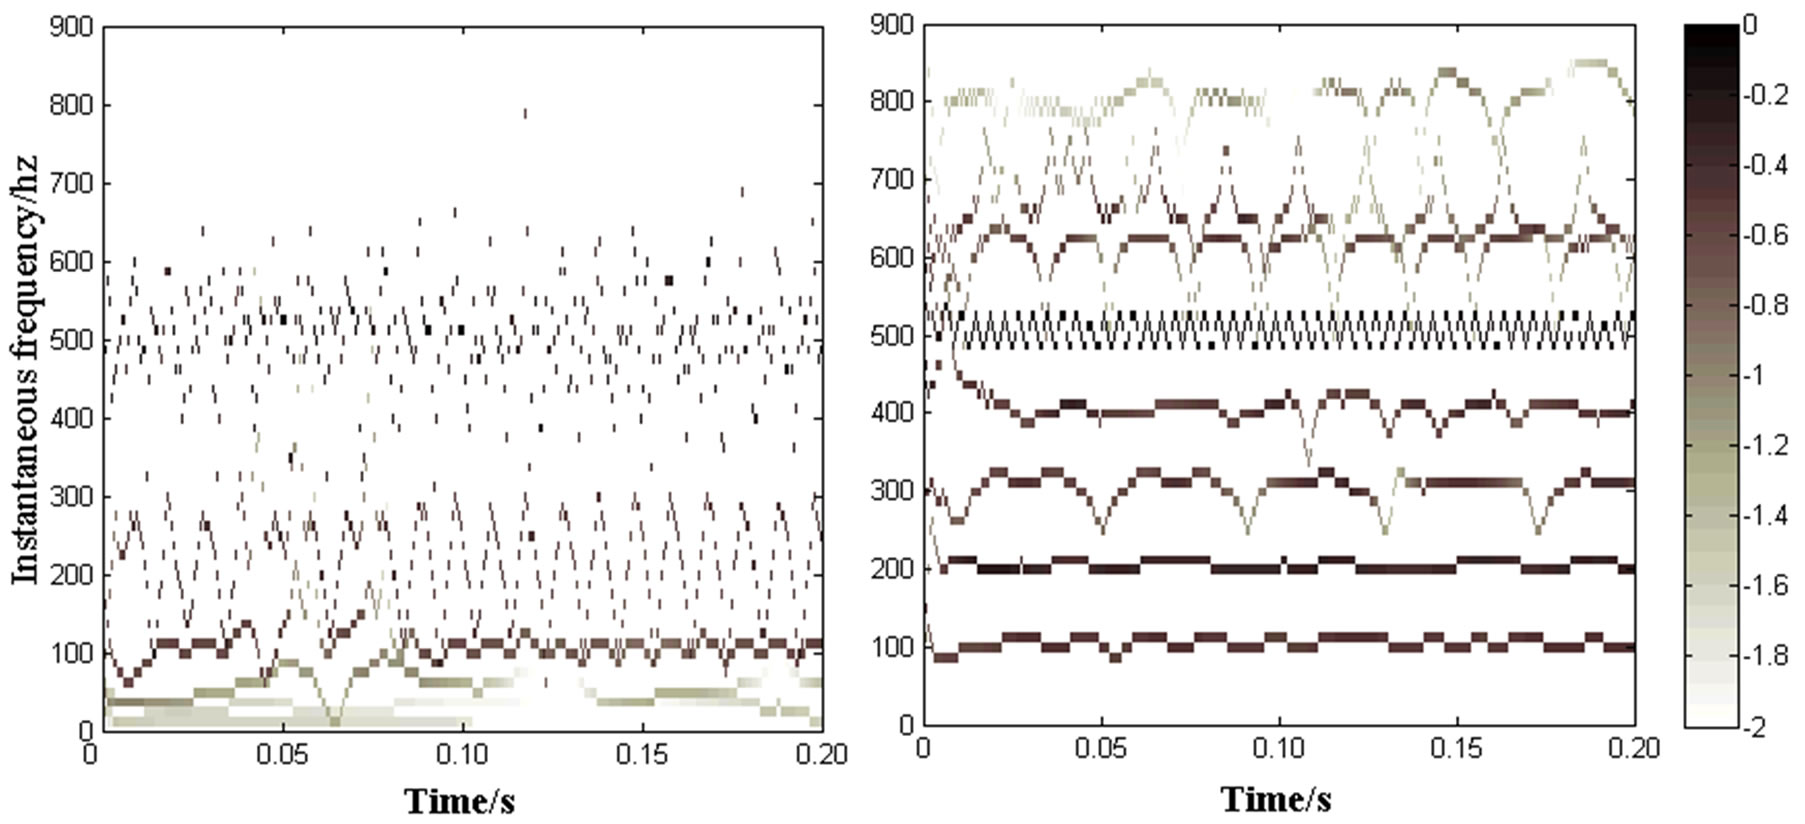
Wavelet packet reconstruction is implemented before EMD using the 11 frequency bands obtained by screening process. Through EMD the reconstructed signal is decomposed into 8 the supplement to WPT-energy monitoring method IMFs, shown in Figure 7(b). Subsequently HT is applied to every IMF to get the hilbert spectrum which presented in Figure 8(b). It is easily observed that the instantaneous frequency and its changes can be tracked and analyzed comparing with single WPT.
4. Discussion
1) From Figures 4 and 5, it is summarized that appropriate mother wavelet selection can reduce the decomposition and reconstruction error, improve the pertinence of feature extraction and avoid misleading identification results of the status of power transformer. Moreover, the CDTS technique can reserve the frequency bands that show stronger correlation with the analyzed signal and can eliminate the noises part.
2) Comparing the results in Figure 7(a) to those in Figure 7(b), it is exciting that more desirable and meaningful IMFs are acquired through performing EMD on the reconstructed signal by WPT and CDTS processing, which shows the importance of mother wavelet selection and CDTS.
3) According to the methods described in literature [8] and [9], the Hilbert spectrum obtained by directly applying HHT to the original signal is shown in Figure 8(a), which has big difference from the frequency characteristics laid in Figure 3(b). Some main differences are listed as follows: a) The illusive low-frequency portion (less than 100Hz) in Figure 8(a) would lead to misunderstanding about the frequency characteristics in comparison with the results shown in Figures 3(b) and 8(b) b) With HHT method, mode mixing phenomena in Figure 8(a) would make it difficult to identify the meaningful frequency bands, while results of developed method as shown in Figure 8(b) are consistent with the frequency characteristics of power transformer vibration described in Figure 3(b). Moreover, the changes of the instantaneous frequency and corresponding bands can be monitored and analyzed.

Table 2. The energy distribution percentage (%) of 11 reserved frequency bands ordered by scale from big to small
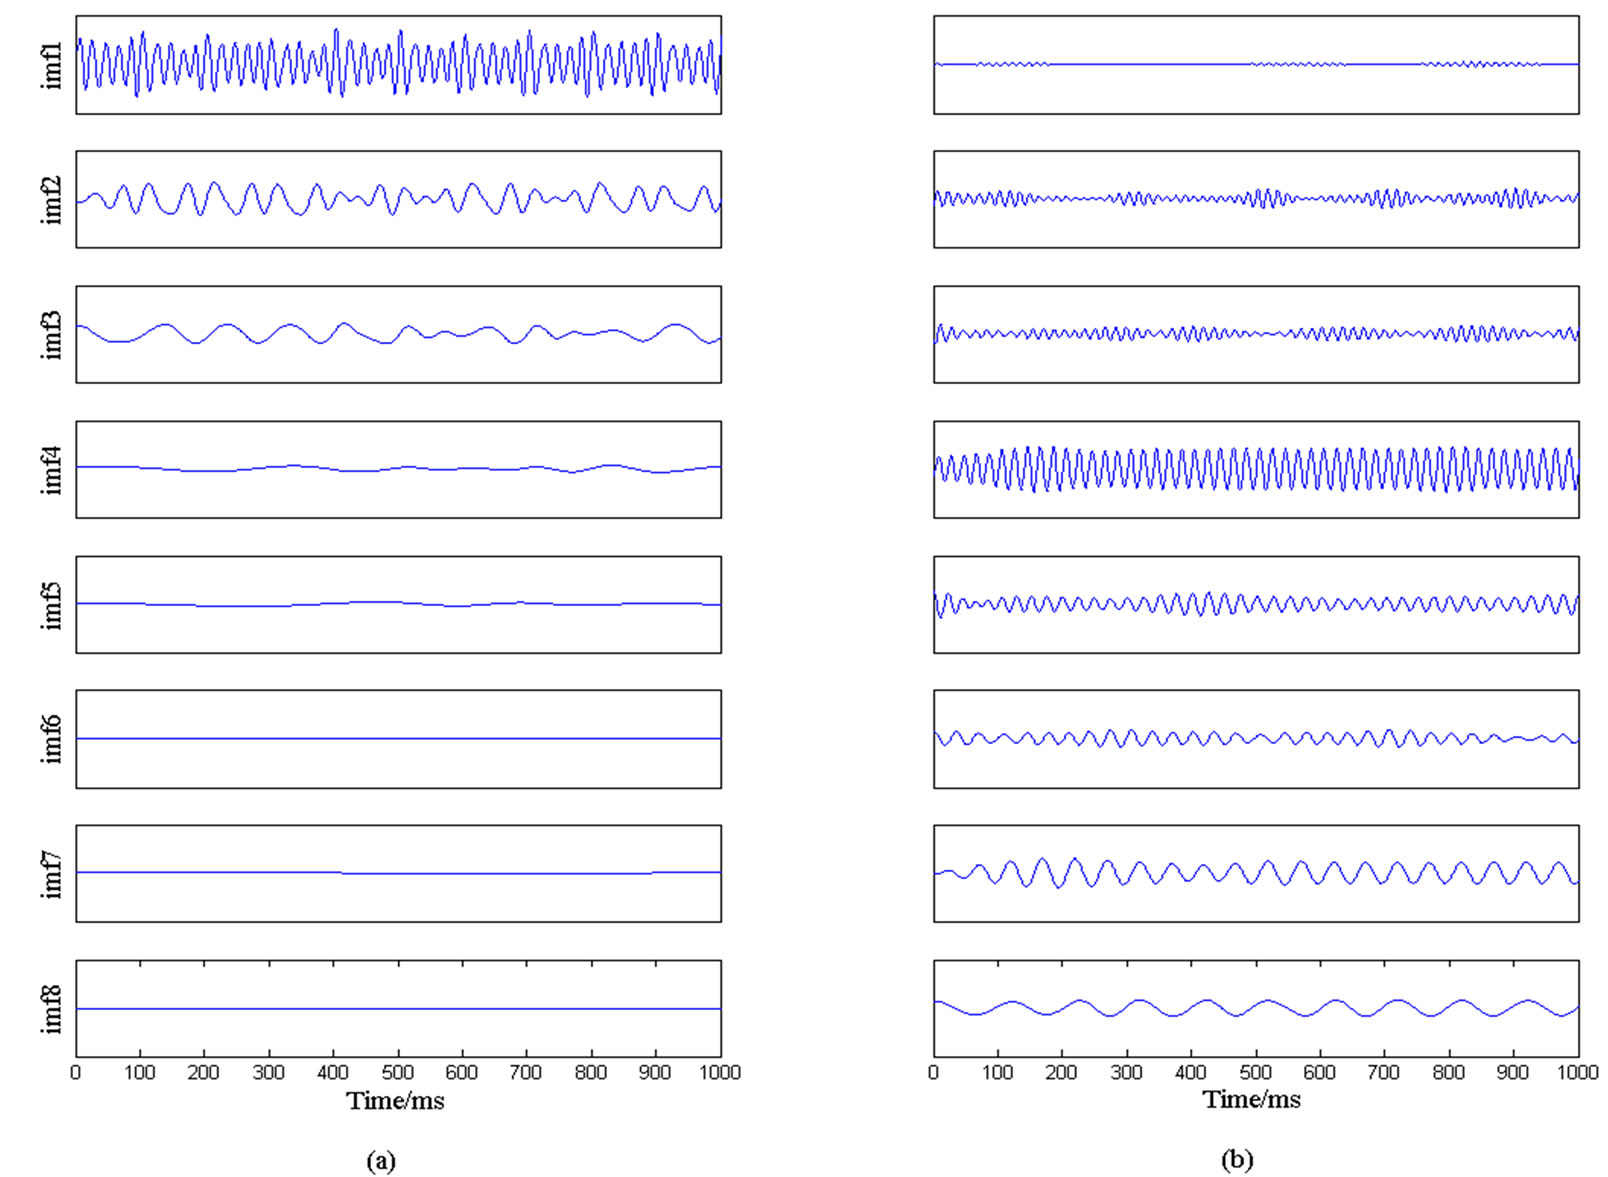
Figure 7. (a) IMFs obtained by EMD with the original vibration signal; (b) IMFs obtained by EMD with the reconstructed signal by WPT and correlation degree threshold screening

Table 3. The frequency characteristics obtained by the developed method in the paper
 (a) (b)
Figure 8. (a) The Hilbert spectrum by directly using HHT to the original signal; (b) The Hilbert spectrum by the timescale-frequency method developed in this paper
4) From Table 2 it is observed that energy distribution percentages of many frequency bands are under 1% or even smaller, which will increase the requirement for resolution of condition monitoring. It would be very difficult to monitor and analyze the conditions of power transformer by using only WPT-energy method like references [5] and [7]. In order to avoid the limitation, the changes of the instantaneous frequency and corresponding frequency bands as listed in Table 3 can be used as the supplement to WPT-energy monitoring method.
5. Conclusions
In this paper, a time-scale-frequency analysis method based on the combination of WPT and HHT is proposed and applied to feature extraction from vibration signals of power transformer tank. Experiment results show the potential of this method in condition monitoring of power transformer. The following conclusions can be drawn:
1) According to the results based on this study, the mother wavelets that are suited to decompose vibration signals of power transformer tank are established;
2) Compared to the results by directly using HHT, the results obtained by the developed method can reveal better frequency characteristics of power transformer vibration to effectively trace and detect the abnormality of transformer structure.
REFERENCES
- C. Myers, “Transformers condition monitoring by oil analysis,” Large or Small: Contentment or Catastrophe, Proceedings of the 1998 1st IEE/IMeChE International Conference on Power Station Maintenance-Profitability through Reliability, pp. 53–58, 1998.
- S. Ji, “The study of winding and core vibration characteristics and application in fault monitoring of transformer,” PHD Thesis, Xi’an JiaoTong University, China, 2003.
- J. C. Lavalle, “Failure detection in transformers using vibration analysis,” MS Thesis, MIT, Cambridge, MA, USA, 1986.
- Z. Berler, A. Golubev, V. Rusov, et al, “Vibroacoustic method of transformer clamping pressure monitoring,” Conference Record of the 2000 IEEE International Symposium on Electrical Insulation, Anaheim, CA USA, pp. 263–266, 2000.
- S. Ji, W. Liu, et al, “The application of the wavelet packet to monitor the core and winding condition of transformer based on the vibration analysis method,” Proceedings of Chinese Society for Electrical Engneering, Vol. 21, No. 12, pp. 24–27, 2001.
- P. Kang and D. Birtwhistle, “Condition monitoring of power transformer on-load-tap-changers using wavelet analysis,” IEEE Transactions on Power Delivery, Vol. 16, No. 3, pp. 394–400, 2001.
- Q. Yan, X. Liu, and J. Yin, “Features of Vibration Signal of Power Transformer Using the Wavelet Theory,” High Voltage Engineering, Vol. 33, No. 1, pp. 165–168, 2007.
- W. Xiong and G. Zhao, “Analysis of transformer core vibration characteristics using hilbert-huang transformation,” Transactions of China Electrotechnical Society, Vol. 21, No. 8, pp. 9–13, 2006.
- W. Xiong and R. Ji, “Nonlinear time series analysis of transformer’s core vibration,” The 6th World Congress on Intelligent Control and Automation. Dalian China, pp. 5493–5496, 2006.
- S. Ji, Y. Luo, and Y. Li, “Research on extraction technique of transformer core fundamental frequency vibration based on OLCM,” IEEE Transactions on Power Delivery, Vol. 21, No. 4, pp. 1981–1988, 2006.
- N. E. Huang, Z. Shen, S. R. Long, et al, “The empirical mode decomposition and the hilbert spectrum for nonlinear and non-stationary time series analysis,” Proceedings of Royal Society of London, Series A, pp. 903–994, 1998.
- Z. Peng, P. Tse, and F. Chu, “A comparison study of improved hilbert-huang transform and wavelet transform: Application to fault diagnosis for rolling bearing,” Mechanical Systems and Signal Processing, Vol. 19, No. 5, pp. 974–988, 2005.
- L. Brechet, M. Lucas, C. Doncarli, and D. Farina, “Compression of biomedical signals with mother wavelet optimization and best-basis wavelet packet selection,” IEEE Transactions on Bio-medical Engineering, Vol. 54, No. 12, pp. 2186–2192, 2007.
- B. S. Shajeemohan, V. K. Govindan, and B. Vijilin, “A scheme for image classification and adaptive mother wavelet selection,” International Conference on Advanced Computing and Communications, pp. 308–313, 2006.