Int'l J. of Communications, Network and System Sciences
Vol.3 No.6(2010), Article ID:2004,10 pages DOI:10.4236/ijcns.2010.36071
A Multi-Objective QoS Optimization with Fuzzy Based Parameter Setting for Real-Time Multicasting
1Department of Computer Science and Engineering, Silicon Institute of Technology, Bhubaneswar, India
2Department of Computer Science and Engineering, Indian Institute of Technology, Kharagpur, India
3Department of Computer Science and Application, Utkal University, Bhubaneswar, India
E-mail: {satya,bijan,ajit}@silicon.ac.in, rajib@cse.iitkgp.ernet.in, sateesh1960@gmail.com
Received April 6, 2010; revised May 8, 2010; accepted June 10, 2010
Keywords: QoS, Fuzzy, Multicast, Real-Time, Multi-Objective
Abstract
We propose a multi-objective Pareto-optimal technique using Genetic Algorithm (GA) for group communication, which determines a min-cost multicast tree satisfying end-to-end delay, jitter, packet loss rate and blocking probability constraints. The model incorporates a fuzzy-based selection technique for initialization of Quality of Service (QoS) parameter values at each instance of multicasting. The simulation results show that the proposed algorithm satisfies on-demand QoS requirements (like high availability, good load balancing and fault-tolerance) made by the hosts in varying topology and bursty data traffic in multimedia communication networks.
1. Introduction
Multicast services have been used for real-time multimedia applications to transport audio-video frames, among a group of users. During real-time communication the related audio-video frames are required to be delivered at the end nodes in a synchronous manner [1]. Further, the frequent change of service types, session timings with QoS requirements by the group members increases the communication complexity of the network [2,3]. In a wireless medium the situation further deteriorates than fixed network due to unpredictable mobility of the host nodes as well as their variations in resource requirements. It is also important to keep the network live with all possible satisfactions to the users during that period. Such a scenario requires multi-objective optimizations with constraints satisfactions [4,5]. The situation becomes critical when the destination nodes require multi-rate multicast sessions [6]. Hence development of multi-objective optimization algorithm for multi-rate traffic during multicasting is a challenge for efficient allocation of resources in a dynamically changing network [7,8]. However, a Pareto optimal algorithm can provide better results by fulfilling users’ requirement, irrespective of irrelevant transformation of parameters [4].
To fulfill the on-demand request of the users we use Pareto optimal GA, which guarantees for achieving better QoS from a large search space. When the size of the network is large the situation demands optimization of QoS parameters such as: delay, jitter, path length (hops), packet loss rate and variation of load among the nodes involved, with high fault-tolerance from the network within acceptable cost. Most of the research works focus on multicasting to a group for near optimal, fast solution with multi-tree backups using GA [9-11].
However, real-time multimedia applications require multi-rate data flow to the served nodes in an on-demand basis with optimized resource allocation and cost incurred. For addressing multi-objective optimization issues GAs are suitable [9].
In this paper, we propose a multi-objective evolutionary algorithm supporting multi-rate data flow across the network using GA. The algorithm approximates Pareto front by generating a set of non-dominated solutions. Multiple services can be formulated as a multi-objective model [12]. Our model assumes that complete knowledge about the network is available to all the nodes present inside the region.
The paper is organized as follows. In Section 2, we define the multi-objective optimization (MOO) and Pareto-optimality concepts. Our proposed model, its environment setup procedure and implementation with GA are presented in Section 3. The performance evaluation and analysis of the model are elaborated in Section 4. Section 5 concludes the paper and discusses potential future work.
2. Multi-Objective Quality of Service
Multi-objective optimization is used to solve optimization problems that have two or more number of conflicting objectives, where there may not exist an unique optimal solution. Discovering and fixing optimal solutions in such scenarios is an open problem [6,11]. In general, almost all real-world problems are of multiple objectives, where each objective needs to be satisfied. For such type of problems a single best solution does not exist with simultaneous satisfaction of all objectives. In fact, we may have a set of optimal solutions in the entire search space, when all objectives are considered. These solutions are known as Pareto-optimal solutions. None of the solutions in this set is absolutely better then any other. So, any one of the solution can be an acceptable solution. In this context, mathematically we can define our problem more precisely, and introduce some related definitions in order to explain our GA based proposed model. It is noted that all of the objectives are in a minimized form in the following discussion.
Multi-Objective Optimization (MOO): Let Z1(X), Z2(X), …, Zn(X) are n number of objectives to be optimized with gi(X) ≤ 0, i = 1, 2,…, k1 as inequality constraints and hi(X) = 0, i = 1, 2, …, k2, as equality constraints for the m-dimensional vector X = (x1, x2, …, xm) then MOO [13] can be defined as follows:
 (1)
(1)
Pareto Dominance: If  and
and  are two characteristic functions then
  dominates V(u
  v) if and only if the condition is satisfied for
  and
and 
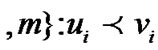 .
.
Pareto Optimality: A solution  is said to be Pareto Optimal if and only if
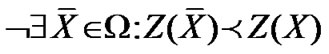
Pareto Optimality Set: A Pareto Optimality set P is defined as 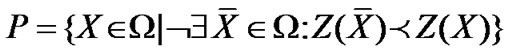 where
where  is any other element of.
Pareto Front: It is defined as .
.
3. Proposed Model
In this section we introduce the multi-objective model with its attributes, and their mapping to GA with Pareto-optimal verification.
3.1. Network Model
The network consists of n number of similar mobile hosts moving within a three-dimensional space. The nodes can communicate among themselves either directly or indirectly via intermediate nodes. All nodes are capable of transreceiving as well as forwarding the request of their neighbors to its near by nodes with broadcasting. For any instant of time the nodes along with their links can be represented as G = (V, E), where V and, E represent the set of nodes and edges in the network respectively. A multicast tree T = (VT, ET) in the graph G is rooted at source node s with destination nodes {d1, d2, …, dt} act as group members for the source node. A tree is having k
 number of branches and each branch is of r number of edges. The QoS parameters considered for multi-objective optimization during multicasting from a single source to its group members are as follows:
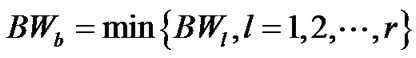
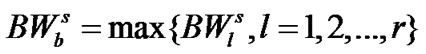
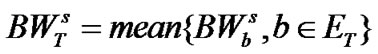
Bandwidth (BW): The bandwidth of a tree is the average bandwidth of all its branches; whereas bandwidth of any branch of a tree is the minimum of all its edge bandwidths  from source to the corresponding destination node. Both branch bandwidth
 and tree bandwidth
  are represented in Equations (2) and (3) as follows:
 (2)
(2)
 (3)
(3)
Delay (DL): Delay between two corresponding node (branch delay: ) is the sum of the delay at the intermediate nodes (node delay:
 ) as well as the propagation delay through the links (link delay:
 ) from source to destination. For a multicast tree the tree delay
  is the maximum delay among all branch delays (
 ). The two different delays can be shown as:
 (4)
(4)
 (5)
(5)
Jitter (JT): It is defined as the average delay variation between any source and destination nodes during transmission of data packets. It is due to processing delay variation at the intermediate nodes as well as the propagation delay variation during communication through the links. In a multicast tree the jitter for any branch  is the sum of the jitter at the intermediate vertices
  and in each edge
 ; whereas the jitter for a multicast tree is the maximum among all branches and are given in the following equations.
 (6)
(6)
 (7)
(7)
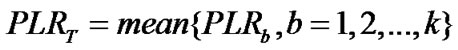
Packet Loss Rate (PLR): It is defined as a ratio of the number of lost packets to the total number of transmitted packets. PLR for a tree branch  is the cumulative
  along each edge of the path from root to the leaf node; where as the PLR for a multicast tree
  is the average loss rate of all branches present in the tree. Both can be represented mathematically as:
 (8)
(8)
 (9)
(9)
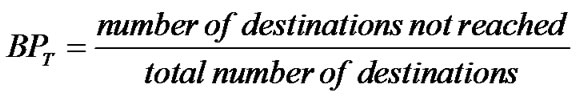
Blocking Probability (BP): The ratio between number of blocked calls to the number of offered calls in a tree is considered as the blocking probability for that tree. In other words it is the ratio of unreached nodes to the total number of destination nodes available in a multicast tree. Mathematically it is represented as:
 (10)
(10)
3.2. Formulation of Problem
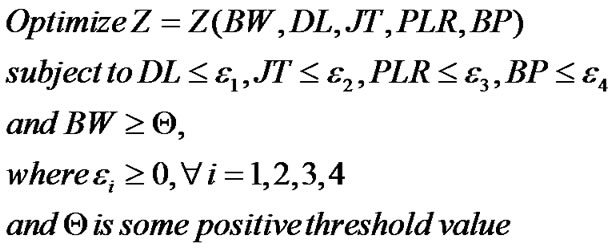
The Bandwidth (BW), end-to-end delay (DL), jitter (JT), packet loss rate (PLR) and blocking probability (BP) are the five QoS parameters as defined in Subsection 3.1 are considered for our model. All the five objectives are to be satisfied simultaneously within their desired acceptable range for multi-objective optimization. Except BW all other objectives will be minimized, where as the former is to be maximized for optimal utilization. As defined in Equation (1) our MOO problem can be formulated as:
 (11)
(11)
3.3. Simulation Model Using GA
In our proposed model, we choose a heuristic based Genetic Algorithm with binary crossover and Roulette Wheel Selection approach. The fitness/objective function is the multi-objective function defined in Equation (11). The different phases of GA for natural evolution through encoding, selection, crossover and mutation operations are discussed as below.
Encoding: We use tree encoding for each chromosome to represent a multicast tree due to the 5 properties such as 1) all feasible trees can be represented; 2) the probability of representing all feasible tree is same; 3) only trees are represented; 4) low time complexity for encoding and decoding, and 5) no global effect on the tree, due to small change in representation, as proposed in [14].
The Genetic Operators:
1) Selection: We have used an elitist model for selection of the individuals for the next generation of population. 30 percent of the best fit individuals are selected at the first step for the next generation. Rest 70 percent of the population are selected using Roulette Wheel selection method.
2) Crossover: Standard uniform crossover technique is used for the crossover of two parents selected randomly from the matting pool.
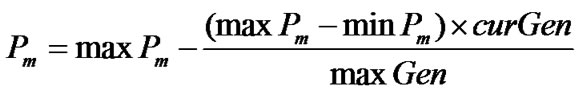
3) Mutation: We observe that using the standard mutation technique we do not obtain the requisite level of performance. When the mutation probability is bit low it does not yield any result. In our model we have kept the mutation probability very high, i.e., 0.2 and slowly decrease it with the progress of the generations using the following method.
 (12)
(12)
where, : current mutation probability,
 : Maximum mutation probability,
 : Minimum mutation probability,
 : current generation, and
 : maximum generation Fitness Test: The fitness of a tree is evaluated in two steps. In the first step, we evaluate Delay, Jitter, PLR and BP using Equations (5), (7), (9) and (10) respectively. Instead of bandwidth we evaluate deficiency from maximum bandwidth
 . So,
. So,  and
and  represented in Equations (2) and (3) are modified as follows.
 (13)
(13)
 (14)
(14)
At the time of evaluation, if we find an invalid node, which is not an intermediate node in the respective path, then a penalty value is added to the delay. If the BW, JT, PLR and BP values lie outside the desired range, for each case we add a small penalty to the delay. The values of DL,  and JT are rationalized within the range of 0 and 1. Then in the second step the fitness value is evaluated as follows
 (15)
(15)
where ,
,  ,
,  ,
,  , and
, and  are user defined constants in the range [0, 1]. The fit value i.e.
 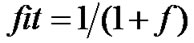 in the range [0, 1] is maximized by using GA.
3.4. Simulation Procedure
1) Scenario Generation: For our simulation purpose, we have considered a three dimensional (3D) space to simulate real life wireless scenarios. The 3D coordinates of a node are randomly generated. The Euclidean distance between each pair of nodes is measured. If the distance between any two nodes is found to be less then 250 meters then a link is established between these two nodes and accordingly the adjacency matrix is formed. The scenario represented in Figure 1 is one of our network topology formed during simulation.
Once the network is formed, the source and destinations are generated randomly and GA is applied to find out the optimal multicast tree over a set of evolutions. Also we define different cut-off ranges for various network parameters to fulfill the demands of multimedia applications. These cut-off values were considered in the algorithm while a tree is selected for optimality.
2) Simulation Parameters: The Network and GA parameter values considered for our simulation are given in the Table 1 and Table 2 respectively. During initial stage of our simulation, we have given a constant low value to the mutation probability, which did not yield
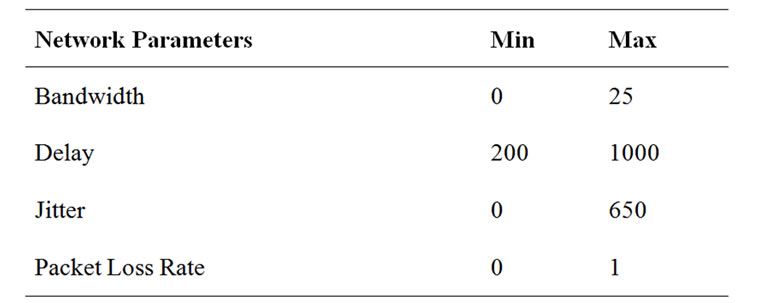
Table 1. Network Parameters.
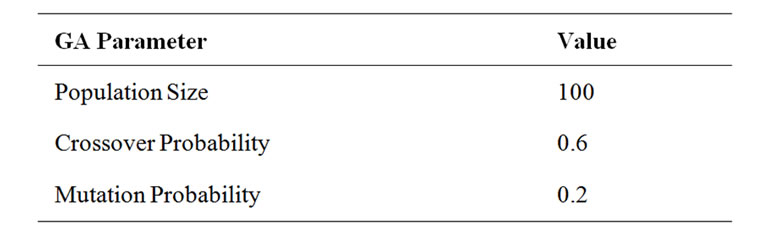
Table 2. GA Parameters.
good result. For the subsequent simulations, we take a high value such as 0.2 for the mutation probability to ensure a diversified search and slowly reduces as the network converges to an optimal solution to narrow down the search in the close proximity.
In our model we have considered the nodes are of homogeneous with respect to their transmission range, processing capability and buffer length [15,16]. The wireless bandwidth is equally shared among the mobile entities. At any instance of the simulation the available bandwidth is optimized in consideration with the QoS required by the end nodes. To emulate the scenario the available bandwidth for each node can be obtained randomly. However, random initialization of other QoS parameters like de-
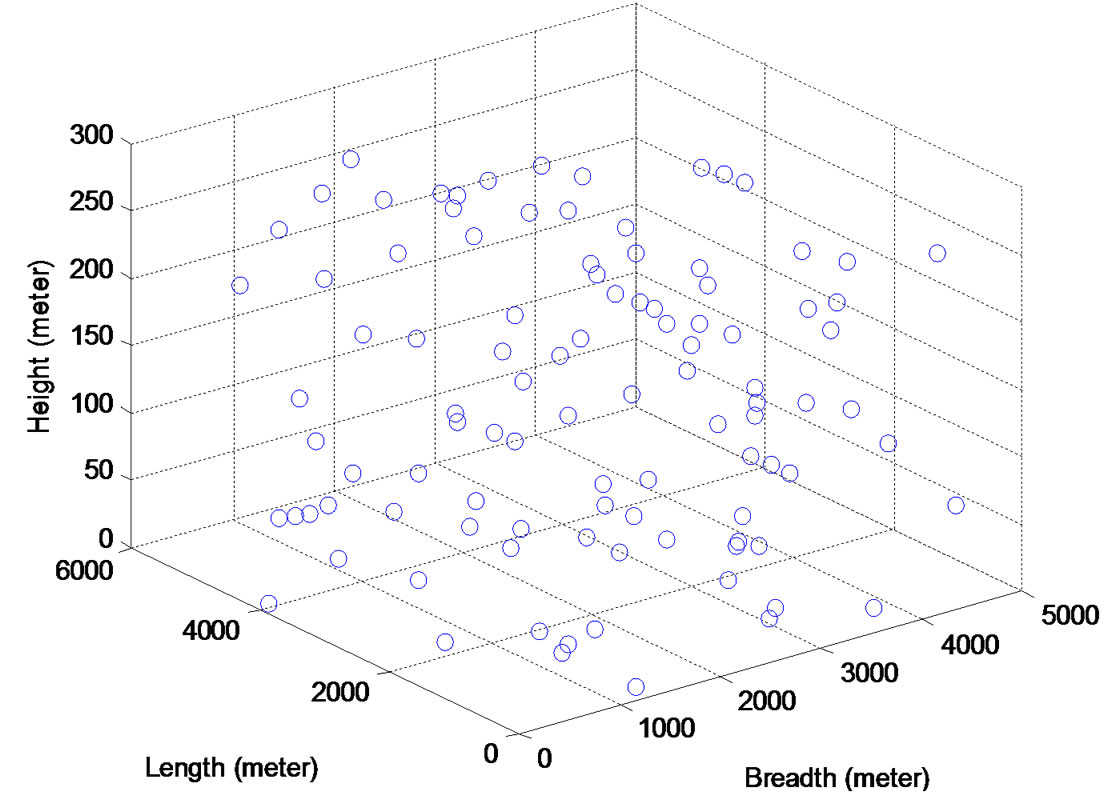
Figure 1. 3-D Network topology generation with 100 nodes (volume: 6000 × 5000 × 300 cubic meters).
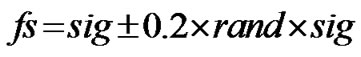
lay(DL), jitter (JT) and packet loss rate (PLR) and blocking probability (BP) may results unpredictable network performance. Although there is no established relationship among the parameters [7,17], we propose a sigmoidal fuzzy-logic based parameter initialization with error model for our GA approach in (17).
 (16)
(16)
 (17)
(17)
We establish the relationship between available bandwidth and other parameters with the following formulae as given in Equations (18) to (21).
 (18)
(18)
 (19)
(19)
 (20)
(20)
 (21)
(21)
where the triplets (xD, nD, Di), (xJ, nJ, Ji), (xL, nL, Li) and (xP, nP, Pi) represent maximum, minimum and current values of DL, JT, PLR, and BP of the ith node respectively. xW and xi represent maximum and allocated BW for the ith node respectively. The parameters ,
, ,
,  , and
, and  used in evaluation of sigmoidal function are suitably selected constants which are obtained after a maximum number of testing.
4. Simulation Results and Performance Analysis
In this simulation our objective is to test if the proposed model is producing an optimal solution with multi-objective constraints. During simulation, the total number of nodes were varied from 10 to 100 by keeping density of the nodes in the space same by changing the space volume according to total number of nodes such that the maximum number of neighbors present for a node is limited to 6. The multicast group size was kept as one fourth of the total nodes. The maximum numbers of generations for evolution were fixed at 250. As the objectives are conflicting in nature, to obtain the Pareto-optimal solution we have considered different sets of randomly selected weights in Equation (15) for each simulation. However, one may consider meta-heuristic approach for dynamic selection of those weights. The range of network parameters and GA parameters considered for evaluating QoS parameters are represented in Table 1 and Table 2 respectively. The simulation results of QoS parameters are shown in Table 3.
Table 3. Average results of QoS parameters with different group size.
4.1. A Study of QoS Parameters
Hop Count (HC) represents the maximum number of hops required to reach any destination in the multicast tree.
Delay (DL): is the maximum delay along any branch of the tree. A penalty is added if no link found between two nodes.
Packet Loss Rate (PLR): is the average packet loss along the tree branches. The cut-off for PLR is set at 10%. If a branch having more than 10% packet loss then it is assigned a penalty, such that the model tries to search a path less then10% PLR.
Jitter (JT): is the maximum delay variation along any branch of the tree. The cut-off is set at 20% otherwise a penalty is added.
Bandwidth (BW): of the multicast tree is the average bandwidth requirement of all the tree branches. The cut-off BW is taken as 2 Mbps.
Blocking Probability (BP): is the ratio of not getting a node to the total number of destination nodes in the multicast tree.
Possible Paths (PP): in the tree are the average possible paths available for any destinations in the tree. The PP field gives an estimation of the search space and also proves the efficiency of our algorithm to find an optimal tree from such a huge search space. Also the BP field proves the definiteness of this algorithm to find a path from source node to destination node (if exists).
The ‘Tot’ represents the total number of nodes considered for the simulation and ‘Gr’ represents the multicast group size. In order to maintain node density, we have increased the volume of the search space proportionately as the total number of nodes. The QoS parameter values were obtained by changing the total number of nodes and the respective multicast group size.
The QoS parameter values presented in the table are the average values of 25 simulations. The multicast targets are randomly chosen for each simulation and QoS parameters are also reinitialized for each simulation. We have not considered HC as a parameter for optimization; as a result we obtained different results for different target size depending upon the availability connectivity. As we have considered a minimum delay of 200 ms per node, the delay affects with increase in the number of hops. However, this algorithm has ensured to find a path where the delay gets minimized.
The robustness of our GA based approach is the inherent capability of obtaining optimal solution after searching from a large search space, which is shown in Figure 2.
Further the increase in group size of a multicast environment results in marginal elevation in the node density. The node density of a multicast tree is considered as the ratio between numbers of nodes in the tree to the size of the group. i.e. represented as
 (22)
(22)
While measuring intermediate node density, the network conditions is assumed to be constant, i.e. the adjacency matrix representing the links among the nodes is not altered.
The results of QoS parameter values obtained from simulation show that our proposed model can adapt and scale well to large group members and capable of obtaining near optimal solution from a large search space.
4.2. A Simulation Study
The overall results from our simulation studies have been presented in Table 3. We now present the details of a single simulation study to show the working of the algorithm and the performance results that were obtained. In this simulation, we have considered 10 nodes as a network from the environment consisting of 100 nodes. In the selected group, the node with index number 14 was taken as the source node and nodes with indices 5, 11, 15, 17, 20 were considered as the target nodes.
Table 4 presents the status of a typical simulation. The
Figure 2. A subset of total search space representing average number of valid paths with 5 intermediate nodes.
Table 4. Multicast Tree with QoS Parameter Values.
results obtained after every 25 simulations were recorded, the multicast tree obtained and the QoS parameter values at that instance have been represented in this table. From the table it can be observed that the multicast tree produced by this method does not change after 50 iterations and stabilizes. Please note that the values given in Table 4 for HC, DL, PLR, JIT, BW, and BP are the mean values of the different multicast trees represented in the population for the respective generation. These values converge after 150 generations.
4.3. Performance Analysis
For the purpose of comparison, we have simulated the approach presented in [18] and the performance results have been represented as Model 1 results. The simulation results of the current study have been presented as Model 2 results. In a typical simulation we have taken the total number of nodes in the network as 20, one source and 5 destinations, with a population size 10, the GA was allowed to run for 250 generations. The QoS metric values of the population are recorded after every 25 generations.
The results of Model 1 are presented in Figures 3, 5, 7, 9, 11 and that of Model 2 in Figures 4, 6, 8, 10 and 12.
The objective of this experimentation (given in Equation 11) is to maximize the bandwidth (BW) and to minimize all other parameters. From Figures 3 and 4, we can see that optimal bandwidth allocation in the current study is 22.01 Kbps as against 5.98 Kbps in Model 1, giving performance improvement of 267.99%.
One of the objectives is to minimize the delay while optimizing all other parameters. The Pareto fronts for delay in Model 1 and Model 2 have been presented in Figures 5 and 6 respectively. The optimal delay was rounded to be 794.47 ms in Model 1 as against 280.25 ms in Model 2, which shows a performance improvement of 64.72 % in delay parameter.
The Pareto fronts for HC have been presented in Figures 7 and 8 respectively for Model 1 and Model 2. The Pareto fronts for jitter have been presented in Figures 9 and 10 respectively. The optimal level of jitter was 149.87 ms for Model 1 and 43.37 ms for Model 2, giving an improvement in performance of 71.06 %. The Pareto fronts for PLR have been presented as Figures 11 and 12.
The optimal level of PLR for Model 1 is 0.4368 and for Model 2 is 0.09016, giving an improvement of performance of 79.36%.
The performance of this work is compared with the performance of the models suggested by other researchers. On comparing our results with that of Roy et al. [19], we find that our approach outperforms the approach presented in [19]. However, Roy et al. has considered only three parameters such as bandwidth requirement, bandwidth utilization and end-to-end delay. The bandwidth requirement and bandwidth utilization possibly relates to one parameter, resulting multi-objective for two parameters only as against 5 distinct parameters considered in our study.
The non-dominated solution of bandwidth utilization and end-to-end delay converges almost in the same number of generations as pointed by Roy et al. [20]. The call blocking (BP) percentage was found to be 10% with 10 requests per second in [20]. However in our study, we have obtained 0.0 BP with network size in the range of [10, 100] where the respective maximal group size is one fourth of the network size.
In the following, we compare our work with some of the other related work. Gomathy et al. [11] have evaluated the packet delivery ratio and end-to-end delay of ODMRPCAMP, and NTPMR multicast routing protocols after incorporation of a fuzzy based priority scheduler. Pinto et al. [21] has considered maximum end-to-end delay, average delay, maximum link utilization and cost of multicast tree as the four multi objective parameters for
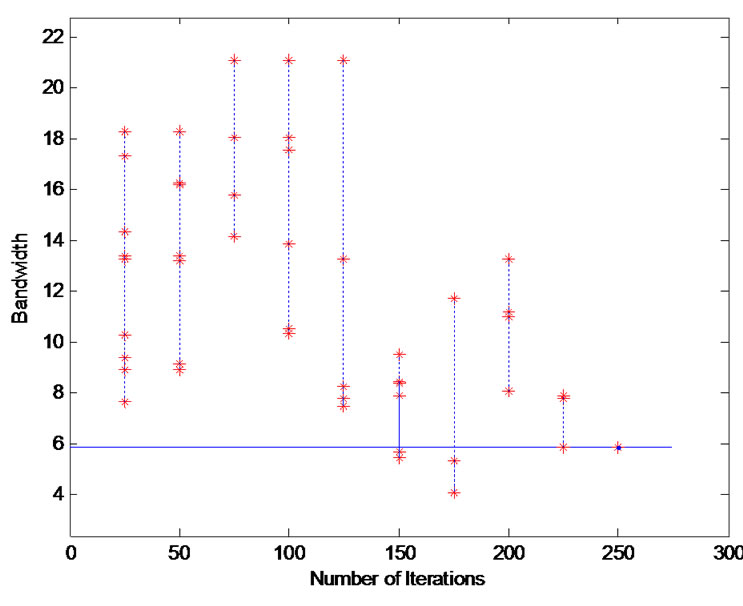
Figure 3. Pareto front of bandwidth allocation in Model 1.
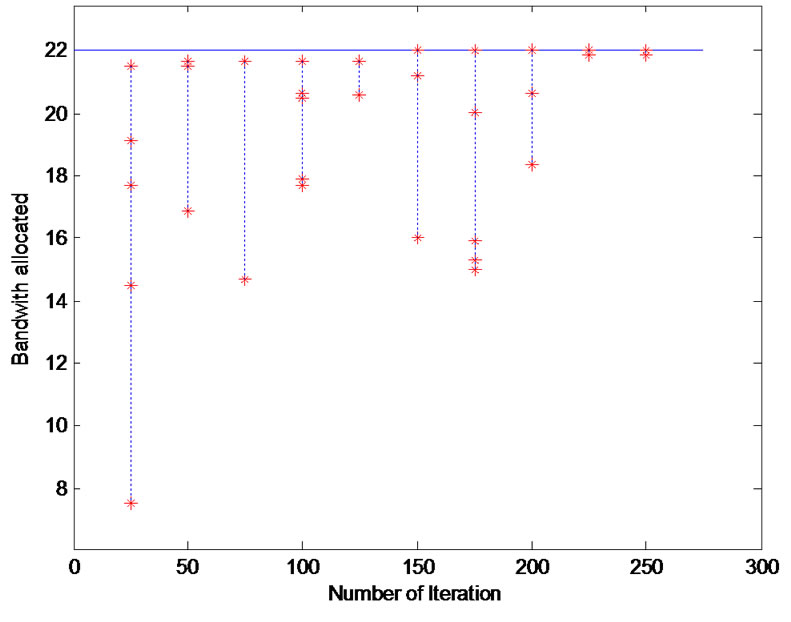
Figure 4. Pareto front of bandwidth allocation in Model 2.
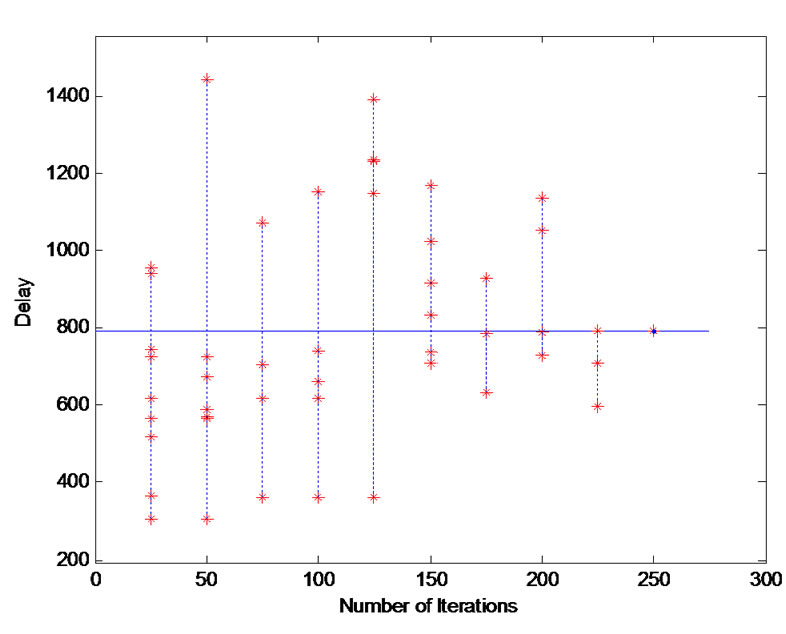
Figure 5. Pareto front of delay in Model 1.
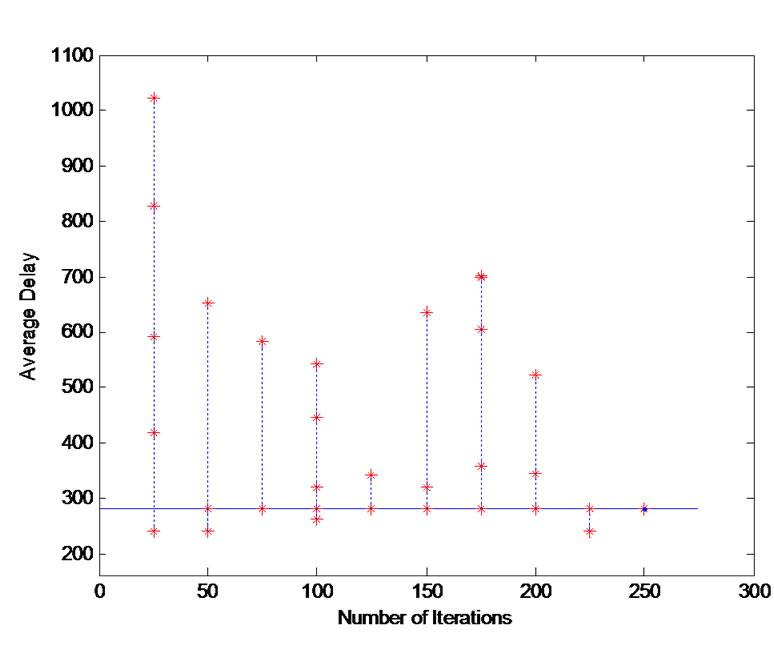
Figure 6. Pareto front of delay in Model 2.
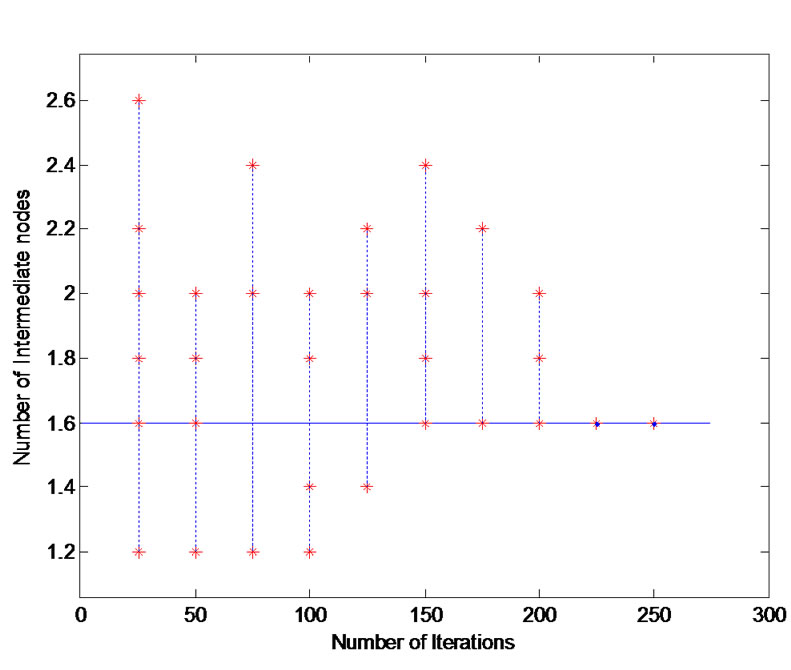
Figure 7. Pareto front of HC in Model 1.
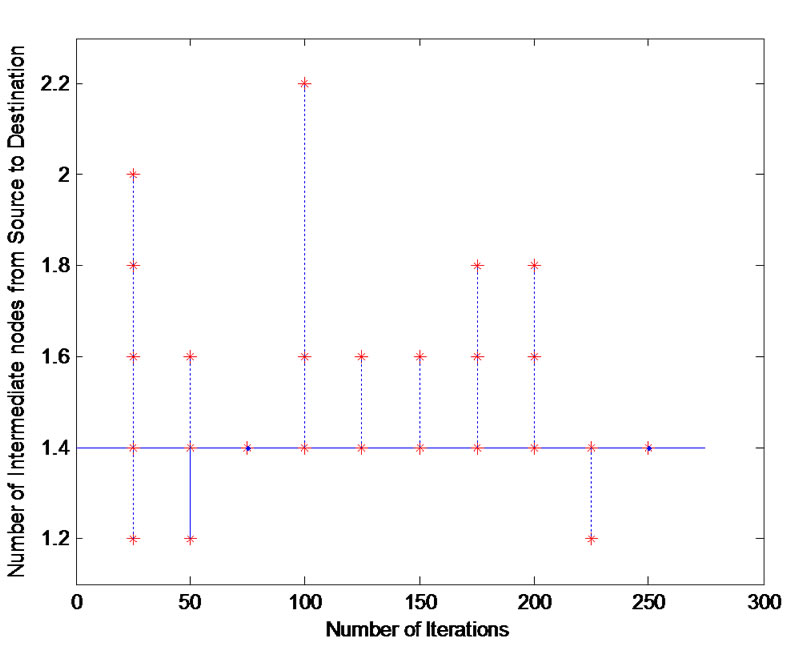
Figure 8. Pareto front of HC in Model 2.
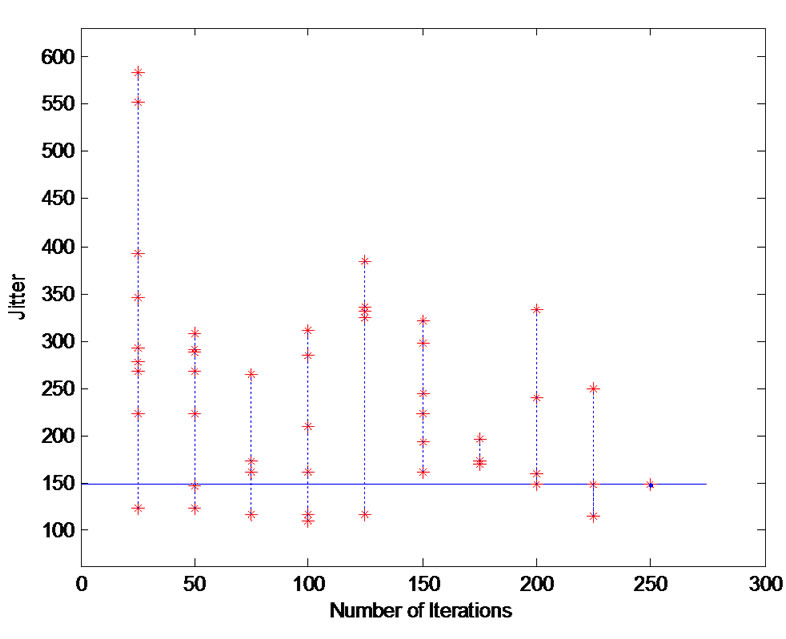
Figure 9. Pareto front of jitter in Model 1.
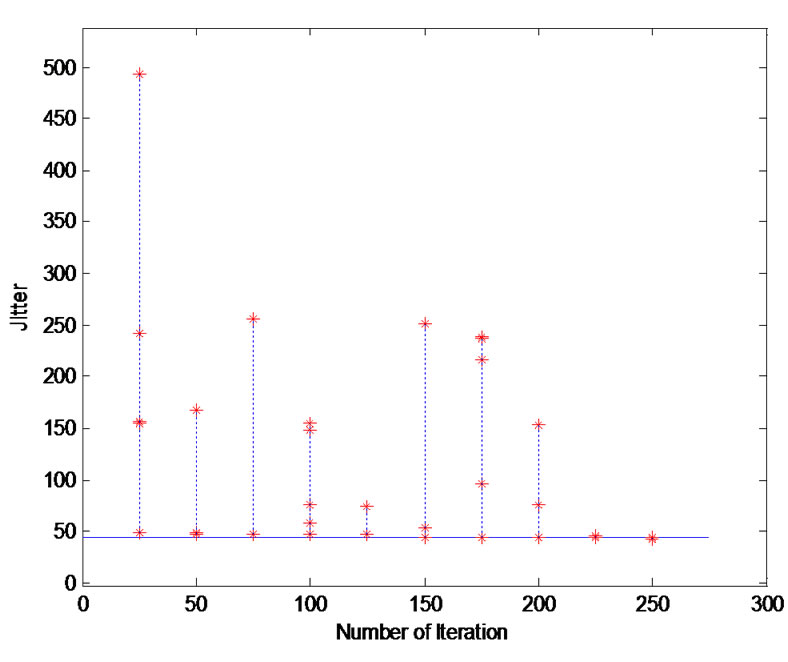
Figure 10. Pareto front of jitter in Model 2.
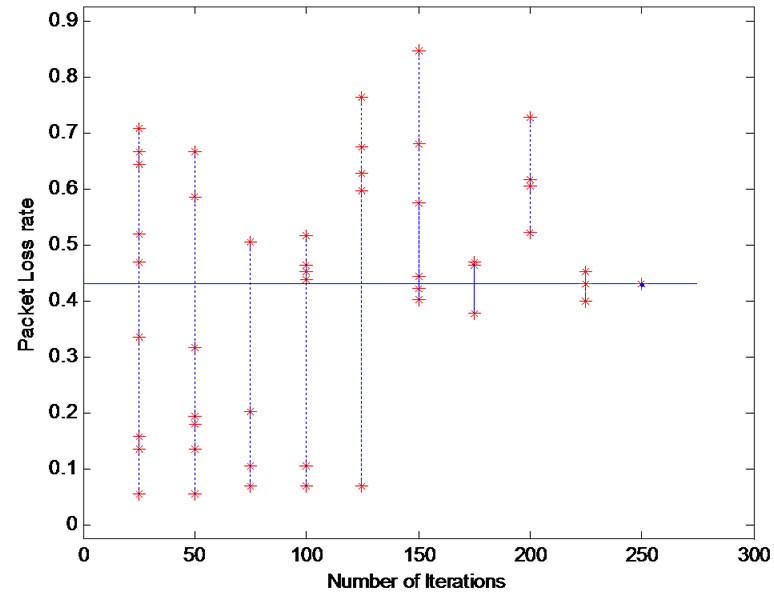
Figure 11. Pareto front of PLR in Model 1.
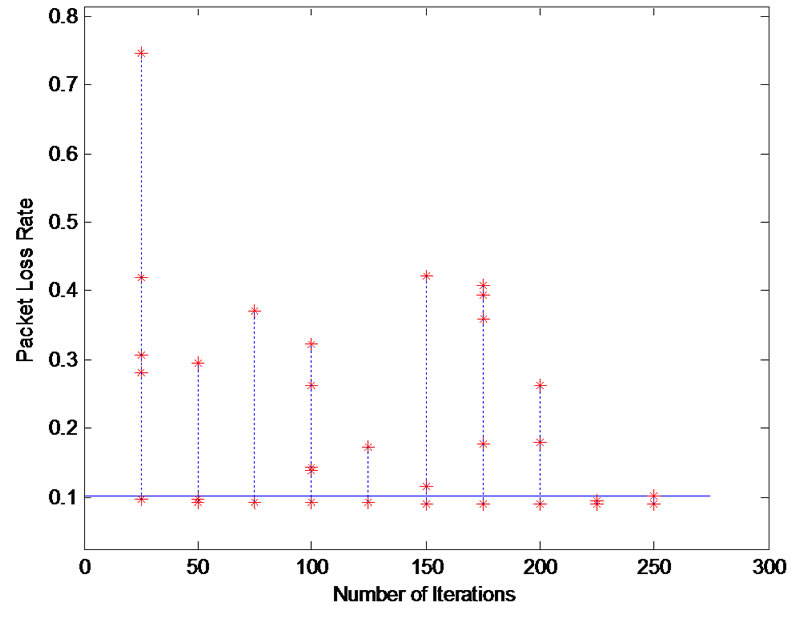
Figure 12. Pareto front of PLR in Model 2.
optimization, where the maximum end-to-end delay and average delay may be considered as related features. Maximum delay, average delay, maximum link utilization, cost of the tree are the four multi objective features considered by Crichigno et al. [22]; where the first two objectives belong to one feature. Fabregat et al. [4] considered a static network and they have optimized maximal link utilization, hop count, average delay, and bandwidth consumption parameters. Marwaha et al. [23] have considered end-to-end delay, packet delivery ratio, packet loss ratio, routing load and route failure as the optimization parameters for a mobile ad-hoc network with 900 seconds as the network pause time, where the packet delivery ratio and the packet loss ratio are related features. Whereas in our work, we have considered 5 distinct parameters such as bandwidth allocation, end-to-end delay, jitter, packet loss rate, and blocking probability as our multi-objective optimization criterion. Further the simulation environments considered by these researchers are not compatible to ours to make a meaningful performance comparison.
5. Conclusions
We have proposed a multi-objective multicast model for wireless ad-hoc network using GA. In this model we have considered five QoS parameters such as bandwidth, end-to-end delay, jitter, packet loss rate and blocking probability for multi-objective optimization. Simulation studies were carried out with a network of 100 nodes moving in a 3D space of volume: 5000 × 6000 × 300 cubic meters with the number of multicast destination nodes varying in the range 5 to 30. Our model established near optimal relationships among the QoS parameters to satisfy multi-objective optimization. Irrespective of increase in group size our model could optimize path length between any sources to its group members. Selection of min-cost paths from source to multiple destinations for multicasting is a NP-hard problem. Our approach could effectively obtain near optimal solution for QoS multicast applications in varying network conditions. As per our knowledge no relationships among the QoS parameters have so far been established. We propose a fuzzy-based parameter setting approach which establishes a Sigmoidal relationship among the parameters. Due to the dynamism of the network there is a possibility of sudden change of the network type and status of resources. The empirical results show superiority over the randomly selected resource values. As a future work, we plan to consider biological-inspired optimized techniques for estimation of multicast cost arising from queuing delays and propagation error.
6. References
[1] Y. He, I. Lee and L. Guan, “Optimized Video Multicasting Over Wireless Ad Hoc Networks Using Distributed Algorithm,” IEEE Transactions on Circuits and Systems for Video Technology, Vol. 19, No. 6, June 2009, pp. 796-807.
[2] C. Fortuna, M. Mohorcic and B. Filipic, “Multi-objective Optimization of Service Delivery over a Heterogeneous Wireless Access System,” Proceeding of IEEE International Symposium on Wireless Communication Systems, Reykjavik, 2008, pp. 133-137.
[3] W. X. Gu and X. F. Liu, “A New Algorithm for Probabilistic Planning Based on Multi-Objective Optimization,” Proceeding of IEEE International Conference on Machine Learing and Cybernetics, Kunming, 12-15 July 2008, pp. 1812-1817.
[4] R. Fabregat, Y. Donoso, B. Baran, F. Solano and J. L. Marzo, “Multi-Objective Optimization Scheme for Multicast Flows: A Survey, a Model and a MOEA Solution,” Proceeding of 3rd International IFIP/ACM Latin American Conference on Networking, New York, 2005, pp. 73-86.
[5] H. Juidette and H. Youlal, “Fuzzy Dynamic Path Planning Using Genetic Algorithms,” IEEE Electronics Letters, Vol. 36, No. 4, February 2000, pp. 374-378.
[6] P. Chen and T. L. Dong, “A Fuzzy Genetic Algorithm for QoS Multicast Routing,” Journal of Computer Communication, Vol. 26, No. 6, 2003, pp. 506-512.
[7] A. Khisti, U. Erez and G. W. Wornell, “Fundamental Limits and Scaling Behavior of Cooperative Multicasting in Wireless Networks,” IEEE Transactions on Information Theory, Vol. 52, No. 6, June 2006, pp. 2762-2770.
[8] A. Striegel and G. Manimaran, “A Survey of QoS Multicasting Issues,” IEEE Communication Magazine, Vol. 40, No. 6, June 2002, pp. 82-87.
[9] X. Cui, C. Lin and Y. Wei, “A Multi-objective Model for QoS Multicast Routing Based on Genetic Algorithm,” Proceeding of IEEE International Conference on Computer Networks and Mobile Computing (ICCNMC), Shanghai, 2003, pp. 49-53.
[10] A. Dutta, J. Chennikara, W. Chen, O. Altintas and H. Schulzrinne, “Multicasting Streaming Media to Mobile Users,” IEEE Communications Magazine, Vol. 41, No. 10, October 2003, pp. 81-89.
[11] C. Gomathy and S. Shanmugavel, “Supporting QoS in MANET by a Fuzzy Priority Scheduler and Performance Analysis with Multicast Routing Protocols,” EURASIP Journal on Wireless Communications and Networking, Vol. 5, No. 3, 2005, pp. 426-436.
[12] A. Daid, V. Van and B. Gary, “Multi-Objective Evolutionary Algorithm: Analyzing the State-of-the-Art,” Evolutionary Computation, Vol. 8, No. 2, 2000, pp. 125- 147.
[13] J. Q. Wang, J. Qin and L. S. Kang, “A New QoS Multicast Routing Model and its Immune Optimization Algorithm,” Lecture Notes in Computer Science, Vol. 4159, 2006, pp. 369-378.
[14] C. C. Palmer and A. Keshenbaum, “Representing Trees in Genetic Algorithms,” Proceeding of IEEE International Conference on Evolutionary Computation, Orlando, Vol. 1, 1994, pp. 379-384.
[15] S. Sivavakeesar, G. Pavlou and A. Liotta “Stable Clustering through Mobility Prediction for Large-Scale Multiple Intelligent Ad-hoc Networks,” Proceeding of IEEE Wireless Communications and Networking Conference, Atlanta, Vol. 3, March 2004, pp. 1488-1493.
[16] J. Yu, L. Chen and G. Chen, “A Fuzzy Grouping Mechanism for Distributed Interactive Simulation,” Proceeding of IEEE International Conference on Communication, Seoul, 2005, pp. 881-885.
[17] G. M. B. Oliveira and P. T. Araujo, “Determining Multicast Routes with QoS and Traffic Engineering Requirements Based on Genetic Algorithm,” Proceeding of IEEE Conference on Cybernetics and Intelligent Systems, Singapore, 1-3 December 2004, pp. 666-670.
[18] S. C. Rai, B. B. Mishra, A. K. Nayak, R. Mall and S. K. Pradhan, “A Multi-Objective Pareto Optimal Genetic Algorithm for QoS Multicasting,” Proceeding of IEEE International Advance Computing Conference, Patiala, 2009, pp. 1303-1307.
[19] A. Roy and S. K. Das, “Optimizing QoS-Based Multicast Routing in Wireless Networks: A Mullti-objective Genetic Algorithmic Approach,” Proceedings of the 2nd International IFIP-TC6 Networking Conference on Networking Technologies, Services, and Protocols, Lecture Notes in Computer Science, Berlin Heidelberg, Vol. 2345, Springer-Verlag, 2002, pp. 28-48.
[20] A. Roy, N. Banerjee and S. K. Das, “An Efficient MultiObjective QoS-Routing Algorithm for Wireless Multicasting,” Proceeding of IEEE Vehicular Technology Conference, San Diego, Vol. 3, 2002, pp. 1160-1164.
[21] D. Pinto and B. Baran, “Solving Multi-Objective Multicast Routing Problem with a New Ant Colony Optimization Approach,” Proceeding of 3rd International IFIP/ACM Latin American Conference on Networking, New York, 2005, pp. 11-19.
[22] J. Crichigno and B. Baran, “Multi-Objective Multicast Routing Algorithm for Traffic Engineering,” Proceeding of 13th IEEE Inernational Conference on Computer Communications and Networks (ICCCN), Chicago, 2004, pp. 301-306.
[23] S. Marwaha, D. Srinivasan, C. K. Tham and A. Vasilakos, “Evolutionary Fuzzy Multi-Objective Routing for Wireless Mobile Ad Hoc Networks,” Proceeding of Evolutionary Computation (CEC’04), San Diego, Vol. 2, 2004, pp. 1964-1971.