Journal of Water Resource and Protection
Vol.07 No.12(2015), Article ID:59170,17 pages
10.4236/jwarp.2015.712077
Expanding the Indicator Bacteria Concept: A Novel Approach to Assess Ecosystem Risk in Impaired Waters
Nicholas Carrara, Katharine Settell, Blake Andrews, David W. Buckalew, Wade A. Znosko*
Department of Biological and Environmental Sciences, Longwood University, Farmville, VA, USA
Email: *znoskowa@longwood.edu
Copyright © 2015 by authors and Scientific Research Publishing Inc.
This work is licensed under the Creative Commons Attribution International License (CC BY).
http://creativecommons.org/licenses/by/4.0/


Received 18 July 2015; accepted 22 August 2015; published 27 August 2015
ABSTRACT
Many studies report the relationship between coliform indicator bacteria levels and the overall quality of environmental water for public use. This study, an outgrowth of a long-term water- monitoring program within the upper Appomattox River (Virginia) watershed, employs a zebrafish model to examine the relationship between impaired stream water and aquatic vertebrate development. We report results that suggest an expansion of the indicator bacteria concept, showing a possible relationship between waters containing high levels of the indicator bacterium, Escherichia coli (E. coli), with developmental defects upon zebrafish embryos. These effects are not directly attributable to bacterial presence, as filtered test waters void of bacteria produce the same results in embryos, indicating these developmental defects are due to the presence of other toxins or contaminants. Fish embryos exposed to the test waters show reduced survivorship and altered brain and heart development. Furthermore, fish surviving to adulthood exhibit altered gonads and skewed sex ratios. We suggest that this broadly focused approach examining the complex interactions (biotic and abiotic) within raw water sources could be used in conjunction with traditional chemical assays and/or dose-response studies on vertebrate models for a more complete analysis of stream water quality conditions.
Keywords:
Impaired Waters, FIB, Aquatic Survivorship and Development

1. Introduction
Coliform bacteria, specifically Escherichia coli (E. coli), have been used as indicators of fecal contamination of waters since the late 19th Century, as Theodore Escherich (1885) associated presence of Bacillus coli (later E. coli) with the typhoid bacillus [1] . Since then, correlations between coliform presence in water and human enteric diseases related to public health risk (e.g., typhoid, cholera, dysentery, etc.) have been thoroughly examined [2] -[5] . The ability of these bacteria to predict human health risk has been supported by epidemiologic studies [6] [7] .
Indicators chosen for freshwaters have been comprised of coliform bacteria―a group of small, facultative, gram-negative bacilli―termed fecal indicator bacteria (FIB). Pathogenic agents (viruses, bacteria, protists, fungi, etc.) most often come from fecal sources [8] and are most commonly transmitted by water [9] . Sustained use of FIB as indicators of biological water quality persists due to: 1) presence in high numbers in animals (including humans) and feces; 2) being easier, less costly, and safer to analyze than individual pathogenic agents [10] ; and 3) the correlation with pathogenic presence in US waters [11] . More recently, the focus of freshwater analyses has been restricted to counts of E. coli as the standard metric of FIB related to public health risk in many states in the United States [12] .
Stormwater and other modes of land-based runoff contribute high levels of bacteria and chemicals into the aquatic environment as a result of drainage from the surrounding watershed in both urban and rural areas [13] [14] . A partial list of such contaminants to waterways includes solid particulates (sand, silt, clay, organics, trash, etc.), microbes (viruses, bacteria, fungi, etc.), and chemicals (nitrogen and phosphorus compounds, soluble organics, pesticides, hydrocarbons, and metal ions) [15] . Of the approximately 28% of assessed river and stream miles reported to the United States Environmental Protection Agency (US EPA), more than 51% reveal impairment due to either bacterial or chemical pollutants. Moreover, of the approximately 43% of lakes, ponds, and reservoirs assessed, more than 67% are labeled as impaired for one or more contaminants. A waterway is labeled as “impaired” if it is found to contain higher than the pre-determined threshold concentration of either indicator bacterium or contaminating chemical. The threshold concentration for FIB in freshwaters of Virginia is 238 E. coli/100 mL of water sample [16] .
Studies have shown FIB can withstand and thrive in waterways experiencing deteriorating environmental conditions. A recent report by Staley et al. [17] indicates that viability of FIB is not affected by three of the most common agricultural chemicals used in the US (atrazine, malathion, and chlorothalonil). Staley et al. [18] have also observed that some chemicals increase certain FIB as they negatively impact predation and competition from other microorganisms in the aquatic environment. Hence, because communities of FIB have the ability to survive under diverse environmental conditions, they could potentially serve as indicators of overall ecosystem condition.
With the release of treated wastewater into surface waters and the common use of urban and agricultural chemicals that enter the water environment as runoff, researching the effects of environmental toxicity on vertebrate development is a widening field of study [19] . Due to surface runoff, watersheds within areas of focused agricultural and human activity are at a higher risk of contamination [20] . Since these effluents can migrate into aquatic ecosystems via stormwater runoff and drainage, aquatic biota are affected by these contaminants [21] [22] . Therefore, the environment of natural surface waters may contain a variety of agents (e.g., pesticides, urban pollutants, industrial chemicals, fecal wastes, etc.), which impact developmental processes of the animals found there.
Although correlations between bacterial indicators of pollution and human disease agents have been observed for more than 10 decades, the connection between water pollution and toxicity to aquatic life is comparatively researched recently. During the last 40 years, the toxicological literature has reported the use of many eukaryotic models to assess toxicity including invertebrates such as Daphnia [23] [24] and nematodes [25] . More commonly, vertebrates such as zebrafish (Danio rerio) [26] [27] , Japanese medaka (Oryzias latipes) [28] [29] , and amphibians [30] -[32] have been assayed in toxicological studies. In a majority of these reports, assays have been associated with a direct cause-effect or dose-response relationship using a single chemical treatment. Due to the complexity of runoff consisting of interactions between mixes of chemicals and associated microbes [13] [14] , studies examining the effects of raw water samples on test organisms should more accurately determine the composite effect of all influencing factors within the system. Moreover, to the best of our knowledge, no studies have correlated vertebrate toxicity with the FIB E. coli within the stream environment.
This study reports the effects of water quality on the development of aquatic vertebrates by using FIB concentrations as an indicator of toxicity. The sources of test water stem from watersheds in south central Virginia: the Appomattox River (APP), Green Creek (GRE), and Gross Creek (GRO). FIB counts from GRE and GRO, both tributaries of APP, are habitually above state-mandated threshold levels for contact waters, listing these streams as “impaired” for human recreational use. We utilized zebrafish to analyze if FIB could be used to indicate dangers to aquatic vertebrates living within these waters. Zebrafish, being small in size, having a short reproductive cycle, and producing large broods of transparent embryos, have become a powerful model organism to study environmental toxicology [33] -[36] . Due to this, zebrafish have been frequently used in eco-environ- mental monitoring and pollutant evaluations involving toxic heavy metals, endocrine disruptors, and organic pollutants [37] -[39] . In addition, Erbe et al. [40] found fish to be more sensitive as biomonitors of water pollutants than two other commonly used indicators (Daphnia magna and Vibrio fischeri).
This study presents data on the link between FIB concentrations in stream water on development and survivorship of zebrafish raised in the stream water. Significant differences in survivorship were observed between fish raised in impaired waters when compared to control groups. These waters also affected development of major organs such as the brain and heart. In long-term studies, surviving adults raised in impaired water sources had altered sex ratios and females had malformed gonads when compared to controls. In addition, when bacteria were removed from the impaired water samples, similar effects to survival and development were observed, indicating that it was not the FIB themselves that were the cause of these defects. From these data, it can be concluded that FIB can be used not only to assess human public health concerns, but also to indicate the health of aquatic vertebrates therein.
2. Materials and Methods
2.1. Determination of Sampling Locations
All test waters were obtained from one of three different natural stream sources within a 10-mile radius of Farmville, Virginia. These waterways were chosen as long-term comparisons of the three streams tested reveal a pattern of FIB concentrations whereby GRO > GRE > APP [41] . All three sampling locations are within the upper Appomattox River watershed, and all have been designated by the Virginia Department of Environmental Quality (VA DEQ) as “impaired” due to fecal coliform (E. coli) levels [42] . The threshold level of impairment for fecal coliform level is 238/100 mL for freshwater streams in Virginia. For two of the three sampling locations (APP and GRE), the predominant land use of the sub-watershed is agricultural (beef, dairy, poultry, row crops, and hay fields) interspersed with mixed hardwood forest and low housing density. The third sampling site, GRO, is within a suburban/urban watershed impacted both by agriculture and street runoff.
2.2. Sampling Protocol for Test Waters
Water samples were obtained according to published standards [12] from a bridge perch via a weighted, surface sterilized, tethered stainless steel cylinder holding a sterile 120 mL polystyrene clinical sample container (NCS Diagnostics, Etobicoke, Ont.) and lowered to mid-column into the deepest channel of the stream. All water samples were collected in separate containers, capped tightly, and submerged in ice for transport to the laboratory for assessment using Colilert® defined substrates (IDEXX, Westbrook, ME) medium for enumeration of coliforms and E. coli. Samples were processed within one hour of collection. For quality assurance purposes, both sample duplicates and field duplicates were assessed to validate bacterial counts performed for each sampling location each time water samples were obtained. Physical parameters of temperature, pH, and dissolved oxygen for test waters at each of the sampling locations were also measured using a Hach Hydrolab probe with an MS 5 sonode with multiple sensors (Hach Hydromet, Loveland, CO). A one-way analysis of variance (ANOVA) was used to analyze temperature, pH, and dissolved oxygen collections between all samples sites during the course of our study.
2.3. Bacterial Analysis of Test Waters
All water samples were aseptically processed to assess coliform and E. coli concentrations using the Colilert Quanti-Tray 2000® envelopes (IDEXX, Westbrook, ME). A 25% test-sample dilution (25 mL test sample and 75 mL sterile, phosphate-buffered dilution water) was used for all bacterial assays, processed according to the directions of the manufacturer, and incubated at 44.5˚C ± 0.2˚C for 24 ± 2 hrs. For this study, only counts of E. coli were used. One sample blank was processed with each sampling date cohort to insure sterility of dilution water. After incubating, wells showing chromogenic response (yellow) and fluorescing under long UV (365 nm) illumination were counted positive for E. coli. All counts were performed using a most probable number (MPN)-based system with quantification range between <1 and 9676 cells per 100 mL when using a 25-mL sample dilution. For each sample date, aliquots of randomly selected Quanti-Tray wells testing positive for E. coli were confirmed through lactose fermentation (EC broth, BDL, Sparks, MD) and IMViC response (broth/ agar media, DIFCO Labs, Detroit, MI). Using IMViC testing accompanied by the elevated temperature (44.5˚C) of incubation was used to enhance the confirmation of E. coli [4] . All wells presumed to contain E. coli were confirmed as positive. Buckalew et al. [41] reported there was no need for confirmatory testing of E. coli when using Colilert media. Colilert test results were recorded as number of E. coli per 100 mL for all water samples obtained.
2.4. Membrane Filtration of Water Samples
For the tests that used filtered water, water samples were filtered using a TPP (Techno Plastic Products, Switzerland) rapid 500 vacuum filtration (0.22 µm pore size) to eliminate all bacteria. Aliquots of the filtrates were checked for presence of coliform bacteria and E. coli using the Colilert system (as described above). All aliquots of the filtered water tested negative for coliforms and E. coli.
2.5. Zebrafish Maintenance and Water Treatments
Each time test-water samples were collected to analyze for FIB levels, portions of these samples were also used for zebrafish studies. Oregon AB* wildtype zebrafish genetic lines were used for all experiments. Prior to embryo incubation, the test waters were quickly pre-warmed to 27.5˚C - 28.5˚C. Following spawning, fertilized embryos at the two-cell stage were placed in petri dishes containing 100 mL of test water. During incubation, all water samples containing embryos were kept at 28.5˚C until analyzed. Embryos were maintained within the test water until analysis unless otherwise stated. During incubation periods, all water samples were kept between 27.5˚C - 28.5˚C. Control embryos (wildtype) were kept in petri dishes containing a sample of de-ionized water that had been cycled through a zebrafish ZTT350 Stand Alone Tabletop Rack using multi-phase filtration (Aquaneering Inc., San Diego, CA), including a: 1) Dacron pad particulate filter, 2) fluidized bed biological filter, 3) carbon filter, and 4) UV (200 - 280 nm) sterilizer lamp. Zebrafish embryos and adults were kept at a constant 27.5˚C - 28.5˚C and standard light cycle of 14 hours of light and 10 hours of dark. All experiments using zebrafish embryos or adults were conducted according to the National Institute of Health Guide for the Care and Use of Laboratory Animals and the Longwood University Animal Care and Use Committee approved all protocols.
2.6. Zebrafish Survivorship Analysis
Zebrafish embryos at the two-cell stage were raised in separate test-water samples and analyzed at 12, 36, and 60 hours post-fertilization (hpf). As a control, other zebrafish embryos were raised in multi-phase filtered aquarium water and analyzed similarly to the test groups. Dead embryos from each treatment group, including controls, were counted and removed at each time point to record a survivorship ratio. Experimental trials were repeated multiple times to increase N values and validate test results. A two-sample equal variance t-test using a two-tailed distribution was applied to analyze the survivorship of controls compared to each test-water sample at 60hpf. In addition, an exponential regression model was used to derive the Median Lethal Time value (LT50) for zebrafish embryos raised in each of the water samples.
2.7. Zebrafish in Situ Hybridizations
In situ hybridizations were performed to visualize the developmental morphology of key organs at each time point (24 and 52 hpf) to assess for defects. In situ hybridizations were performed as described by Kudoh et al. [43] . The following antisense riboprobes were generated in this study: fgf8 (fibroblast growth factor 8; [44] ) and vmhc (ventricular myosin heavy chain; [45] ) to examine brain and heart RNA expression, respectively.
2.8. Zebrafish Female Gonad Dissections
Females of control embryos and test embryos (exposed to test waters for 60 dpf) were raised to 150 dpf in multi- phase filtered aquarium water and were selected at random. Total dry body mass was taken prior to gonad removal. Gonads were then removed according to Gupta and Mullins [46] . Once obtained, gonads were massed to obtain a gonadosomatic index (GSI; %) comparing gonad size in relation to body mass using the following equation:
 .
.
A two-sample equal variance t-test using a two-tailed distribution was applied to analyze the data for statistical significance.
2.9. Zebrafish Sex Ratios
To obtain sex ratios, AB* zebrafish embryos were raised in test water in a 0.5 L tank with adequate aeration and a constant temperature (27.5˚C - 28.5˚C) from the two-cell stage until 60 days post-fertilization (dpf), at which point sexual differentiation is typically complete. To control for evaporation during the 60 day incubation, multi-phase filtered aquarium water was added as needed to maintain the 0.5 L volume in the test tanks. All surviving embryos were removed from the test water and raised in standard multi-phase filtered aquarium water until 150 dpf, when the zebrafish were visually sexed based on 1) the general body shape, and 2) cloacal protrusion in females [47] . During sexing, the fish were unstressed and kept in water. Those individuals with unclear sex based on the visual criteria were not included in the calculations for sex ratios. The total number of individuals with unclear sex within a test group never exceeded 5%. The control group was raised only in multi-phase filtered aquarium water for the duration of the study. A chi-square (χ2) goodness of fit on a two-way table was applied to analyze the sex ratio data for statistical significance.
3. Results
3.1. FIB Concentrations of Test-Water Sources Were at or Above the Impairment Threshold for the State of Virginia
As part of an ongoing collaboration with the VA DEQ, the main artery and tributaries of the upper Appomattox River watershed have been assessed and recorded by Longwood University for the past 15 years. Sample locations with GPS coordinates are presented in Table 1. Sites selected for test waters were chosen due to their histories of bacterial impairment. With each collection of test water, assays for FIB concentrations were simultaneously determined from each of the following sources: APP, GRE, and GRO. Although all three streams reveal high E. coli levels, the three stream sources generally reveal a gradation of quality relative to concentration of FIB in the following sequence: APP < GRE < GRO (Figures 1(a)-(c)). Test-water samples from the APP source measured overall lower levels of FIB, with two-thirds of the samples (10/15 samplings) at or below the impairment threshold (238 E. coli/100 mL), however, other APP samplings measured significantly higher (Figure 1(a)). Bacterial assays indicated FIB levels above the Virginia state-approved threshold of impairment for a majority of samplings from both GRE (11/14 samplings) and GRO (14/15 samplings; Figure 1(b) and Figure 1(c)), and in some cases, levels were measured as high as ten times the threshold.
Although bacterial counts between our sample sites were highly variable, it is necessary to also examine physical parameters of each sample site to determine other possible effects upon the overall ecosystem health. During the time course of our study, temperature, pH, and dissolved oxygen were also measured (Table 2). Using a one-way analysis of variance (ANOVA) to evaluate the data, we found no significant difference in temperature, pH, or dissolved oxygen between our three sample sites. Thus, any alterations found within the development of aquatic vertebrates between the water sources in our study cannot be attributed to these physical characteristics.

Table 1. Sampling sites for three test sources of environmental water within the upper Appomattox River watershed of south central Virginia (all coordinates obtained via https://www.google.com/earth/).
Table 2. Physical parameters of temperature, pH, and dissolved oxygen for three test sources of environmental water within the upper Appomattox River watershed in south central Virginia during the time course of our study (May 2012-June 2014). A one-way analysis of variance (ANOVA) was used to determine no significant difference in temperature, pH, or dissolved oxygen between the three water sources.
3.2. Survivorship of Aquatic Vertebrates Was Reduced when Raised in Impaired Waters
Survivorship values were recorded and averaged for multiple trials performed during a two-year period (Figure 2(a)). Survivorship of zebrafish embryos was calculated at 12, 36, and 60 hpf. Typically, by 60 hpf most internal organs are formed and functional within the zebrafish embryo [48] , hence our period of observation for survivorship included most critical stages during development. Embryo survival was reduced in all raw test-water samples by 12 hpf, becoming more pronounced over time (Figure 2(a)). The survivorship in all raw test waters at 60 hpf was significantly lower than in controls (p < 0.005 when comparing each test-water sample to the control), culminating in the lowest survivorship (67%) in GRO at 60 hpf. Furthermore, in raw test waters where FIB levels were highest, the survivorship of zebrafish embryos were lowest (compare Figures 1(a)-(c) and Figure 2(a)). An exponential regression model was used to derive the Median Lethal Time value (LT50) for zebrafish embryos raised in each of the water samples. Consistent with the trend of the survivorship curves, the LT50 of embryos raised in GRE was the lowest of all water samples (4.3 days); being almost 8 times lower than CONT (31.0 days). The LT50 of embryos raised in APP and GRE was also much less when compared to CONT (9.6 and 7.3 days, respectively).
Survivorship was also calculated and compared after raising embryos in test waters filtered to remove bacteria (Figure 2(b)). Similar to survivorship results from studies conducted using raw (unfiltered) test waters, zebrafish embryos raised in filtered test water had reduced survivorship at all time points assessed and were significantly lower than controls at 60 hpf (p < 0.05 or 0.005 depending upon water source). Again, filtered test waters originally containing the highest FIB levels resulted in the lowest survivorship of zebrafish embryos (compare Figures 1(a)-(c) and Figure 2(b)). Again, an exponential regression model was used to derive the LT50 for zebrafish embryos raised in each of the filtered water samples. Consistent with the trend of the survivorship curves and similar to the results found within the raw water samples, the LT50 of embryos raised in filtered GRE was the lowest of all water samples (3.8 days); being almost 8 times lower than CONT (28.0 days). The LT50 of embryos raised in APP and GRE was also much less when compared to CONT (9.3 and 4.0 days, respectively). These data suggest that bacteria did not appear to have a detrimental effect on embryo survival; however other contaminants within these test waters were decreasing survivorship. Thus, the bacterial levels can act as an indicator of decreased survivorship, but not the cause of the decreased survivorship.
3.3. Organ Development Was Altered in Zebrafish Embryos Raised in Impaired Water Sources
Due to decreased survivorship of embryos raised in impaired waters, organ development within embryos was examined to determine proper formation of crucial organs: the brain and heart. Fibroblast growth factor 8 (fgf8) was used as a marker to ascertain proper brain development within the mid-hindbrain boundary (MHB; [44] [49] ). When performing in situ hybridizations, each embryo in every treatment was stained for the same length

Figure 1. Counts of E. coli (#/100 mL) among sampling locations for each sampling date across the 24 months of this study established the overall health of the water source. E. coli concentrations assessed from samples revealed a gradation of water quality relative to concentration of FIB, where the Appomattox River (APP) is the least impaired (a), followed by Green Creek (GRE) (b), and Gross Creek (GRO) being the most impaired (c). The dotted red line indicates the Virginia state-mandated threshold of impairment (238 E. coli/100 mL).
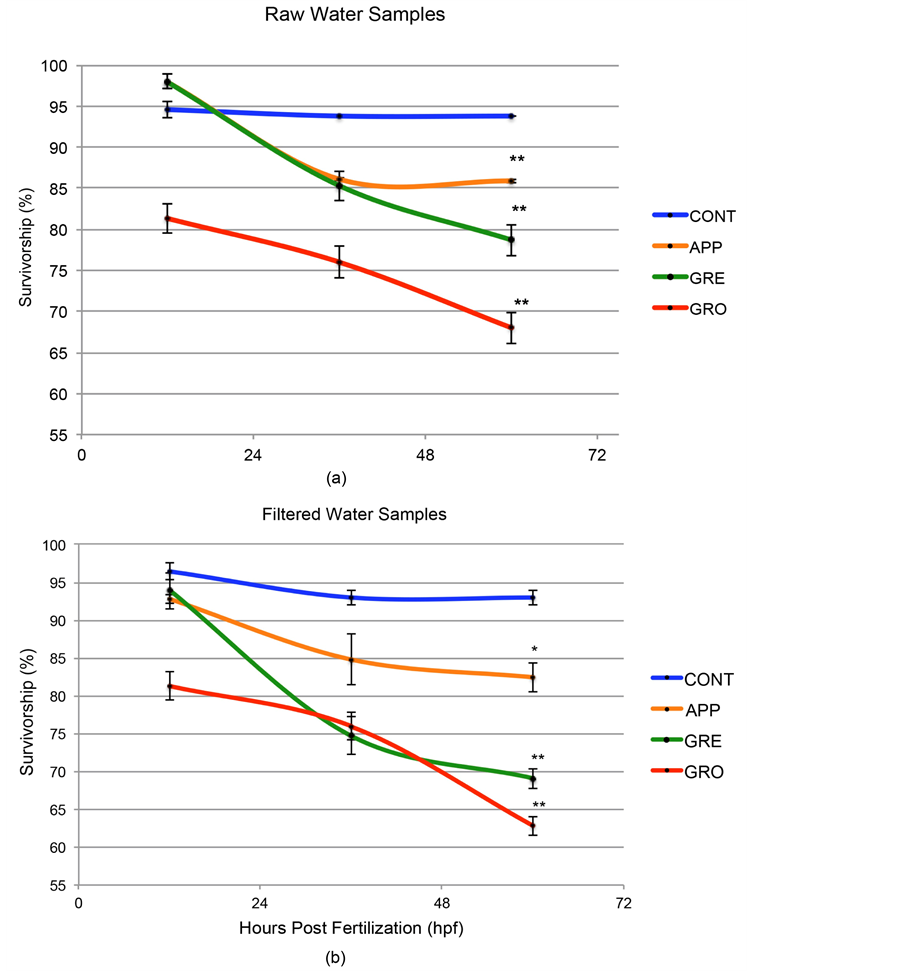
Figure 2. Survivorship of zebrafish embryos was reduced in embryos raised in test water when compared to controls. (a) Embryos raised in raw (unfiltered) water samples indicated significantly decreased survivorship at 60hpf when compared to controls, where decreases in survivorship correspond to increased FIB levels within test waters. These curves were used to generate an exponential regression model to derive the LT50 for embryos raised in each of the water samples (CONT = 31.0 days; APP = 9.6 days; GRE = 7.3 days; GRO = 4.3 days). (b) Survivorship rates in filtered water (without bacteria) show similar outcomes as raw samples. These curves were used to generate an exponential regression model to derive the LT50 for embryos raised in each of the water samples (CONT = 28.0 days; APP = 9.3 days; GRE = 4.0 days; GRO = 3.8 days). An asterisk indicates p < 0.05 when comparing test water to control. A double asterisk indicates p < 0.005 when comparing test water to control.
of time to accurately examine and compare expression levels between samples. In situ hybridizations of zebrafish embryos exposed to impaired test waters showed reduced expression of fgf8 when compared to controls at 24 hpf (Figure 3). The fgf8 expression is mildly reduced in embryos raised in APP and GRE (Figures 3(a)-(c)),
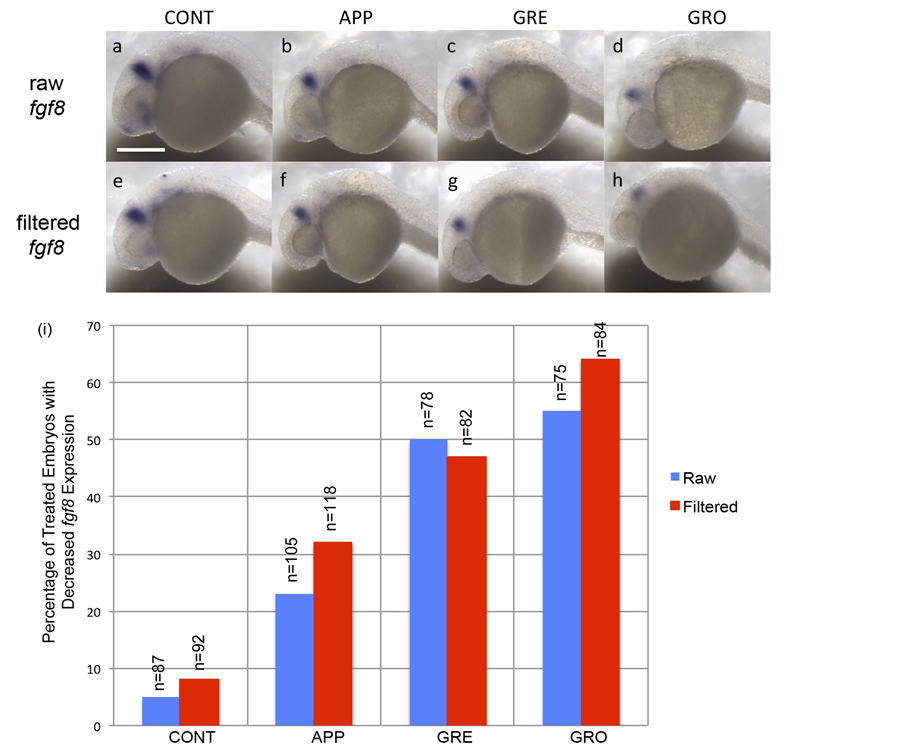
Figure 3. Raising embryos in impaired test waters caused alterations in brain development. (a)-(h) Lateral views of embryos treated in contorl waters (CONT) and in waters from a specific test site (APP, GRE, or GRO). Expression of an MHB marker, fgf8, is slightly reduced in embryos rasied in water from APP and GRE and is more dramatically reduced in embryos raised in water from GRO (a)-(d). Similar results within the MHB were obtained when test waters were filtered prior to incubation with fish embryos (e)-(h). (i) Graph depicting the phenotypic effects of test water on expression of an MHB marker. Numbers above each bar indicate sample size. Scale bar indicates 250 μm.
while a dramatic reduction of fgf8 is observed in embryos raised in GRO (Figure 3(a) and Figure 3(d)). Furthermore, the percentage of embryos displaying this reduced expression is greater in embryos raised in more impaired water sources (GRO) when compared to embryos raised in control or less impaired waters (APP or GRE; Figure 3(i)). These data supported our survivorship analysis (Figure 2), where embryos that had the lowest survivorship also have the most severe reduction in brain markers in the highest frequencies (Figures 3(a)-(d); Figure 3(i)). Test waters filtered to remove bacteria were then used in embryo incubations, and similar results were obtained as were seen in raw unfiltered test waters (Figures 3(a)-(d) and Figures 3(e)-(h); Figure 3(i)). Since similar results are seen after filtering water samples, these experiments suggest that bacterial presence did not appear to influence organ development.
Defects in the formation of a second major organ, the heart, were also observed in embryos raised in impaired waters. Specifically in this study, proper heart looping was analyzed. Normally, between 24 and 48 hpf the once linear zebrafish heart tube will bend between the ventricle and the atrium to form an S-shaped loop [50] [51] . This developmental event occurs later than MHB formation (24 hpf), which allows an analysis of major organ formation both at earlier and later stages during embryonic development within our study. Expression of ventricular myosin heavy chain (vmhc), a cardiac differentiation marker found in the ventricular tissue of the zebrafish heart, was used to determine proper heart looping [45] . Embryos were raised in test waters and hearts were examined at 52 hpf. In situ hybridizations of zebrafish embryos exposed to impaired test waters showed altered expression of vmhc when compared to controls (Figure 4). Heart looping is mildly altered in embryos raised in APP, resulting in a less looped heart (Figure 4(a) and Figure 4(b)), while more severe looping defects can be observed in embryos raised in GRE or GRO, resulting in no looping or reversed looping of the heart (Figures 4(a)-(d)). Furthermore, the percentage of embryos displaying altered heart looping and the variety of looping defects are greater in embryos raised in more impaired water sources (GRE and GRO) when compared to embryos raised in control or less impaired waters (APP; Figure 4(i)). These data supported our survivorship analysis (Figure 2(a)) where embryos that had the lowest survivorship also have the highest severity and variation of heart looping defects and in the highest frequencies (Figure 4(i)). Interestingly, embryos raised in filtered test
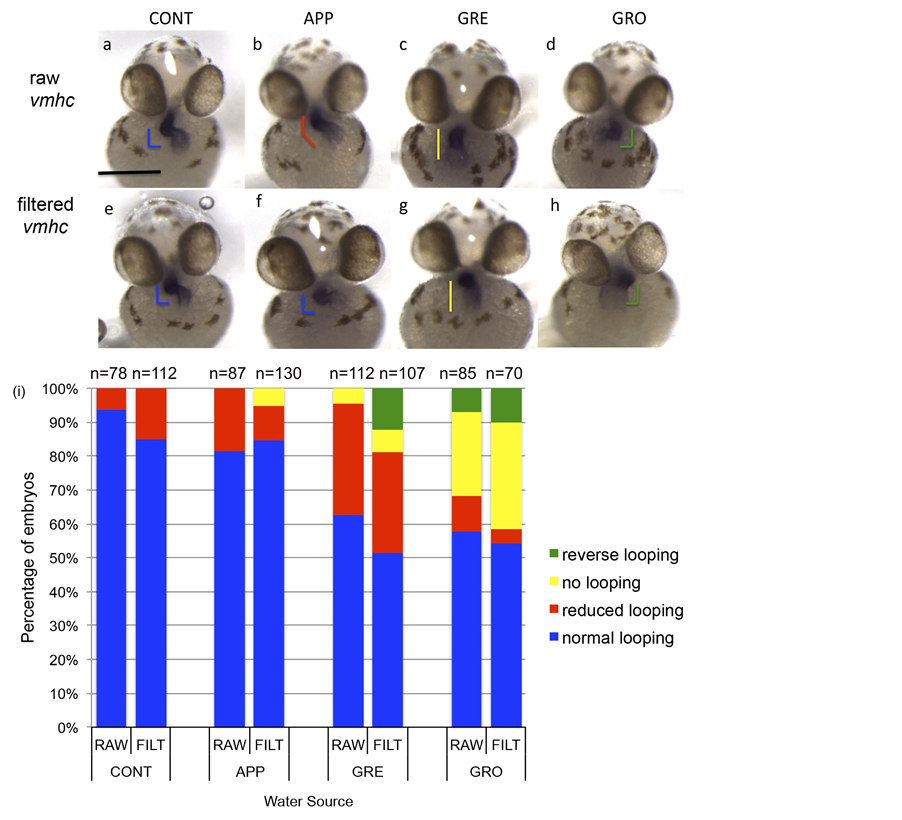
Figure 4. Raising embryos in impaired test waters caused alterations in heart development. (a)-(h) Embryos were treated in control waters (CONT) or waters from a specific test site (APP, GRE, or GRO). Expression of a ventricular marker, vmhc, indicated typical heart looping in CONT (a), whereas APP displayed minor alterations (b) and GRE and GRO displayed drastic alterations within heart looping (c) (d). Similar results on heart looping were obtained when test waters were filtered prior to incubation with fish embryos (e)-(h). (i) Quantification of effects on heart looping as exemplified in (a), (e), (f): normal looping; (b): reduced looping; (c) (g): no looping; (d) (h): reverse looping. Numbers above each bar indicate sample size. Graphics found in (a)-(h) correspond to the looping defect in shape and color (when compared to bars in (i)). Scale bar indicates 250 μm.
waters without bacteria exhibited similar defects, suggesting indicator bacterial levels can be related to overall health and proper development of aquatic vertebrates, although the FIB were not the actual cause of these deformities (Figures 4(e)-(h); Figure 4(i)). Of note, although vmhc expression was being used to observe heart looping, other heart defects can also be seen in impaired water sources, such as an enlargement of the ventricle (Figure 4(h)). Furthermore, although FIB concentrations within each sample location fluctuated over the course of our study, all our zebrafish in situ results (fgf8 and vmhc) represent grouped data analyzed across the entire duration of the experiment (May 2012-June 2014). This provides an overall analysis of the effect of water quality upon vertebrate development during a long time scale, as opposed to one specific water collection.
3.4. Adult Zebrafish Raised in Impaired Water Sources also Exhibit Defects, Specifically in Gonads
Although reduced survivorship and developmental defects were observed in embryos raised in impaired waters (Figures 2-4), we next investigated persistence of defects within adults that were incubated in test waters as embryos. Initial observations indicated embryos raised in impaired waters for 60 dpf that survived to adulthood (150 dpf) exhibited lower reproduction rates and fewer embryos per clutch (data not shown). To further analyze lower reproductive rate, the gonads of adults were examined. Embryos were treated in test waters from the two-cell stage until 60 dpf, at which time they were transferred to multi-phase filtered water. Once fish were 150 dpf, GSI (gonadosomatic indices) were used to assess the gross morphology of the reproductive organs in adults raised in the most impaired test water source (GRO) and compared to controls. Although no significant difference was observed within the gonads of males, the GSI revealed the gonads of females raised in GRO were significantly larger, almost double in size, than that of controls (Figure 5). Importantly, when calculating the GSI, alterations in total dry body weight is taken into account, so the large disparity in size of the female gonads is not due to the potential of any individual female being generally larger in size overall. These data indicated that although embryos were only treated within test-water sources during early development (until 60 dpf), development defects, specifically within the gonads of adult females, persisted through adulthood (150 dpf) in these organisms.
3.5. Sex Ratios in Adults Raised in Impaired Waters Are Skewed when Compared to Controls
Given the drastic differences in gross morphology that were observed in female gonads in the most impaired water source (GRO), we next investigated the sex ratios of adults who, as embryos, were raised in impaired water sources. Recently, several studies have examined sexual differentiation and ratios in fish [52] [53] . Many of these findings point toward the presence of endocrine-disrupting chemicals (EDCs) released into the aquatic environment as a major component of disturbing the typical sexual differentiation and ratios within fish. Since our
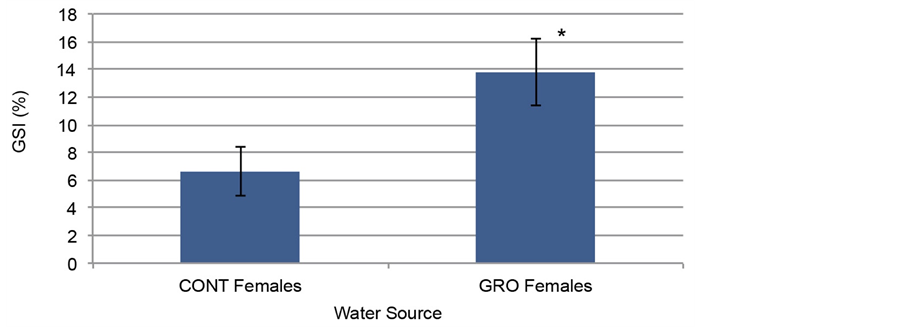
Figure 5. Gonadosomatic Index (GSI) of females at 150 dpf that were incubated in GRO earlier during development contained gonads that were significantly larger, more than double in size, when compared to control adults (n = 9 for both control and GRO). An asterisk indicates p < 0.005 when comparing GRO with GSI to control GSI.
current experiments use FIB levels to signify several types of contamination within our test-water sources, examining sex ratios within our water sources would further reveal defects potentially caused by such impurities within these waters.
Zebrafish were raised from the two-cell stage through 60 dpf within test-water sources (raw and filtered) or within multi-phase filtered water as a control. After 60 dpf, all embryos were placed in multi-phase filtered water until 150 dpf, when adults were then visually analyzed to determine sex. Sex ratios of zebrafish raised in impaired water (both raw and filtered) had altered proportions of females compared to those raised in the control water (Figure 6). Further analysis using a chi-square goodness of fit on a two-way table indicated a significant difference of the proportion of females between water samples both in raw (p = 0.046) and filtered (p = 0.0005) samples. Important to note, there is not a significant difference in females when comparing raw samples to filtered samples (p = 0.8587 using a chi-square goodness of fit on a two-way table). These data indicated that contaminants (excluding bacteria) in test waters have the potential to alter sex ratios of fish within these waters. Taken together, the data within this study indicate FIB levels can be an indicator of aquatic vertebrate health, although the FIB levels do not directly effect zebrafish development and survivorship.
4. Discussion
This report represents the first study to examine a relationship between concentrations of the indicator bacterium E. coli (which has traditionally been used for predicting public health hazards) and ecosystem risk using a common aquatic vertebrate model. By raising teleost fish in impaired water sources, we have observed that survivorship is reduced and brain and heart formation is altered. Although these negative impacts do not appear to be attributed to increased bacterial levels within the water, they do suggest that FIB levels can be used to indicate the presence of substances harmful to aquatic life. In addition, when the fish reached adulthood, sex ratios were altered toward females, and among these females, the overall gonad size was drastically affected. In sum, within these freshwater streams, the level of FIB may be linked to the health and proper development of aquatic organisms. We suspect parallel conclusions can be drawn when examining other impaired water sources impacted similarly.
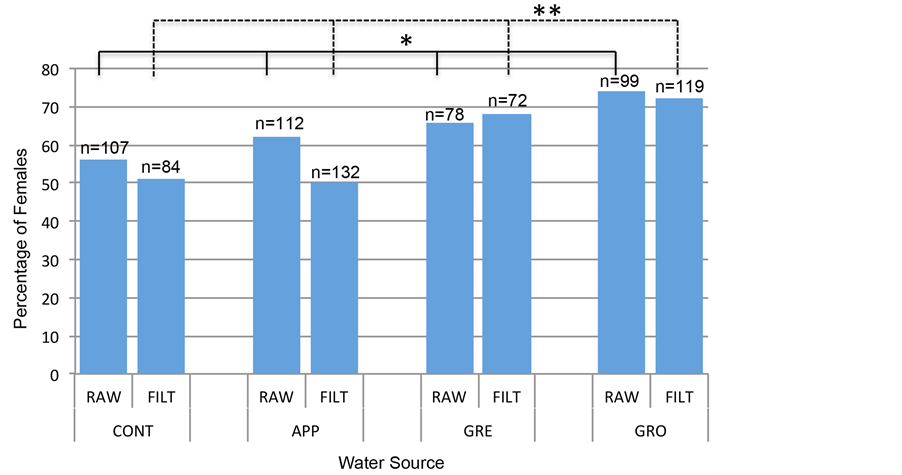
Figure 6. Sex ratios of zebrafish adults at 150 dpf are significantly different when raised as embryos in test waters compared to control waters. Zebrafish adults raised as embryos until 60 dpf in test waters (from raw or filtered samples) showed signficant sex ratio differences when compared to embryos raised in control raw water samples (p = 0.046 between embryos raised in raw water samples; p = 0.0005 between embryos raised in filtered water samples using a chi-square test on a two-way table). An asterisk indicates p < 0.05; a double asterisk indicates p = 0.0005.
4.1. Using FIB to Assess Ecosystem Condition
The concept of using microbial indicators for ecosystem assessment is an emergent field of study, but the idea is not new. Antibus and Linkins [54] were among the first to suggest that microbes (fungi) be used as biological markers to assess the effects of air pollutants on soils. Adamus [55] suggested specific microbes be used as indicators of wetland health, and more recently, Sims et al. [56] reported development and utility of key bacterial assemblages as indicators of wetland status due to their importance in wetland functions, including nutrient transformations. In addition, data by Paerl et al. [57] suggested that microbial indicators might detect and characterize impacts of environmental stress in aquatic systems. Moreover, US EPA [58] reported that microbial indicators tracked over time mirror trends in the condition of the aquatic ecosystem. Therefore, microbial indicators are beginning to be considered as gauges to reveal stress on the biota within a given aquatic system and overall ecosystem status. It is important to note, however, that some forms of contaminants (i.e. heavy metals, acid mine drainage, or inorganic industrial pollutants) may preclude microbial growth. Hence using FIB to assess overall ecosystem health may not be valid in all aquatic environments.
4.2. Observed Phenotypic Outcomes in Direct Toxicological Studies Parallel Those Found in Our Raw Water Samples
Our study shows a relationship between concentrations of a microbial indicator used for predicting public health risk and alterations in fish development. Although determining the specific environmental causes of developmental defects was beyond the scope of this study, phenotypic comparisons between zebrafish embryos in our study and organisms used in direct cause-effect toxicological studies present an exciting and attractive method for ecosystem analysis. Furthermore, for FIB to be an accurate indicator of ecosystem conditions due to contaminants, phenotypes in our test fish should resemble phenotypes observed in traditional toxicological studies.
Study sites assessed in this report are impacted by runoff from agricultural, residential, and urbanized areas, which potentially introduce a mix of contaminants ranging from human and pet wastes, heavy metals, home pesticides, pharmaceuticals, personal care products, agrochemicals, and others. For FIBs to be a valid indicator of ecosystem risk, phenotypes examined in our study should support direct toxicological studies produced by common contaminants in the types of waterways being examined. For example, recent direct analyses examining toxic effects using fish embryos, including Oryzias latipes (medaka) and Cyprinus carpio (common carp) resulted in reduced larval viability in addition to deleterious effects upon reproductive glands when treated with synthetic pyrethroids or carbamates, common organic compounds found in pesticides [29] [59] -[61] . We suggest the resulting phenotypes of malformed brain and heart in these studies relates to decreased survivorship found in our zebrafish experiments (Figure 2). In addition, previous studies have indicated the effects of pesticides on organ development, specifically the heart, in zebrafish/medaka [62] -[64] , Rana perezi, and Xenopus laevis (Iberian waterfrog and African clawed frog, respectively) [65] [66] . Again, similar phenotypes were observed in our studies within zebrafish embryos (Figure 4), indicating that heightened FIB levels may reveal the presence of other substances shown to cause developmental defects in fish and other freshwater aquatic organisms.
Other potential sources of contamination within the water sources of our study include pharmaceuticals, personal hygiene products, and agricultural and personal hormone treatments. Aquatic organisms exposed to these types of EDCs display phenotypes produced by exposure to natural estrogens (xenoestrogens) [67] -[69] . For example, in direct toxicity experiments, xenoestrogens have been shown to effect fish gonadal size [70] -[72] and maturation [73] . Furthermore, perfluorinated compounds (PFCs), chemicals widely used in lubricants and polymers, have been shown to alter sex ratios in the offspring of zebrafish exposed to PFCs [74] . In addition to analogous embryonic phenotypes observed between our raw water treatments and previous direct cause-effect studies, similar perpetuating adult phenotypes, such as skewed sex ratios and alterations in gonadal gross morphology are noted as well (Figure 5 and Figure 6).
Since raw water samples were used in our experiments, our study indicates a promising correlation among contaminants commonly found within watersheds similar to those in our study, FIB presence, and general stream water-quality condition. It is interesting to note, the gradation in severity of effects positively correlates to water sources that may contain the largest variety of contaminants, from both agricultural and suburban/urban areas (GRO site). Importantly, although FIB were used as an indicator of a stressed environment in our experiments, these bacteria did not play a role in the phenotypes observed, since removal of the bacteria led to similar phenotypes observed in zebrafish raised in raw (unfiltered) samples. Based on these results, we suggest that FIB could be used to indicate a variety of contaminants within waterways and thus serve as an indirect “gauge” of ecosystem health.
4.3. Advantages of Using Raw Water Samples
The use of raw water samples offers an exciting opportunity to study combinatorial effects of different molecules acting together to influence vertebrate development. The collective effect may not have been produced in studies using one specific chemical to examine a direct cause-effect or dose-response relationship. Most importantly, this study indicates the use of FIB levels as a general and easy way to assess ecosystem risk within the natural environment.
This new approach may provide a broad analysis of ecosystem risk, but also be potentially used to indicate a stressed environment for aquatic vertebrates. The effect of water quality on aquatic organisms is a complex relationship of impacts involving a mixture of many different types of contaminants. Using FIB levels to access ecosystem health due to surface runoff (point and non-point contamination) allows a general analysis of possible contaminants at one time, providing a general indication of other factors impacting aquatic life. Although direct dose-response experiments indicate exact effects caused by a specific contaminant, too many contaminants exist within waterways to practically monitor for each one or, furthermore, determine combinatorial effects between multiple contaminants. Measuring ecosystem health using FIB is not only a cost-effective, quick, and easy option to assess waterways in a timely manner, but also FIB analysis used by environmental scientists and watershed managers could serve to identify areas where more specific monitoring is needed. Furthermore, FIB are able to exist in the presence of pollutants [17] that have the potential to kill more sensitive organisms, making FIB a potentially useful and universal metric for ecosystem risk within freshwater environments.
5. Conclusions
This study presents an expansion of the use of indicator bacteria to describe water quality. Historically, levels of FIB within waterways were used to monitor and address concerns for human health and recreation. Our experiments support a novel use for FIB, as we have identified a relationship between FIB levels and aquatic vertebrate health. Within the upper Appomattox River watershed, we have shown that high levels of the indicator bacterium E. coli may be used to predict overall ecosystem health. Embryos raised in these waters have reduced survivorship and malformations in key organs, such as the brain and heart. Embryos surviving to adulthood revealed altered gonads and skewed sex ratios. Interestingly, these phenotypes increased in severity and frequency in embryos exposed to waters measuring chronically higher levels of FIB. These effects, however, were not directly attributable to bacterial presence, as filtered test waters void of bacteria produced similar results. Based on a comparison of phenotypes observed in previous studies, similarities can be made between phenotypes within our study and those seen when examining the effects of specific contaminants on organism development. Due to the location of the waterways being examined in our experiment, it is possible that these effectors could be contributing to the phenotypes we have observed.
We suggest that this more broadly focused approach of using FIB to examine the complex interactions within raw water sources could be used in conjunction with traditional chemical assays and/or dose-response studies on vertebrate models to provide a more complete analysis of stream water quality and its suitability to support fish communities. This straightforward and rapid assay may be of benefit to environmental scientists, watershed managers, and those involved with toxicological research to provide a general snapshot of the overall condition of the stream to support aquatic life.
Acknowledgements
We are thankful to Phillip Poplin for guidance and assistance with statistical analysis of our data. This work was supported by Longwood University Department of Biological and Environmental Sciences, Longwood University Cook-Cole College of Arts and Sciences Faculty Research Grant, Longwood University Perspectives on Research in Science and Mathematics, and the 2014 Virginia Department of Environmental Quality’s Citizen Water Quality Monitoring Grant program contract number 15769.
Cite this paper
NicholasCarrara,KatharineSettell,BlakeAndrews,David W.Buckalew,Wade A.Znosko, (2015) Expanding the Indicator Bacteria Concept: A Novel Approach to Assess Ecosystem Risk in Impaired Waters. Journal of Water Resource and Protection,07,938-955. doi: 10.4236/jwarp.2015.712077
References
- 1. Escherich, T. (1885) Die Darmbakterien des Neugeborenen und Sauglings. Fortschritte der Medizin, 3, 515-522.
- 2. Cabelli, V., Dufour, A., Levin, M., McCabe, L. and Haberman, P. (1979) Relationship of Microbial Indicators to Health Effects at Marine Bathing Beaches. American Journal of Public Health, 69, 690-696.
http://dx.doi.org/10.2105/AJPH.69.7.690 - 3. Dufour, A. (1984) Bacterial Indicators of Recreational Water Quality. Canadian Journal of Public Health, 75, 49-56.
- 4. Leclerc, H., Mossel, D., Edberg, S. and Struijk, C. (2001) Advances in the Bacteriology of the Coliform Group: Their Suitability as Markers of Microbial Water Safety. Annual Review of Microbiology, 55, 201-234.
http://dx.doi.org/10.1146/annurev.micro.55.1.201 - 5. Wade, T., Calderon R., Sams, E., Beach, M., Brenner, K., Williams, A. and Dufour, A. (2006) Rapidly Measured Indicators of Recreational Water Quality Are Predictive of Swimming-Associated Gastrointestinal Illness. Environmental Health Perspectives, 114, 24-28.
http://dx.doi.org/10.1289/ehp.8273 - 6. Wade, T., Calderon, R., Brenner, K., Sams, E., Beach, M., Haugland, R., Wymer, L. and Dufour, A. (2008) High Sensitivity of Children to Swimming-Associated Gastrointestinal Illness: Results Using a Rapid Assay of Recreational Water Quality. Epidemiology, 19, 375-383.
http://dx.doi.org/10.1097/EDE.0b013e318169cc87 - 7. Heaney, C., Sams, E., Wing, S., Marshall, S., Brenner, K., Dufour, A. and Wade, T. (2009) Contact with Beach Sand among Beachgoers and Risk of Illness. American Journal of Epidemiology, 170, 164-172.
http://dx.doi.org/10.1093/aje/kwp152 - 8. Wu, C., Sercu, B., Van de Werfhorst, L., Wong, J., DeSantis, T., Brodie, E., Hazen, T., Holden, P. and Andersen, G. (2010) Characterization of Coastal Urban Watershed Bacterial Communities Leads to Alternative Community-Based Indicators. PLoS ONE, 5, e11285.
http://dx.doi.org/10.1371/journal.pone.0011285 - 9. Abraham, W.-R. (2011) Megacities as Sources for Pathogenic Bacteria in Rivers and Their Fate Downstream. International Journal of Microbiology, 2011, Article ID: 798292.
http://dx.doi.org/10.1155/2011/798292 - 10. United States Environmental Protection Agency (2012) Water Monitoring and Assessment Report: 5.11 Fecal Bacteria. US EPA, Washington DC.
- 11. Cabral, J. (2010) Water Microbiology: Bacterial Pathogens and Water. International Journal of Environmental Research and Public Health, 7, 3657-3703.
http://dx.doi.org/10.3390/ijerph7103657 - 12. American Public Health Association (APHA), American Water Works Association (AWWA) and Water Environment Federation (WEF) (2012) Standard Methods for the Examination of Water and Wastewater. 22nd Edition, American Public Health Association, Washington DC.
- 13. Wilkes, G., Edge, T., Gannon, V., Jokinen, C., Lyautey, E., Neumann, N., Ruecker, N., Scott, A., Sunohara, M., Topp, E. and Lapen, D. (2011) Associations among Pathogenic Bacteria, Parasites, and Environmental and Land Use Factors in Multiple Mixed-Use Watersheds. Water Research, 45, 5807-5825.
http://dx.doi.org/10.1016/j.watres.2011.06.021 - 14. Williamson, K., Harris, J., Green, J., Rahman F. and Chambers, R. (2014) Stormwater Runoff Drives Viral Community Composition Changes in Inland Freshwaters. Frontiers in Microbiology, 5, 105.
http://dx.doi.org/10.3389/fmicb.2014.00105 - 15. Walsh, C. (2000) Urban Impacts on the Ecology of Receiving Waters: A Framework for Assessment, Conservation, and Restoration. Hydrobiologia, 431, 107-114.
http://dx.doi.org/10.1023/A:1004029715627 - 16. United States Environmental Protection Agency (2014) Impaired Waters and Total Maximum Daily Loads (303d) Report. US EPA, Washington DC.
- 17. Staley, Z., Senkbeil, J., Rohr, J. and Harwood, V. (2012) Lack of Direct Effects of Agrochemicals on Zoonotic Pathogens and Fecal Indicator Bacteria. Applied and Environmental Microbiology, 78, 8146-8150.
http://dx.doi.org/10.1128/AEM.01815-12 - 18. Staley, Z., Rohr, J., Senkbeil, J. and Harwood, V. (2014) Agrochemicals Indirectly Increase Survival of E. coli O157:H7 and Indicator Bacteria by Reducing Ecosystem Services. Ecological Applications, 24, 1945-1953.
http://dx.doi.org/10.1890/13-1242.1 - 19. Carriger, J., Hoang, T., Rand, G., Gardinali, P. and Castro, J. (2011) Acute Toxicity and Effects Analysis of Endosulfan Sulfate to Freshwater Fish Species. Archives of Environmental Contamination and Toxicology, 60, 281-289.
http://dx.doi.org/10.1007/s00244-010-9623-1 - 20. Carmichael, N., Enzmann, H., Pate, I. and Waechter, F. (1997) The Significance of Mouse Liver Tumor Formation for Carcinogenic Risk Assessment: Results and Conclusions from a Survey of Ten Years of Testing by Agrochemical Industry. Environmental Health Perspectives, 105, 1196-1203.
http://dx.doi.org/10.1289/ehp.971051196 - 21. Pereira, J., Antunes, S., Castro, B., Marques, C., Goncalves, A., Goncalves F. and Pereira, R. (2009) Toxicity Evaluation of Three Pesticides on Non-Target Aquatic and Soil Organisms: Commercial Formulation versus Active Ingredient. Ecotoxicology, 18, 455-463.
http://dx.doi.org/10.1007/s10646-009-0300-y - 22. Pogacean, M. and Gavrilescu, M. (2009) Plant Protection Products and Their Sustainable and Environmentally Friendly use. Environmental Engineering and Management Journal, 8, 607-627.
- 23. Abe, T., Saito, H., Niikura, Y., Shigeoka, T. and Nakano, Y. (2001) Embryonic Development Assay with Daphnia magna: Application to Toxicity of Aniline Derivatives. Chemosphere, 45, 487-495.
http://dx.doi.org/10.1016/S0045-6535(01)00049-2 - 24. Palma, P., Palma, V., Fernandes, R., Bohn, A., Soares, A. and Barbosa, I. (2009) Embryo-Toxic Effects of Environmental Concentrations of Chlorpyrifos on the Crustacean Daphnia magna. Ecotoxicology and Environmental Safety, 72, 1714-1718.
http://dx.doi.org/10.1016/j.ecoenv.2009.04.026 - 25. Traunspurger, W., Haitzer, M., Hoss, S., Beier, S., Ahlf, W. and Steinberg, C. (1997) Ecotoxicological Assessment of Aquatic Sediments with Caenorhabditis elegans (Nematode)—A Method for Testing in Liquid Medium and Whole Sediment Samples. Environmental Toxicology and Chemistry, 16, 245-250.
- 26. Strmac, M. and Braunbeck, T. (1999) Effects of Triphenyltin Acetate on Survival, Hatching Success, and Liver Ultrastructure of Early Life Stages of Zebrafish (Danio rerio). Ecotoxicology and Environmental Safety, 44, 25-39.
http://dx.doi.org/10.1006/eesa.1999.1781 - 27. Osterauer, R. and Kohler, H. (2008) Temperature-Dependent Effect of the Pesticides Thiacloprid and Diazinon on the Embryonic Development of the Zebrafish (Danio rerio). Aquatic Toxicology, 86, 485-494.
http://dx.doi.org/10.1016/j.aquatox.2007.12.013 - 28. Villalobos, S., Hamm, K., The, S. and Hinton, D. (2000) Thiobencarb-Induced Embryotoxicity in Medaka (Oryzias latipes): Stage-Specific Toxicity and the Protective Role of the Chorion. Aquatic Toxicology, 48, 309-326.
http://dx.doi.org/10.1016/S0166-445X(99)00032-6 - 29. Werner, I., Geist, J., Okihiro, M., Rosenkranz, P. and Hinton, D. (2002) Effects of Dietary Exposure to the Pyrethroid Pesticide Esfenvalerate on Medaka (Oryzias latipes). Marine Environmental Research, 54, 609-614.
http://dx.doi.org/10.1016/S0141-1136(02)00151-4 - 30. Hayes, T., Case, P., Chui, S., Chung, D., Haeffele, C., Haston, K., Lee, M., Mai, V., Marjuoa, Y., Parker, J. and Tsui, M. (2006) Pesticide Mixtures, Endocrine Disruption, and Amphibian Declines: Are We Underestimating the Impact? Environmental Health Perspectives, 114, 40-50.
http://dx.doi.org/10.1289/ehp.8051 - 31. Bacchetta, R., Mantecca, P., Andrioletti, M., Vismara, C. and Vailati, G. (2008) Axial-Skeletal Defects Caused by Carbaryl in Xenopus laevis Embryos. Science of the Total Environment, 392, 110-118.
http://dx.doi.org/10.1016/j.scitotenv.2007.11.031 - 32. Robles-Mendoza, C., Garcia-Basilio, C., Cram-Heydrich, S., Hernandez-Quiroz, M. and Vanegas-Perez, C. (2009) Organophosphorus Pesticides Effect on Early Stages of the Axolotl Ambystoma mexicanum (Amphibia: Caudata). Chemosphere, 74, 703-710.
http://dx.doi.org/10.1016/j.chemosphere.2008.09.087 - 33. Lele, Z. and Krone, P.H. (1996) The Zebrafish as a Model System in Developmental, Toxicological and Transgenic Research. Biotechnology Advances, 14, 57-72.
http://dx.doi.org/10.1016/0734-9750(96)00004-3 - 34. Hill, A.J., Teraoka, H., Heideman, W. and Peterson, R.E. (2005) Zebrafish as a Model Vertebrate for Investigating Chemical Toxicity. Toxicological Sciences, 86, 6-19.
http://dx.doi.org/10.1093/toxsci/kfi110 - 35. Yang, L., Ho, N.Y., Alshut, R., Legradi, J., Weiss, C., Reischl, M., Mikut, R., Liebel, U., Muller, F. and Strahle, U. (2009) Zebrafish Embryos as Models for Embryotoxic and Teratological Effects of Chemicals. Reproductive Toxicology, 28, 245-253.
http://dx.doi.org/10.1016/j.reprotox.2009.04.013 - 36. Sipes, N.S., Padilla S. and Knudsen, T.B. (2011) Zebrafish as an Integrative Model for Twenty-First Century Toxicity Testing. Birth Defects Research Part C: Embryo Today, 93, 256-267.
http://dx.doi.org/10.1002/bdrc.20214 - 37. Goolish, E.M., Okutake, K. and Johnson, P. (2000) The Behavioral Response of Zebrafish to Hypergravity Conditions. Journal of Gravitational Physiology, 7, 99-100.
- 38. Mizell, M. and Romig, E.S. (1997) The Aquatic Vertebrate Embryo as a Sentinel for Toxins: Zebrafish Embryo Dechorionation and Perivitelline Space Microinjection. International Journal of Developmental Biology, 41, 411-423.
- 39. Murk, A.J., Leglar, J., Denison, M.S., Giesy, J.P., van de Guchte, C. and Brouwer, A. (1996) Chemical Activated Luciferase Gene Expression (CALUX): A Novel in Vitro Bioassay for Ah Receptor Active Compounds in Sediments and Pore Water. Fundamental and Applied Toxicology, 33, 149-160.
http://dx.doi.org/10.1006/faat.1996.0152 - 40. Erbe, M., Ramsdorf, W., Vicari, T. and Cestari, M. (2011) Toxicity Evaluation of Water Samples Collected near a Hospital Waste Landfill through Bioassays of Genotoxicity Piscine Micronucleus Gest and Comet Assay in Fish Astyanax and Ecotoxiticy Vibrio fischeri and Daphnia magna. Ecotoxicology, 20, 320-328.
http://dx.doi.org/10.1007/s10646-010-0581-1 - 41. Buckalew, D., Hartman, L., Grimsley, G., Martin, A. and Register, K. (2006) A Long-Term Study Comparing Membrane Filtration with Colilert Defined Substrates in Detecting Fecal Coliforms and Escherichia coli in Natural Waters. Journal of Environmental Management, 80, 191-197.
http://dx.doi.org/10.1016/j.jenvman.2005.08.024 - 42. Virginia Department of Environmental Quality (VA DEQ) (2012) Final 2012 305(b)/303(d) Water Quality Assessment Integrated Report.
http://www.deq.virginia.gov/Programs/Water/WaterQualityInformationTMDLs/WaterQualityAssessments/2012305%28b%29303%28d%29IntegratedReport.aspx - 43. Kudoh, T., Tsang, M., Hukriede, N., Chen, X., Dedekian, M., Clarke, C., Kiang, A., Schultz, S., Epstein, J., Toyama, R. and Dawid, I. (2001) A Gene Expression Screen in Zebrafish Embryogenesis. Genome Research, 11, 1979-1987.
http://dx.doi.org/10.1101/gr.209601 - 44. Reifers, F., Bohli, H., Walsh, E., Crossley, P., Stainier, D. and Brand, M. (1998) Fgf8 Is Mutated in Zebrafish acerebellar (ace) Mutants and Is Required for Maintenance of Midbrain-Hindbrain Boundary Development and Somitogenesis. Development, 125, 2381-2395.
- 45. Yelon, D., Horne, S. and Stainier, D. (1999) Restricted Expression of Cardiac Myosin Genes Reveals Regulated Aspects of Heart Tube Assembly in Zebrafish. Developmental Biology, 214, 23-37.
http://dx.doi.org/10.1006/dbio.1999.9406 - 46. Gupta, T. and Mullins, M.C. (2010) Dissection of Organs from the Adult Zebrafish. Journal of Visualized Experiments, 37, Article ID: e1717.
http://dx.doi.org/10.3791/1717 - 47. Parichy, D., Elizondo, M., Mills, M., Gordon, T. and Engeszer, R. (2009) Normal Table of Postembryonic Zebrafish Development: Staging by Externally Visible Anatomy of the Living Fish. Developmental Dynamics, 238, 2975-3015.
http://dx.doi.org/10.1002/dvdy.22113 - 48. Kimmel, C., Ballard, W., Kimmel, S., Ullmann, B. and Schilling, T. (1995) Stages of Embryonic Development of the Zebrafish. Developmental Dynamics, 203, 253-310.
http://dx.doi.org/10.1002/aja.1002030302 - 49. Picker, A., Brennan, C., Reifers, F., Clarke, J., Holder, N. and Brand, M. (1999) Requirement for the Zebrafish Mid-Hindbrain Boundary in Midbrain Polarization, Mapping and Confinement of the Retinotectal Projection. Development, 126, 2967-2978.
- 50. Chen, J., van Eeden, F., Warren, K., Chin, A., Nusslein-Volhard, C., Haffter, P. and Fishman, M. (1997) Left-Right Pattern of Cardiac BMP4 May Drive Asymmetry of the Heart in Zebrafish. Development, 124, 4373-4382.
- 51. Chin, A., Tsang, M. and Weinberg, E. (2000) Heart and Gut Chiralities Are Controlled Independently from Initial Heart Position in the Developing Zebrafish. Developmental Biology, 227, 403-421.
http://dx.doi.org/10.1006/dbio.2000.9924 - 52. Gercken, J. and Sordyl, H. (2002) Intersex in Feral Marine and Freshwater Fish from Northeastern Germany. Marine Environmental Research, 54, 651-655.
http://dx.doi.org/10.1016/S0141-1136(02)00156-3 - 53. Segner, H., Navas, J.M., Schafers, C. and Wenzel, A. (2003) Potencies of Estrogenic Compounds in Vitro Screening Assays and in Life Cycle Test with Zebrafish in Vivo. Ecotoxicology and Environmental Safety, 54, 315-322.
http://dx.doi.org/10.1016/S0147-6513(02)00040-4 - 54. Antibus, R. and Linkins, A. (1989) Microbial and Rhizosphere Markers of Air Pollution Induced Stress. In: Biologic Markers of Air-Pollution Stress and Damage in Forests, National Academy Press, Washington DC, 233-244.
- 55. Adamus, P. (1996) Bioindicators for Assessing Ecological Integrity of Prairie Wetlands. EPA/600/R-96/082, US EPA Environmental Research Laboratory, Corvallis.
http://www.epa.gov/owow/wetlands/wqual/ppaindex.html - 56. Sims, A., Zhang, Y., Gajaraj, S., Brown, P. and Hu, Z. (2013) Toward the Development of Microbial Indicators for Wetland Assessment. Water Research, 47, 1711-1725.
http://dx.doi.org/10.1016/j.watres.2013.01.023 - 57. Paerl, H., Dyble, J., Moisander, P., Noble, R., Piehler, M., Pinckney, J., Steppe, T., Twomey, L. and Valdes, L. (2003) Microbial Indicators of Aquatic Ecosystem Change: Current Applications to Eutrophication Studies. FEMS Microbial Ecology, 46, 233-246.
http://dx.doi.org/10.1016/S0168-6496(03)00200-9 - 58. United States Environmental Protection Agency (2008) Ecological Condition Report: 6.6 What Are the Trends in Biomarkers of Exposure to Common Environmental Contaminants in Plants and Animals? US EPA, Washington DC.
- 59. Haendel, M., Tilton, F., Bailey, G. and Tanguay, R. (2004) Developmental Toxicity of the Dithiocarbamate Pesticide Sodium Metam in Zebrafish. Toxicological Sciences, 81, 390-400.
http://dx.doi.org/10.1093/toxsci/kfh202 - 60. Koprucu, K. and Aydin, R. (2004) The Toxic Effects of Pyrethroid Deltamethrin on Common Carp (Cyprinus carpio L.) Embryos and Larvae. Pesticide Biochemistry and Physiology, 80, 47-53.
http://dx.doi.org/10.1016/j.pestbp.2004.05.004 - 61. Tilton, F., La Du, J. and Tanguay, R. (2008) Sulfhydryl Systems Are a Critical Factor in the Zebrafish Developmental Toxicity of the Dithiocarbamate Sodium Metam (NaM). Aquatic Toxicology, 90, 121-127.
http://dx.doi.org/10.1016/j.aquatox.2008.08.008 - 62. DeMicco, A., Cooper, K., Richardson, J. and White, L. (2010) Developmental Neurotoxicity of Pyrethroid Insecticides in Zebrafish Embryos. Toxicological Sciences, 113, 177-186.
http://dx.doi.org/10.1093/toxsci/kfp258 - 63. Hamm, J. and Hinton, D. (2000) The Role of Development and Duration of Exposure to the Embryotoxicity of Diazinon. Aquatic Toxicology, 48, 403-418.
http://dx.doi.org/10.1016/S0166-445X(99)00065-X - 64. Lin, C., Hui, M. and Cheng, S. (2007) Toxicity and Cardiac Effects of Carbaryl in Early Developing Zebrafish (Danio rerio) Embryos. Toxicology and Applied Pharmacology, 222, 159-168.
http://dx.doi.org/10.1016/j.taap.2007.04.013 - 65. Honrubia, M., Paz Herraez, M. and Alvarez, R. (1993) The Carbamate Insecticide ZZ-Aphox Induced Structural Changes of Gills, Liver, Gall-Bladder, Heart, and Notochord of Rana perezi Tadpoles. Archives of Environmental Contamination and Toxicology, 25, 184-191.
http://dx.doi.org/10.1007/BF00212129 - 66. Degitz, S., Durhan, E., Tietge, J., Kosian, P., Holcombe, G. and Ankley, G. (2003) Developmental Toxicity of Methoprene and Several Degradation Products in Xenopus laevis. Aquatic Toxicology, 64, 97-105.
http://dx.doi.org/10.1016/S0166-445X(03)00022-5 - 67. Falconer, I.R., Chapman, H.F., Moore, M.R. and Ranmuthugala, G. (2006) Endocrine Disrupting Compounds: A Review of Their Challenge to Sustainable and Safe Water Supply and Water Reuse. Environmental Toxicology, 21, 181-191.
http://dx.doi.org/10.1002/tox.20172 - 68. Kolpin, D.W., Furlong, E.T., Meyer, M.T., Thurman, E.M., Zaugg, S.D., Barber, L.B. and Buxton, H.T. (2002) Pharmaceuticals, Hormones, and Other Organic Wastewater Contaminants in US Streams, 1999-2000: A National Reconnaissance. Environmental Science and Technology, 36, 1202-1211.
http://dx.doi.org/10.1021/es011055j - 69. Metcalfe, C.D., Metcalfe, T.L., Kiparissis, Y., Koening, B.G., Khan, C., Hughes, R.J., Croley, T.R., March, R.E. and Potter, T. (2001) Estrogenic Potency of Chemicals Detected in Sewage Treatment Plant Effluents as Determined by in Vivo Assays with Japanese Medaka (Oryzias latipes). Environmental Toxicology and Chemistry, 20, 297-308.
http://dx.doi.org/10.1897/1551-5028(2001)020<0297:EPOCDI>2.0.CO;2 - 70. Ashfield, L.A., Pottinger, T.G. and Sumpter, J.P. (1998) Exposure of Female Juvenile Rainbow Trout to Alkylphenolic Compounds Results in Modifications to Growth and Ovosomatic Index. Environmental Toxicology and Chemistry, 17, 679-686.
http://dx.doi.org/10.1002/etc.5620170423 - 71. Gray, M.A. and Metcalfe, C.D. (1997) Induction of Testis-Ova in Japanese Medaka (Oryzias latipes) Exposed to p-Nonylphenol. Environmental Toxicology and Chemistry, 16, 1082-1086.
- 72. Jobling, S., Sheahan, D., Osborne, J.A., Matthiessen, P. and Sumpter, J.P. (1996) Inhibition of Testicular Growth in Rainbow Trout (Oncorhynchus mykiss) Exposed to Estrogenic Alkyl-Phenolic Chemicals. Environmental Toxicology and Chemistry, 15, 194-202.
http://dx.doi.org/10.1002/etc.5620150218 - 73. Silva, P., Rocha, M.J., Cruzeiro, C., Malhao, F., Reis, B., Urbatzka, R., Monteiro, R.A.F. and Rocha, E. (2012) Testing the Effects of Ethinylestradiol and of an Environmentally Relevant Mixture of Xenoestrogens as Found in the Douro River (Portugal) on the Maturation of Fish Gonads—A Stereological Study Using the Zebrafish (Danio rerio) as a Model. Aquatic Toxicology, 124-125, 1-10.
http://dx.doi.org/10.1016/j.aquatox.2012.07.002 - 74. Wang, M., Chen, J., Lin, K., Chen, Y., Hu, W., Tanguay, R.L., Huang, C. and Dong, Q. (2011) Chronic Zebrafish PFOS Exposure Alters Sex Ratio and Maternal Related Effects in F1 Offspring. Environmental Toxicology and Chemistry, 30, 2073-2080.
http://dx.doi.org/10.1002/etc.594
NOTES

*Corresponding author.