Journal of Water Resource and Protection
Vol.4 No.6(2012), Article ID:19896,9 pages DOI:10.4236/jwarp.2012.46040
Determination of Aquifer Properties and Groundwater Vulnerability Mapping Using Geoelectric Method in Yenagoa City and Its Environs in Bayelsa State, South South Nigeria
Department of Geology & Physics, Niger Delta University, Wilberforce Island, Nigeria
Email: *okenlani@yahoo.com
Received March 15, 2012; revised April 9, 2012; accepted May 12, 2012
Keywords: Geoelectrical Soundings; Aquifer Properties; Transmissivity; Transverse Resistance
ABSTRACT
Nineteen Schlumberger vertical electrical soundings (VES) were carried out within and around Yenagoa city, South South Nigeria, using a maximum current electrode separation ranging between 300 - 400 m. The objectives of the study were 1) to evaluate the possibility of mapping Quaternary sediments to infer the geological structure from the electrical interpretation and identify formations that may hold fresh water with low concentration of conducting minerals such as iron 2) to evaluate the vulnerability of the aquifer in the study area. The interpretation of the data collected was by computer assisted iterative interpretation using 1-D inversion technique software (1X1D, Interpex, USA). The results of the interpretation revealed four distinct geoelectric layers. Sounding curve types obtained in the area are mostly of the form ρ1 > ρ2 < ρ3 < ρ4 (where ρ is the density) but fresh water lenses with low concentration of conducting minerals such as iron were obtained only in locations that exhibit ρ1 < ρ2 > ρ3 < ρ4 curve types. Depth to the aquifer ranges from 4.5 m in the vicinity of VES 05 to 27.0 m at the vicinity of VES 14. The resistivity of the aquiferous horizon varies between 60 - 2868 Ωm. High transverse resistance values obtained were associated with zones of high transmissivity which agrees with the geology of the Benin Formation (Coastal Plain sands) consisting of fine-medium-coarse sands. The aquifer vulnerability map illustrates the impermeability of the overburden clay layer. Values of >0.5 mhos indicate good protective capacity, while values <0.3 mhos indicate vulnerable zones with probable risk of contamination.
1. Introduction
In the last decade, Yenagoa City in Bayelsa State has witnessed a continuous influx of companies and people due to its state capital status. Though, the city is surrounded by water, it lacked the quality for human consumption due to pollution occasioned by the activities of the multi national oil companies. Recently, illegal bunkering and crude oil refining activities by the locals had aggravated an already bad case. This is further compounded by the non availability of municipal water supply, compelling most residents to depend largely on boreholes or hand-dug wells for their domestic water supply.
Bayelsa State is located within the transition zone of the Coastal sedimentary lowlands hydrogeologic province in Southern Nigeria. The area is underlain by a thick series of sedimentary rocks. The consequence is that the area has thus been taken for granted as a sustaining source of good quality groundwater. The general approach to water supply however, is indiscriminate sinking of boreholes without preliminary geological, geophysical and hydrogeological investigation. This has generally resulted in very low success rate in that many boreholes are abandoned due to high iron content, seasonal or temporally functional boreholes. Also, due to paucity of relevant studies in the area, we remain ignorant of the subsurface geological structure, and thus lack adequate knowledge of the groundwater quality variation in the area.
Aside, due to rapid urbanization, waste generation has increased; hence a common feature in the city is that refuse dumps are ubiquitous. The Tombia road refuse disposal site which was very far from the inhabited areas in the early 90s is now totally within the fully developed metropolis and is still receiving refuse. Additionally, the uncontrolled location and leakage of facilities most especially underground storage tanks of petroleum products, septic tanks of various households and shallow subsurface piping facilities are other potent sources that can provoke permanent damage of the underlying aquifers. This suggests that the ground water is susceptible to pollution if there is leakage of buried underground storage tanks thereby releasing organic contaminants or infiltration of leachate from decomposed refuse dumps. The need therefore arises to evaluate the protective capacity of the overburden materials in the area in order to establish the level of safety of the hydrogeologic system within the city. One of the most effective ways to evaluate this without interfering with the hydrogeologic system is through geophysical studies.
The most commonly used methods in determining aquifer characteristics involve drilling boreholes followed by analysis and interpretation of the soil and water samples. However, such tests are both capital and labour intensive requiring several boreholes, many operatives, and a considerable amount of equipment. An alternative approach for estimating aquifer characteristics is the use of surface geoelectrical methods. The surface geoelectrical method especially the Vertical Electrical Sounding (VES) method of geophysical investigation is a non-invasive, relatively cheap and quantitative evaluation technique used for locating sites/depths for groundwater exploitation. Besides, it is used as an effective tool for ascertaining the subsurface geological framework of an area [1-3]. In the present study, an attempt has been made to obtain a picture of the subsurface lithology with an aim of determining the configuration of the aquifer in the area which has hitherto lacked adequate geological data base and thus provide a systematic and scientific basis for the siting of prolific abstraction boreholes. Additionally, the groundwater vulnerability will be determined using resistivity sounding data. An approach of this kind not only reduces guess work with regards to the siting of abstraction wells, but also the cost outlay of prospecting for groundwater. It is hoped that this will assist government agencies in the planning, development and management of the groundwater resource in the state.
2. Study Area
2.1. Study Area Description
Yenagoa City is the capital of Bayelsa State and one of the rapidly growing urban centers in the South South geopolitical region of Nigeria (Figure 1). Major communities around the city include Ammassoma, Igbegene,
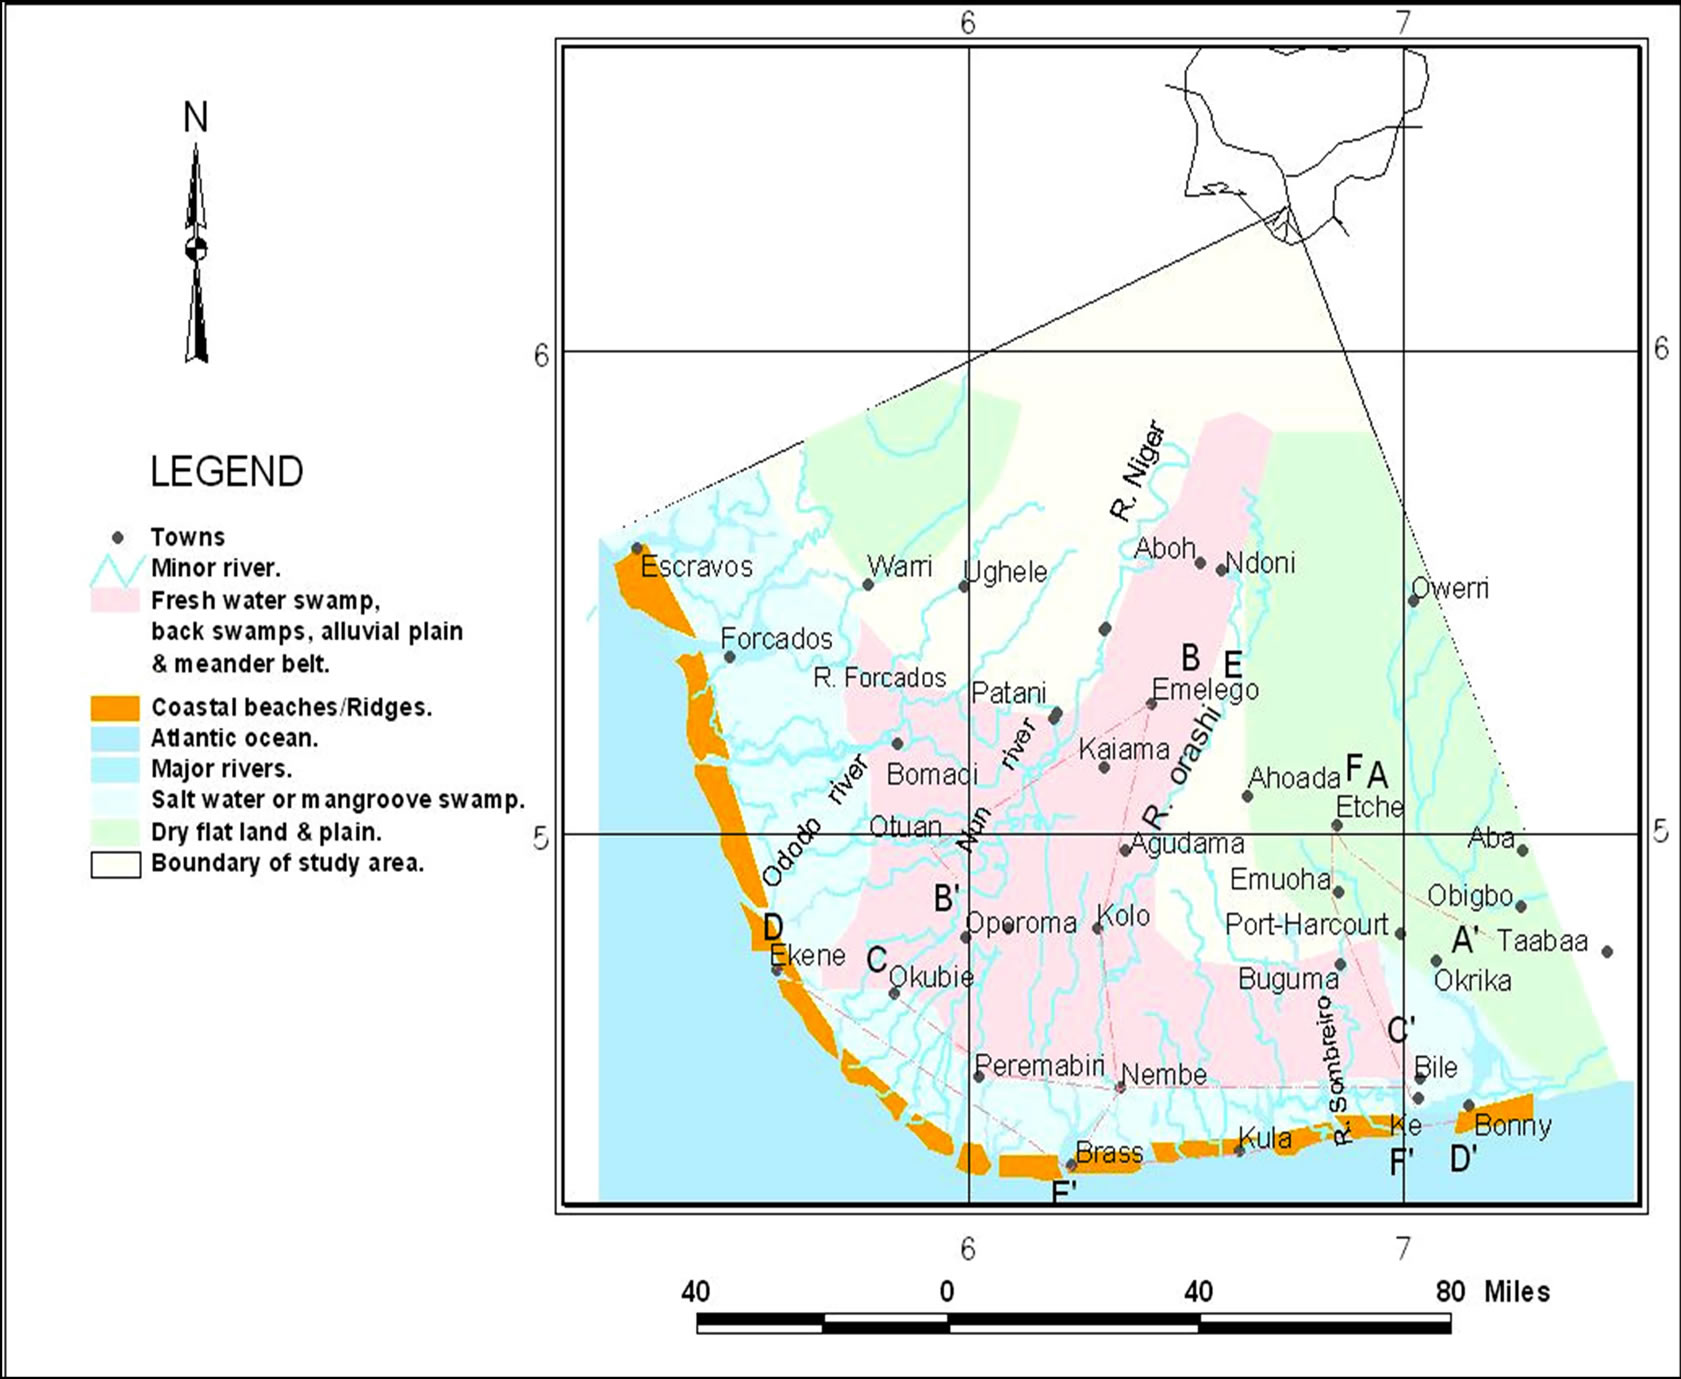
Figure 1. Geomorphic units of the Niger Delta (after Allen, 1965).
Emeyal II, Oloibiri, Otuoke, Ogbia Town etc. It has an aerial extent of about 70 km2 bounded by latitudes 4˚23.3' and 4˚38.2'N and Longitudes 6˚3' and 6˚40'E. There are two major climatic seasons in the area, the wet season from April to October and the dry season from November to March. Average annual rainfall is about 3000 mm [4] and this serves as the major source of groundwater recharge. This ensures a large volume of water input into the environment and with the poor drainage most parts of the city are flooded during the wet season, April to October/November. There are a number of perennial streams and rivers in the area of survey. They all form a network which empties to the Atlantic Ocean. As a result, most of the terrain is marshy and in some cases form beaches. The topography is invariably gentle. Plant type is generally mangrove except in the mainland areas where large areas are covered with oil palm and large trees.
2.2. Geology and Hydrogeology of the Study Area
The geology and geomorphology of the Niger Delta have been described in details by various authors [5-7]. The formation of the present day Niger Delta started during Early Paleocene and it resulted mainly from the build-up of fine grained sediments eroded and transported by the River Niger and its tributaries. The subsurface geology of the Niger Delta consists of three lithostratigraphic units (Benin, Agbada and Akata Formations) which are in turn overlain by quaternary sediments. The Benin formation is about 2100 m thick and is made up of over 90% massive, porous, coarse sands with localized clay/shale interbeds [5]. This formation is the most prolific aquifer in the region. The quaternary deposits is about 40 - 150 m thick and generally consist of rapidly alternating sequences of sand and silt/clay with the latter becoming increasingly more prominent seawards. The surface distribution of the various geomorphic units is shown in Table 1.
3. Materials and Method
The locations of the sounding stations are shown on Figure 2. A total of nineteen Schlumberger soundings were made in the study area. Maximum current-electrode separation (AB) range between 300 - 400 m. The instrument used was a resistivity meter ZTI 1500, a digital, self averaging instrument for DC resistivity work. Some of the special features of this equipment include its ability to display resistance, self potential and chargeability values directly on the screen, its portability and the ability to automatically compensate for polarization at the electrodes, induced polarization of the material, and instrumental drift effects. Four soundings were made at the sites of existing boreholes for comparative purposes. Existing boreholes beside which soundings were conducted are located at Azikoro Village, Okaka Housing Estate, Agudama and Akenfa III. The respective vertical electrical sounding (VES) stations are 02, 03, 08 and 09. The interpretation was by computer assisted iterative interpretation using 1-D inversion technique software (1X1D, Interpex, USA). Litholog data from the four boreholes was used to minimize the choice of equivalent models, by fixing thicknesses and depths to certain levels and allowing the adjustment of resistivity. Correlation between VES interpretation at stations 02, 03, 08 and 09 and borehole lithology determines the electrical characteristics of the rock units with depth. Table 2 presents the results of the interpretation of the VES stations. Figure 3 is typical sounding curves obtained in the area. The combination of thickness and resistivity into single variables, other words known as the Dar Zarrouk parameters [8] are often used as a basis for the evaluation of aquifer properties such as aquifer transmissivity and protection of groundwater resources [9].
The Dar Zarrouk parameters consist of the transverse resistance (RT) and longitudinal conductance (Lc). For a horizontal, homogeneous, and isotropic layer, the transverse resistance RT (Ωm2) is defined as:
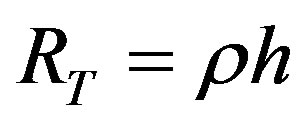 (1)
(1)
and the longitudinal conductance Lc (mho) is defined as:
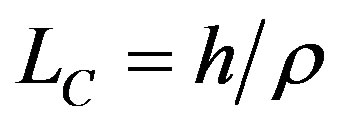 (2)
(2)
where h is the thickness of the layer (in metres) and ρ is the electrical resistivity of the layer in ohm-metres. But aquifer transmissivity (T) is expressed as:
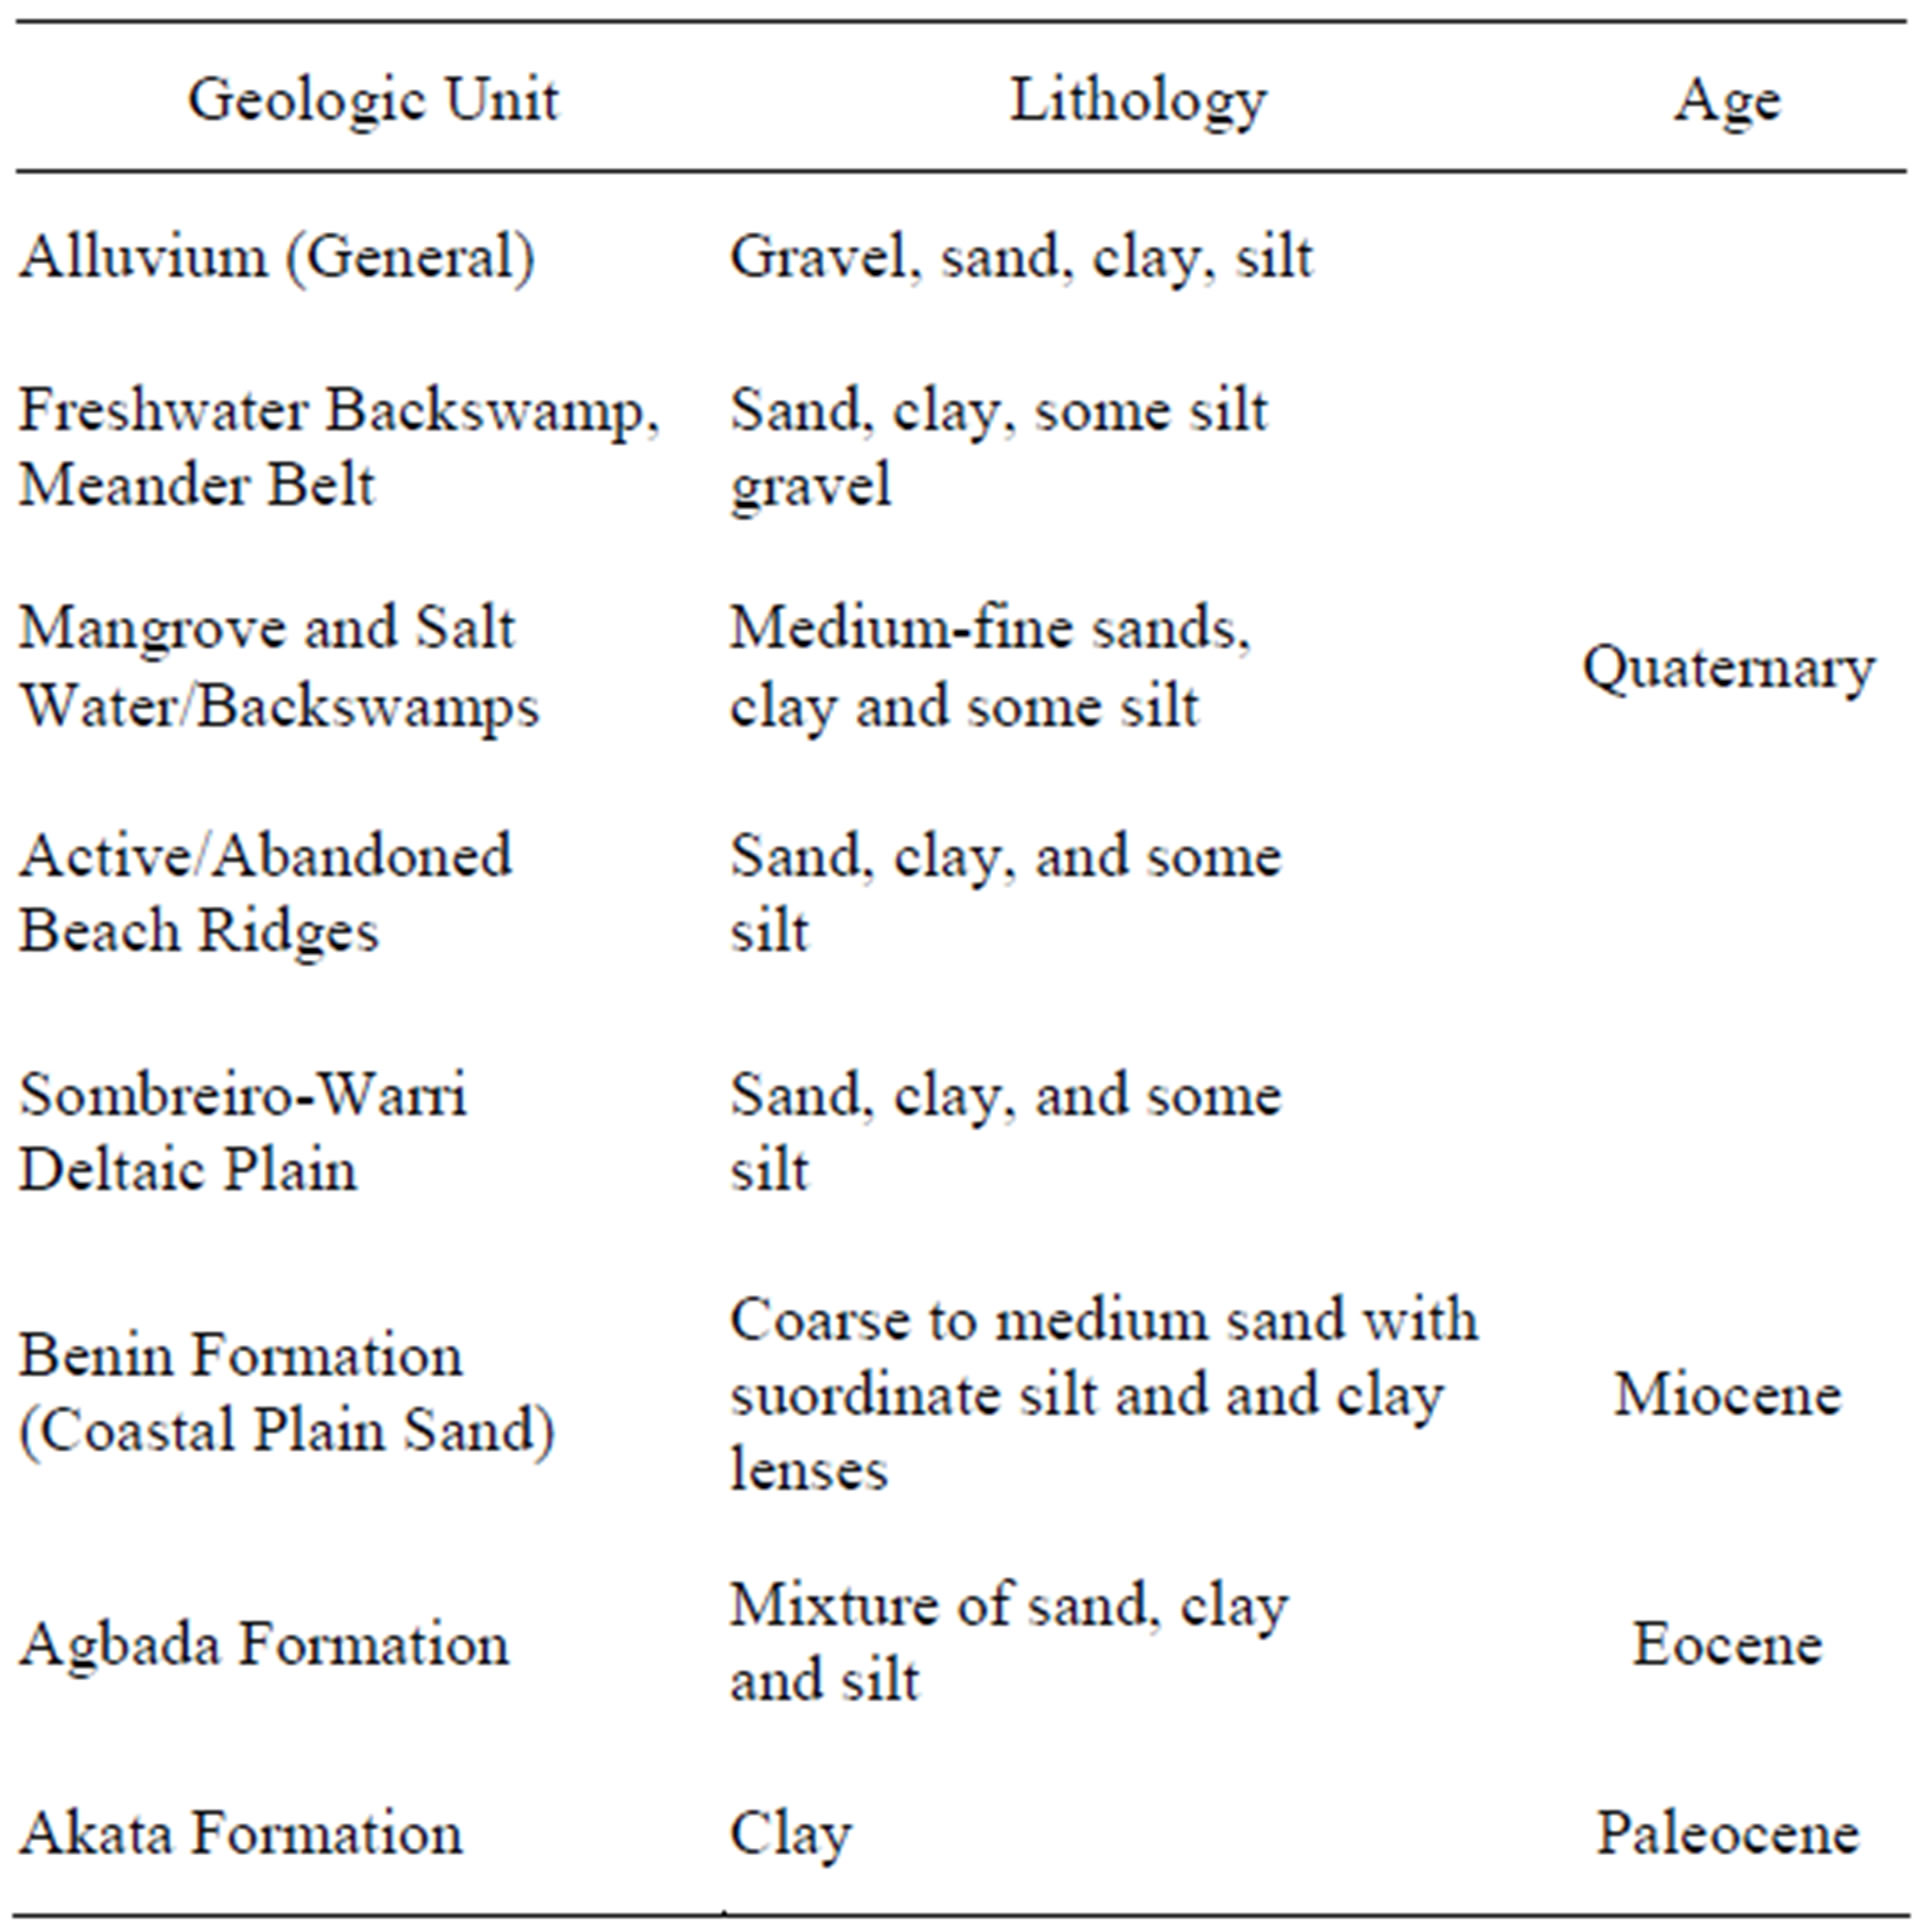
Table 1. Stratigraphic column of the Niger Delta (after Allen, 1965).
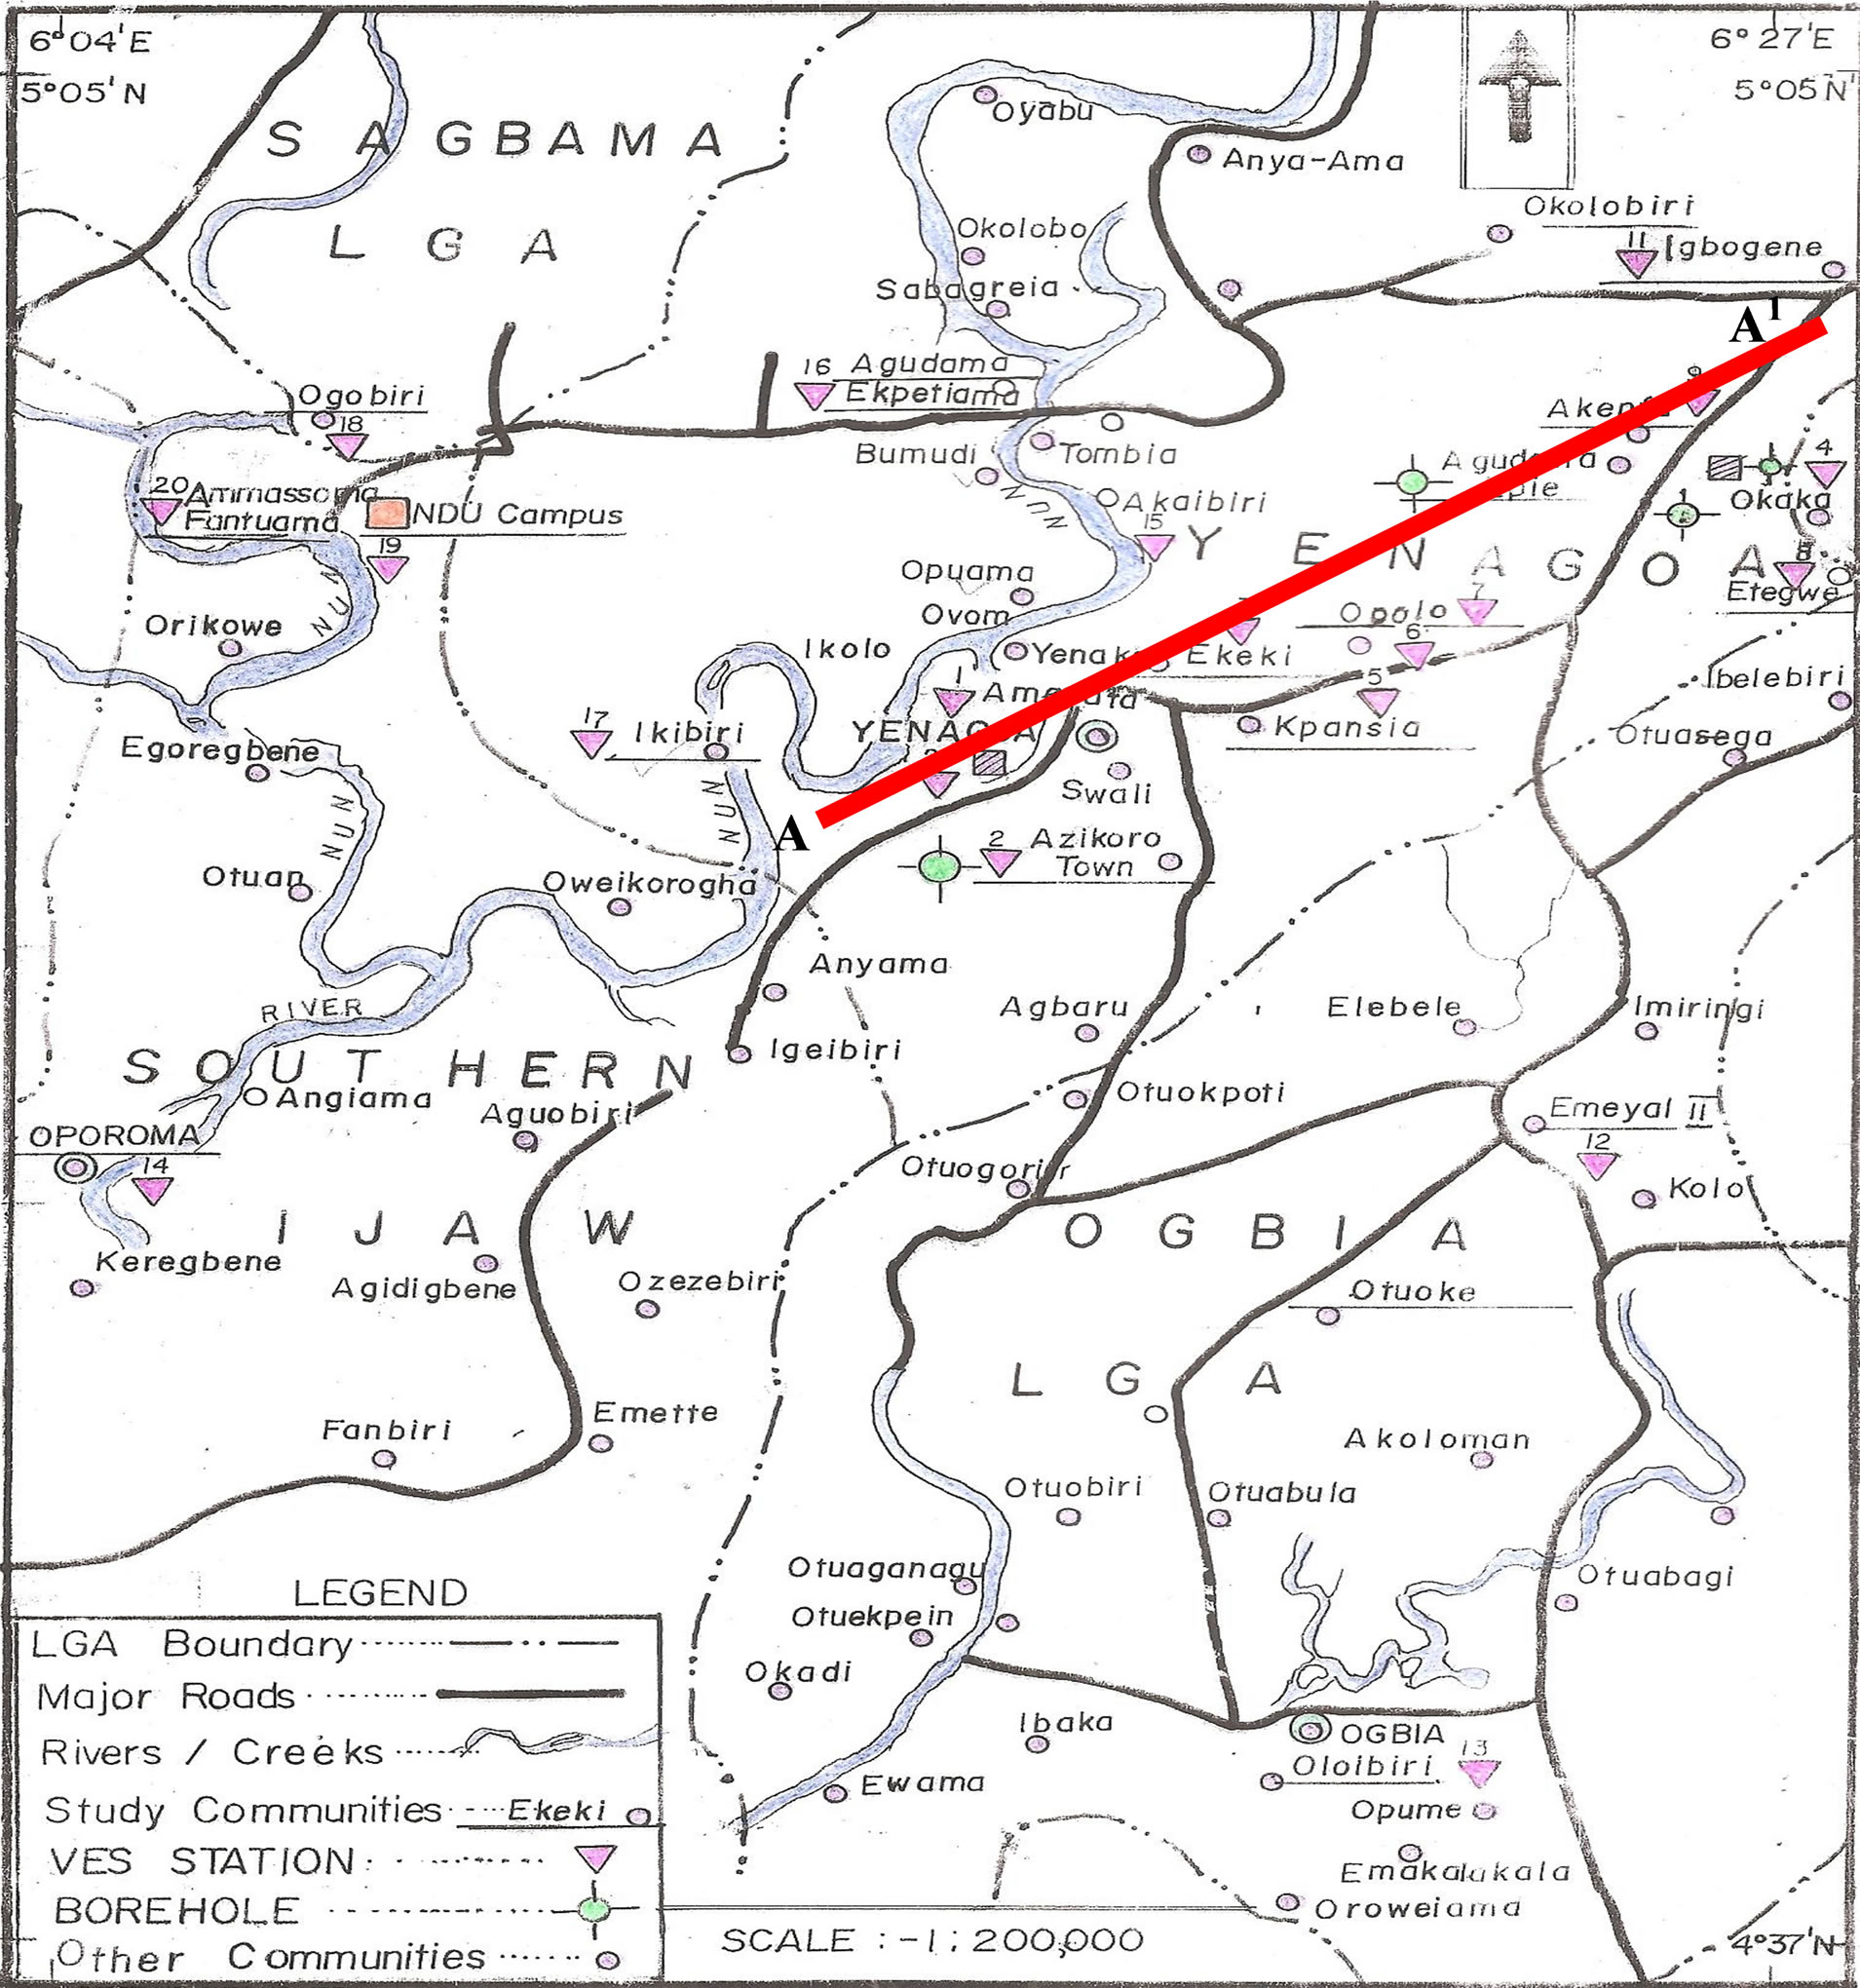
Figure 2. Map of study area showing sounding and borehole (BH) points.
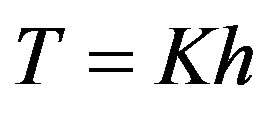 (3)
(3)
where K is the hydraulic conductivity (m/day). Since the hydraulic conductivity is directly proportional to the resistivity [10], on a purely empirical basis, it can be admitted that the transmissivity of an aquifer is directly propeortional to its transverse resistance [9,11].
The main natural protection of the fine-medium-coarse sand aquifer of the study area is provided by the clayey overburden. Henriet, [9] described the protective capacity of an overburden overlying an aquifer as being proportional to its hydraulic conductivity. On a purely empirical basis, the hydraulic conductivity of clayey sediment could be linked to electrical resistivity through the concept of clay content. High clay content generally corresponds with low resistivities and low hydraulic conductivities, and vice versa. Hence, the protective capacity of the overburden could be considered as being proportional to the ratio of thickness to resistivity, or in other words to the longitudinal conductance. Thus, Equation (2) was used to evaluate the aquifer vulnerability or protective capacity of the aquifer overburden.
4. Results and Discussion
The geoelectrical curves obtained are shown in Figure 3 and vary considerably throughout the study area. Typical forms of these curves are HA, HK, KH and A types. Most of the sounding curves obtained were of the HAtype (ρ1 > ρ2 < ρ3 < ρ4), i.e. a bowl shaped curve with a steeply descending left branch and a gently ascending right branch representing the presence of four geoelectric layers (Figure 3). The terminal branch of many of the HA curves rose steeply into positive slopes that made angles of 45˚ with the abscissa. Onuoha and Mbazi, [12] reported that such a steep rise in a sounding curve is a reflection of highly resistive sedimentary rocks at depth. The descending left branch indicates a resistive top soil underlain by a conductive material which could possibly be wet clays. The gently ascending right branch corresponds to the aquifer.
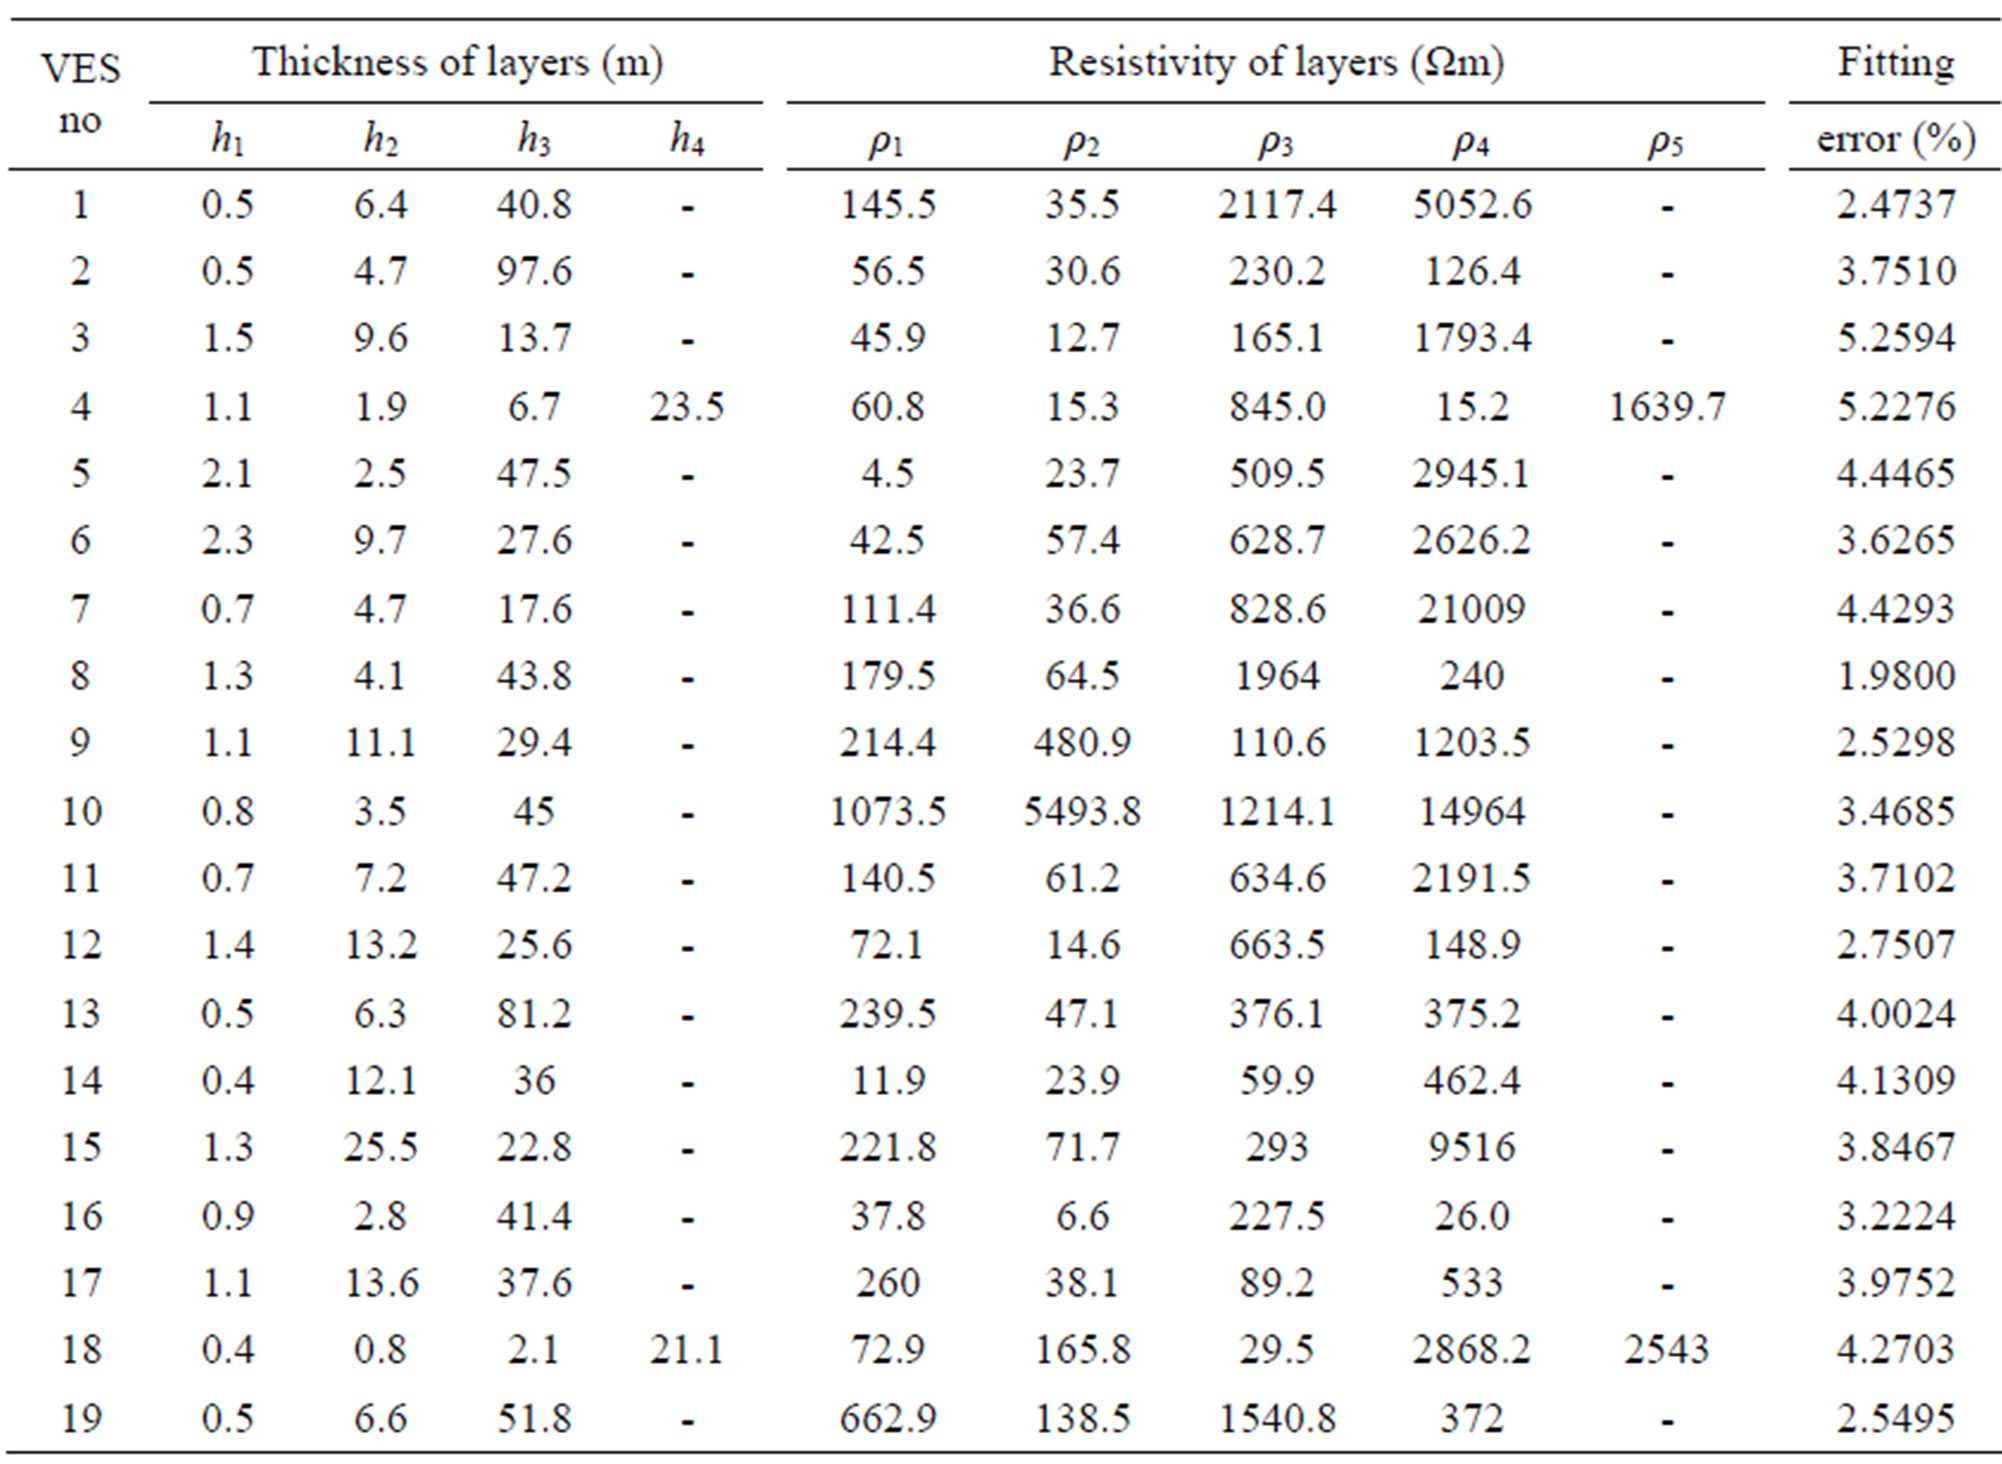
Table 2. Summary of aquifer geoelectric parameters.
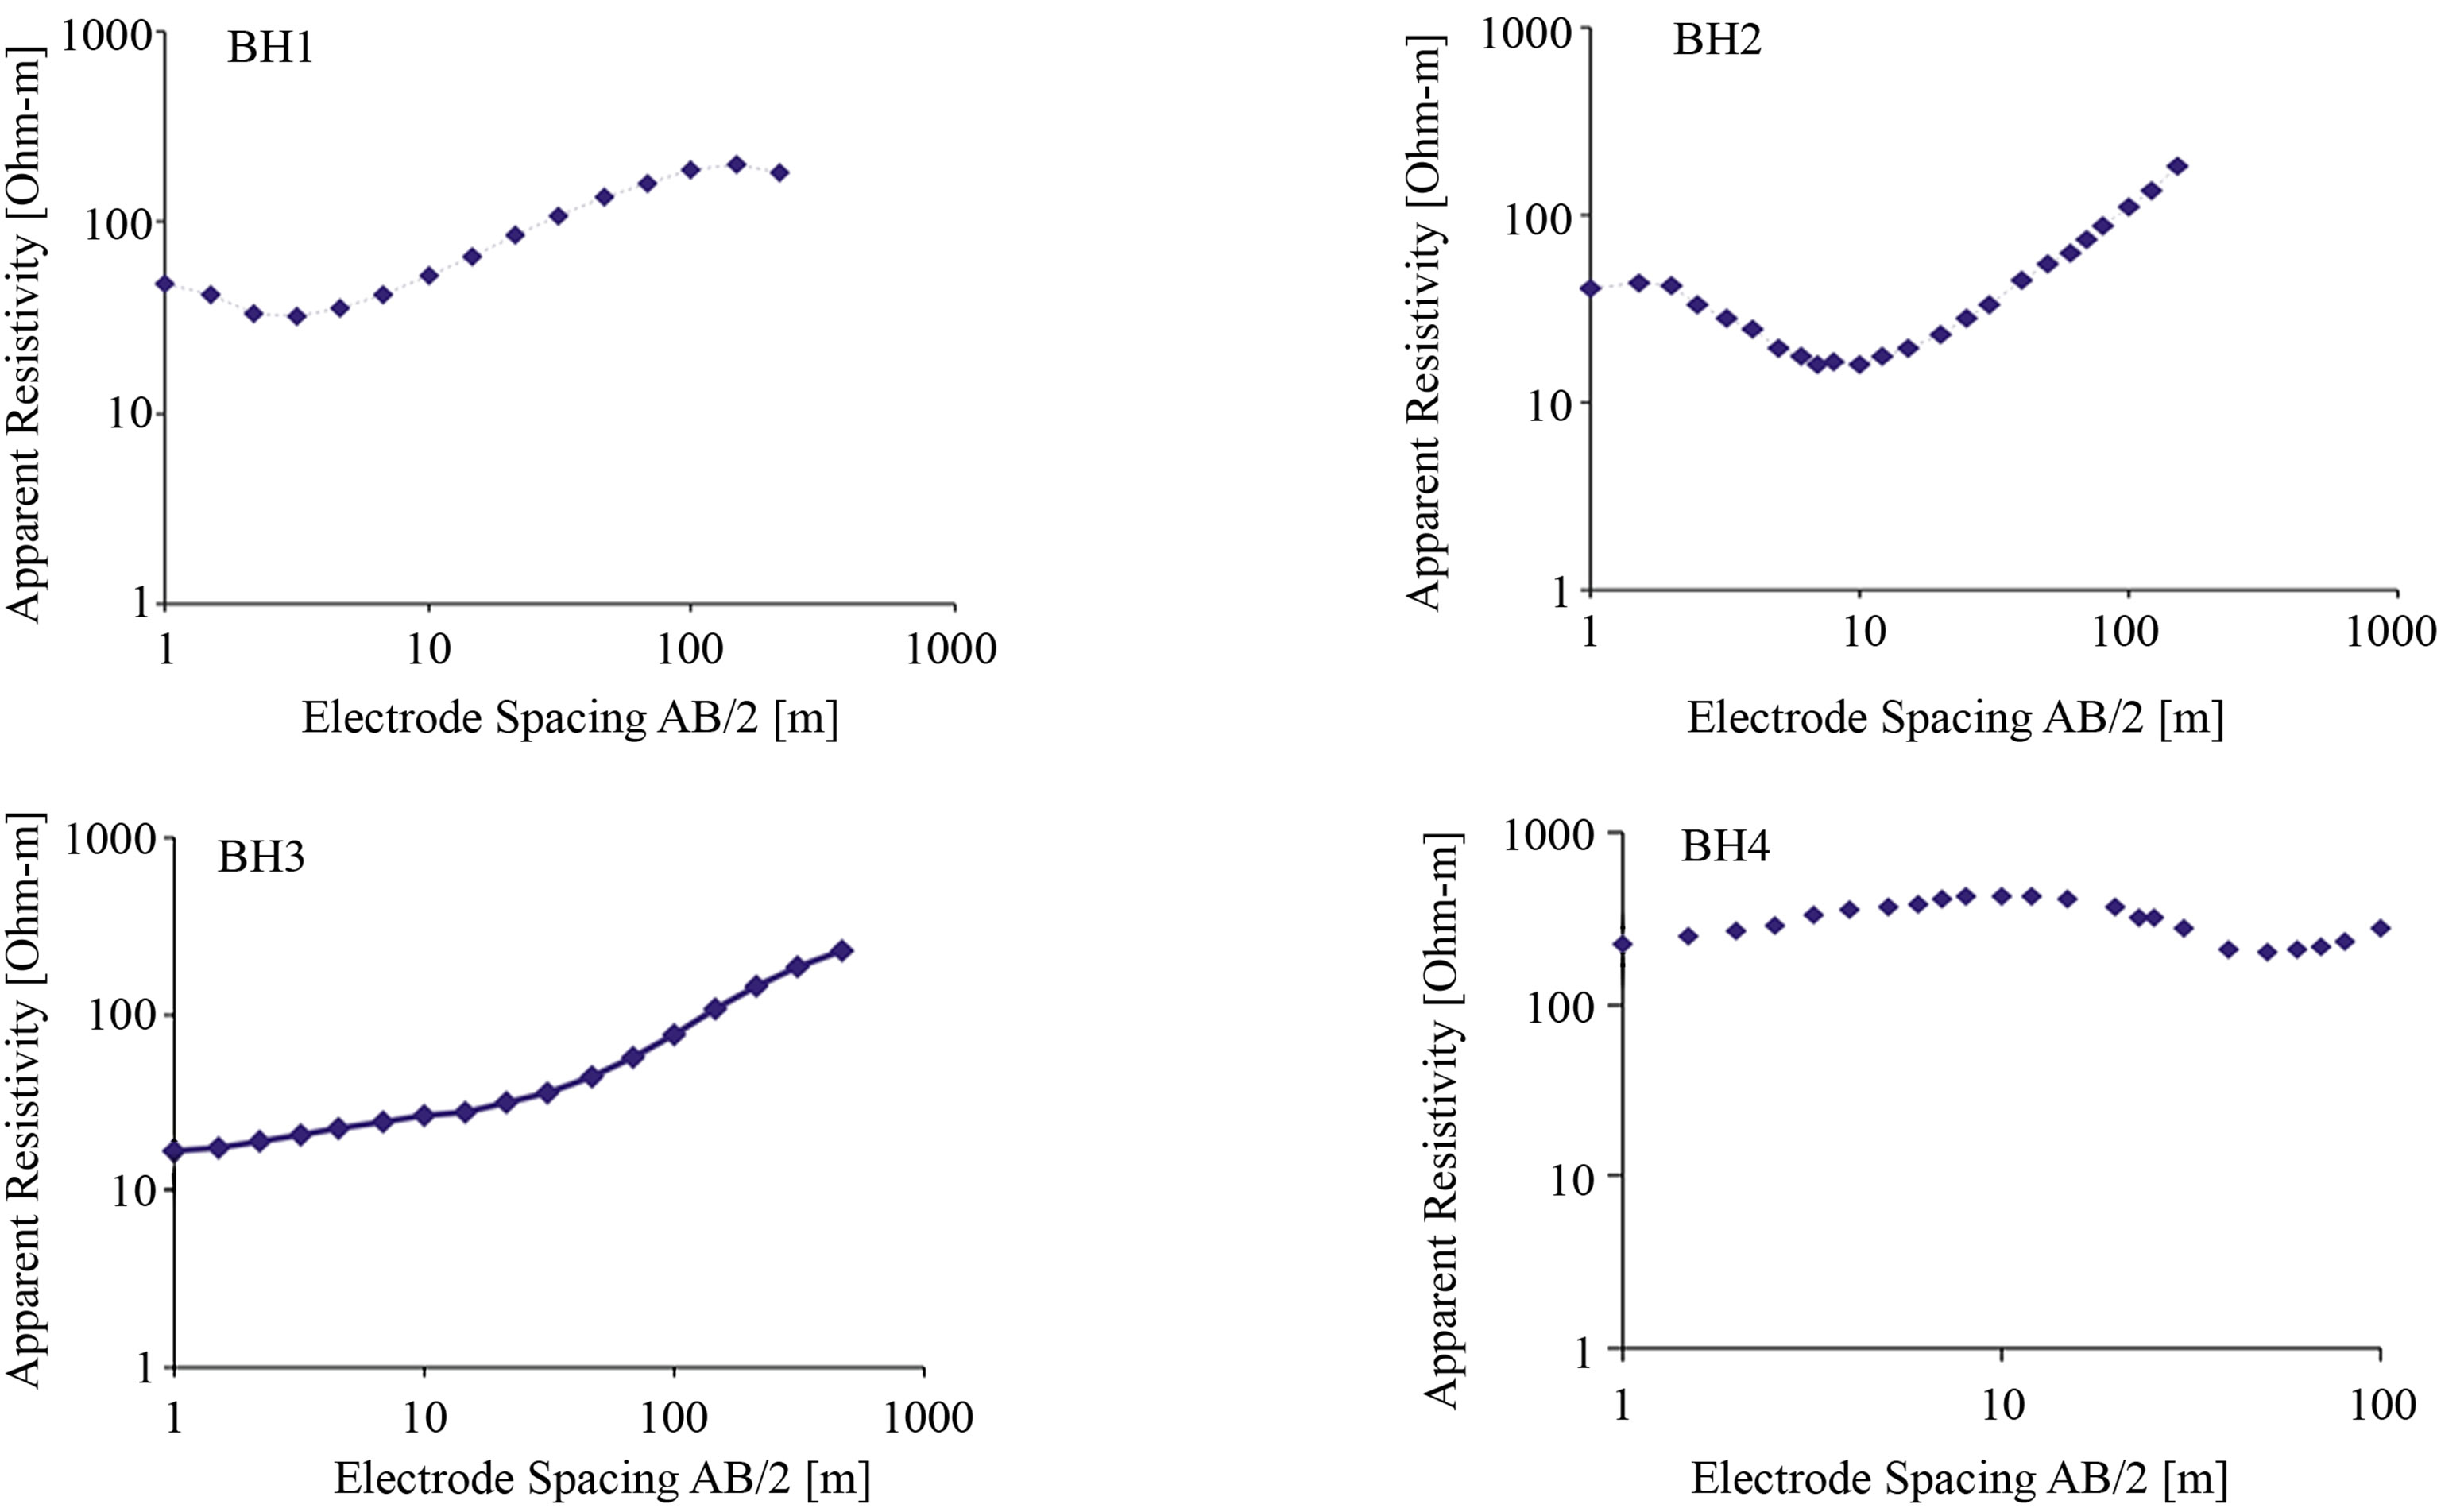
Figure 3. Resistivity sounding curves.
Comparison of the VES interpretation and the litholog at stations 2 is shown in Figure 4. The results of the data analysis show that the area under investigation can be generally interpreted as a four to five layered region down to the depth of investigation. The results of the soundings together with geological data were used to construct an interpretative cross section of the study area along profiles AA׳ (Figure 5(. The position of the cross section can be ascertained from Figure 2. The top layer thickness and resistivities range between 0.5 - 2.5 m and 12 - 1074 Ωm respectively and consists of weathered/dry organic rich peaty clay [13]. The second layer thickness and resistivities range between 0.8 - 13.0 m and 13 - 166 Ωm respectively and consist mainly of wet clay/silty clay. The third layer whose composition according to the lithologic logs is mainly fine-medium-coarse grained sands with few intercalation of clay lenses has been identified as the water-bearing layer, whose resistivity varies from place to place, but is within the range 60 - 2868 Ωm with an average of 829.5 Ωm. The clay lenses were not observed in the VES curves perhaps due to the principle of suppression. The variability in the resistivity values, 60 Ωm to 2868 Ωm of the aquifer indicates the interogeneity of the material in the layer. Depth to the aquifer ranges from 4.5 m in the vicinity of VES 05 to 27.0 m at the vicinity of VES 15.
The relatively high resistivity values imply a low concentration of conducting minerals and thus of high groundwater quality. The thickness of this layer varies between 13 - 97.0 m. Since hydraulic conductivity increases with resistivity, a higher yield is expected from this aquifer with high resistivity values. One of the key objectives of this study was to identify areas where the concentration of conducting minerals such as iron is low in the groundwater. Boreholes were drilled based on the strength of the VES interpretation. In most of the locations, the water turned “orange in colour” after few minutes of abstraction. Though chemical analysis had not been carried out on the water samples, we believe that the change in colour of the water is due to a high concentration of conducting minerals presumably iron. Only areas that exhibit “KH” curve types (e.g vicinity of VES 09, 10) produce water with low concentration of conducting minerals e.g iron at depth ranging between 13 - 20 m in the study area that would require little or no treatment. Experience has shown that a well drilled in the vicinity of a successful well that produce water with low concentration of conducting minerals such as iron may not produce water with the same quality. We infer therefore that the aquifer may be internally subdivided giving rise to significant groundwater quality variation, and sand bodies within the aquifer that produce water with low concentration of conducting minerals such as iron may be lenticular, sinuous and discontinuous.
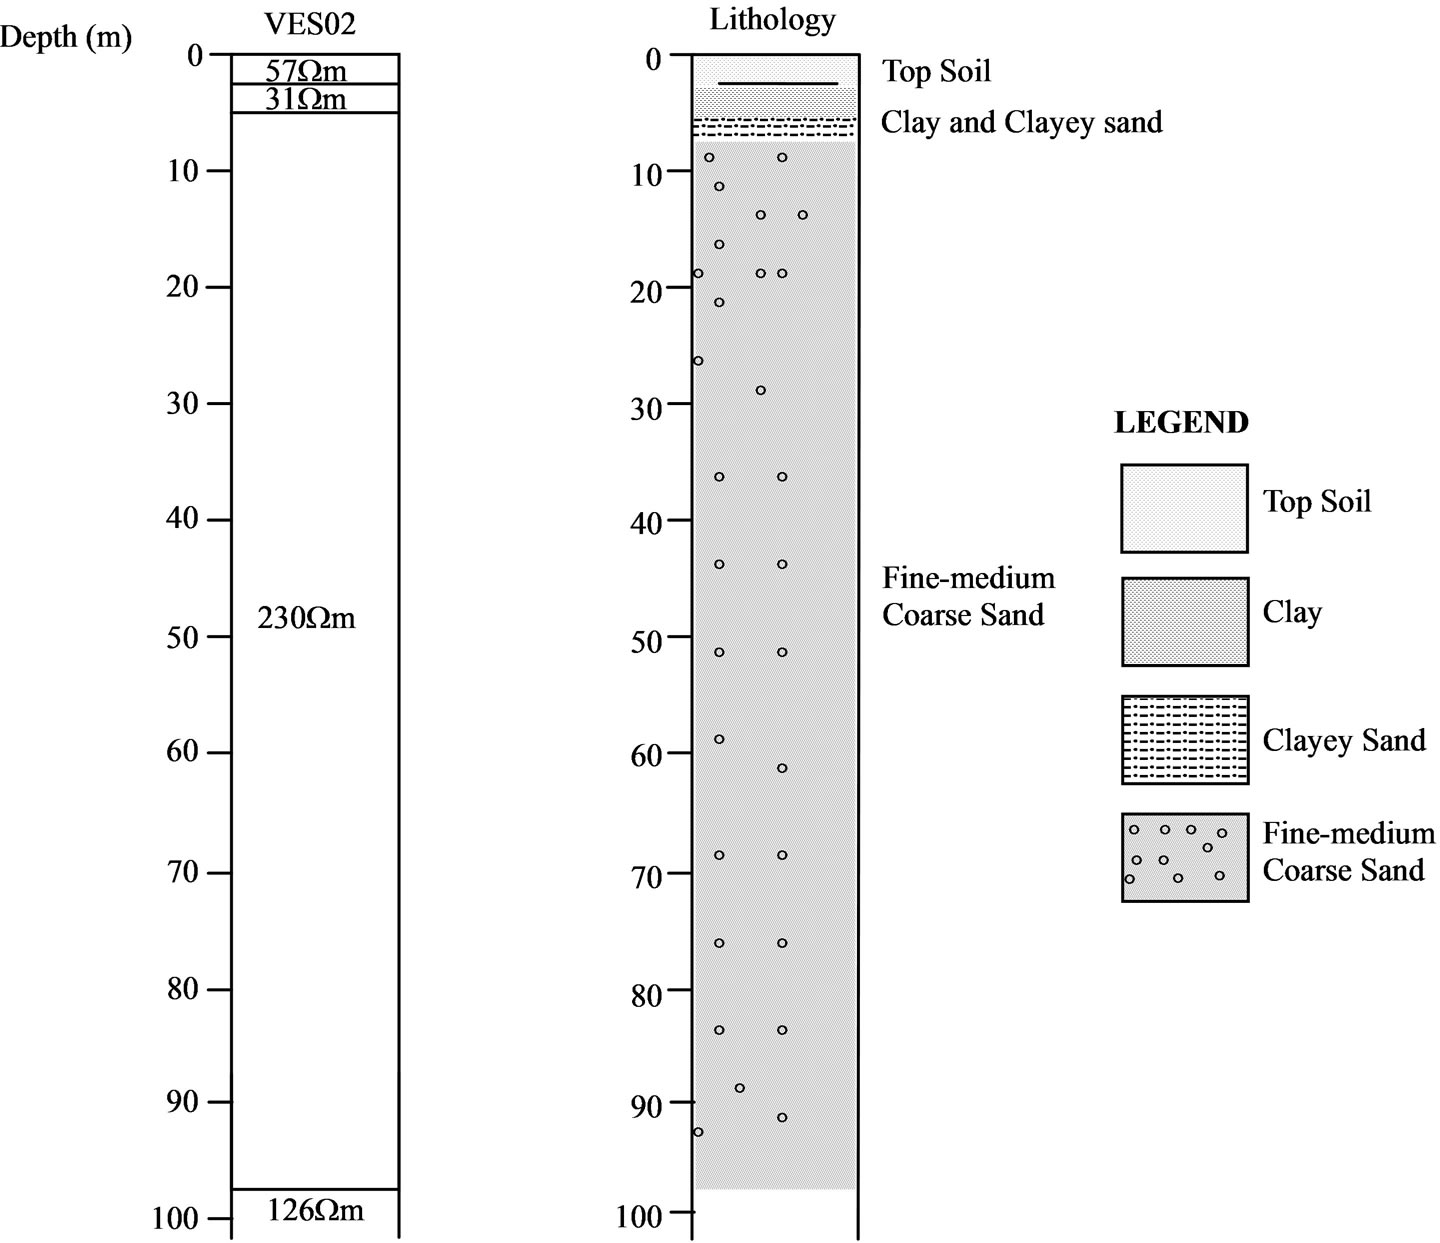
Figure 4. Correlation of VES 02 and lithology.
Estimated transverse resistance values are presented in Table 3. Transverse resistance of any subsurface geological formation is given by the product of resistivity and thickness. A geological formation reflecting a predominantly high transverse resistance values indicates that its resistivity is high or it has high thickness with presumably favorable aquifer conditions. Table 3 shows that the transverse resistance values are high, thus it is

Figure 5. Geoelectric section for profile AA1.

Table 3. Summary of electrical properties at all stations.
assumed that the aquifer may likely have high transmissivity with good groundwater potentials. This assertion agrees well with transmissivity values determined from pumping test data. Measured transmissivity values range from 1634.0 m2/day in the vicinity of VES 4 (Okaka) to 5292.0 m2/day in the vicinity of VES 2 (Azikoro Town). This result is consistent with the fact that the aquifer is composed of unconsolidated fine-medium-coarse sand.
By using the clay resistivities measured from the geoelectric survey (Table 2), it was possible to evaluate the total longitudinal unit conductance of the clay overburden (Table 3). The resulting information was compiled into a vulnerability map (Figure 6) which gives a detailed distribution pattern of the natural overburden protection of the aquifer in the study area. The total longitudinal unit conductance values were utilized in evaluating the vulnerability or protective capacity of the aquifer because according to Mogaji et al., [14], the earth medium acts as a natural filter to percolating fluid and that it’s ability to retard and filter percolating fluid is a measure of its protective capacity. Henriet, [9] suggested that the protective capacity of an overburden overlying an aquifer is being proportional to its hydraulic conductivity. High clay content which impeded fluid movement is generally characterized by low resistivity values and low hydraulic conductivities and thus low longitudinal unit conductance. Table 4 presents longitudinal conductance/protective capacity ratings. This longitudinal unit conductance/protective capacity rating table after Henriet,
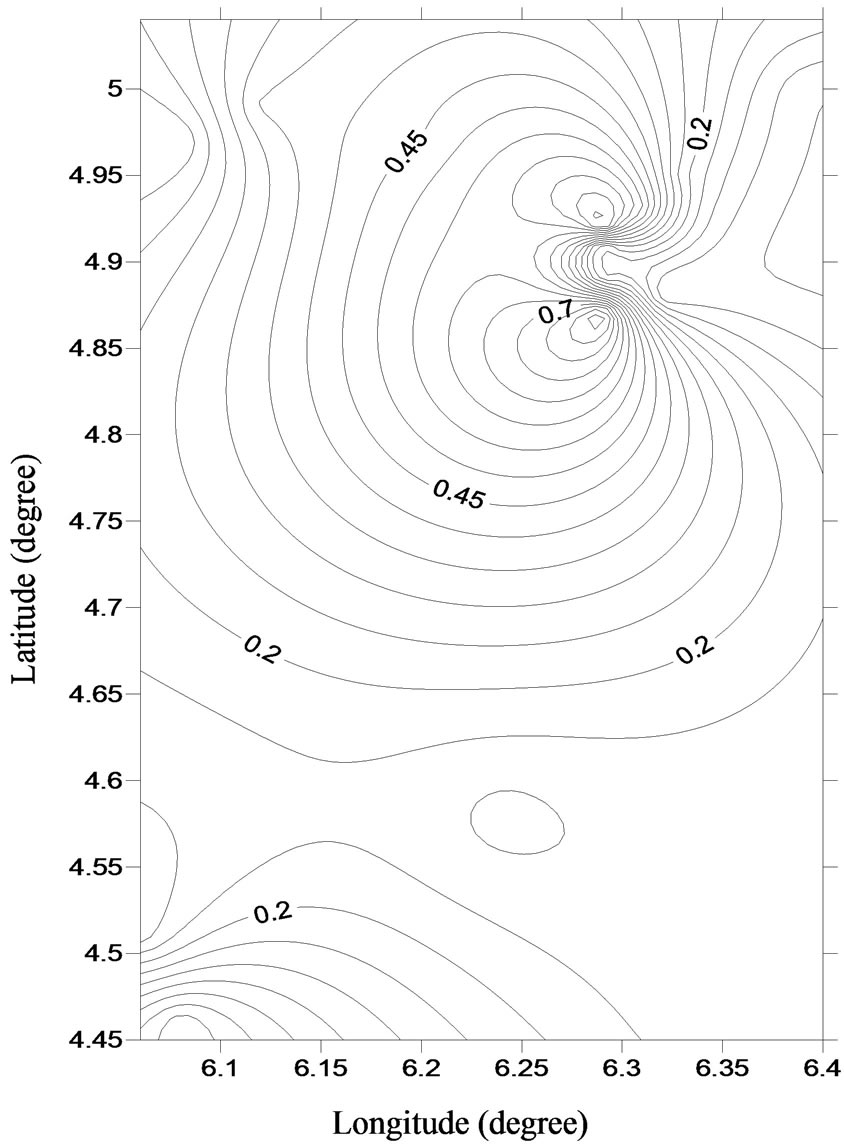
Figure 6. Aquifer vulnerability map.
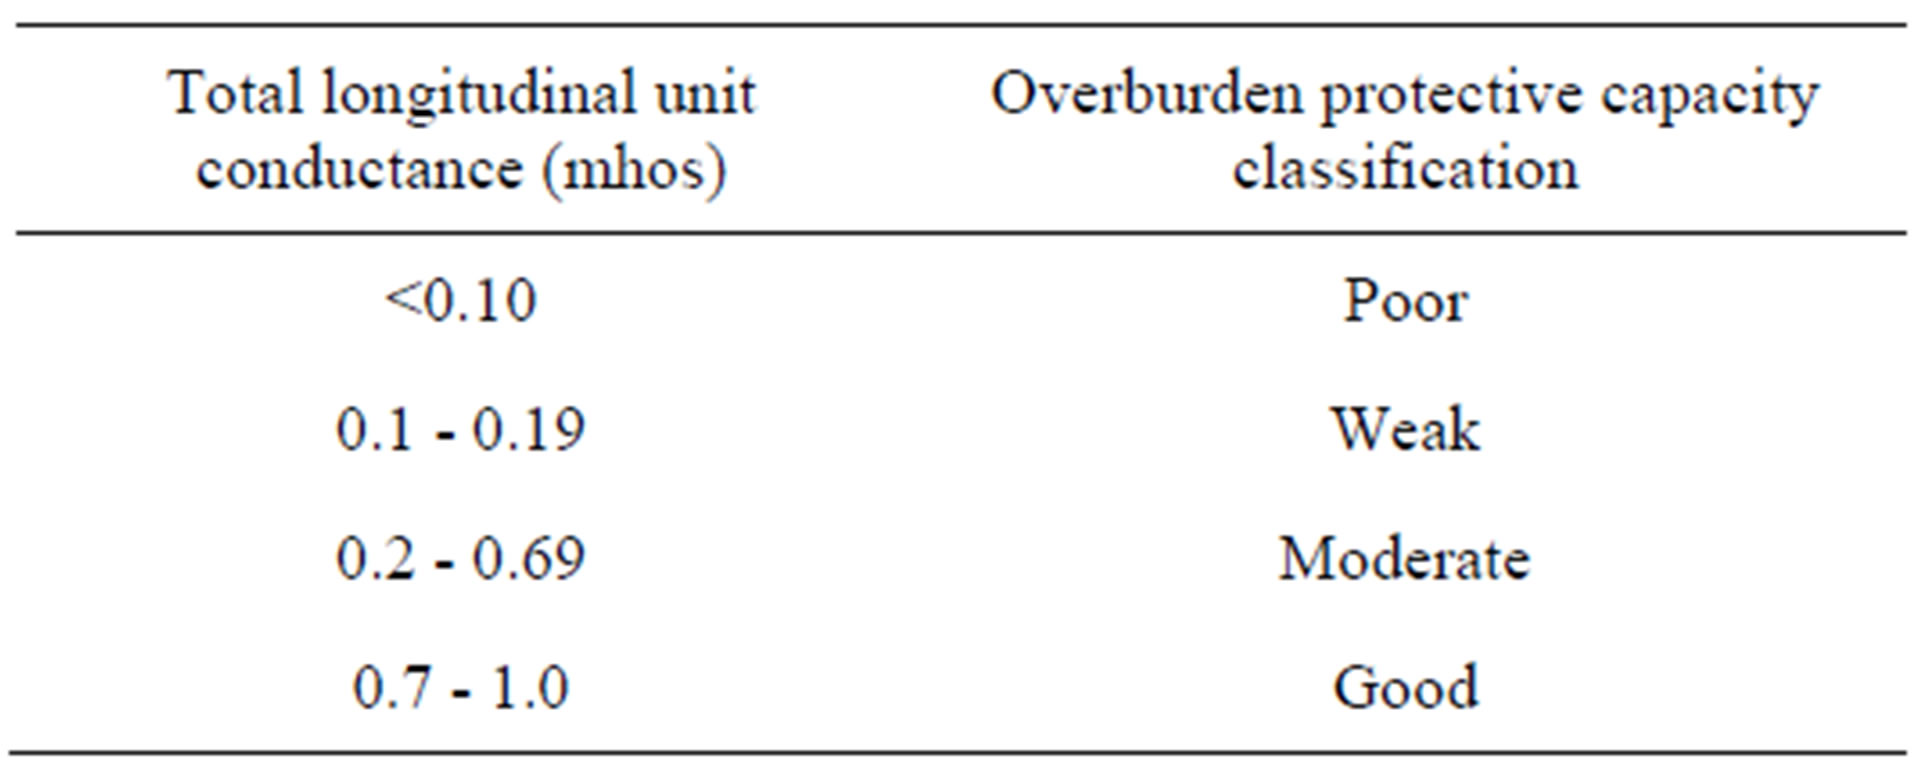
Table 4. Longitudianl conductance/protective capacity rating (after Henriet, 1976).
[9] enables the classification of the study area into poor, weak, moderate and good protective capacity zones. Areas that are classified poor and weak are vulnerable or susceptible to contamination.
Areas that are classified moderate are less susceptible to contamination. The map generally shows that the aquifer overburden protection capacity in the vicinity of VES 08, 09, 10, 18 and 19 is rated poor (0.03 - 0.09 mhos), while in the vicinity of VES 01, 02, 04, 06, 07, 11 and 13 is rated weak (0.12 - 0.22 mhos). It implies therefore that the aquifer in these locations are vulnerable to contamination from infiltration of leachate from decomposed refuse dumps and/or if there is leakage of buried underground storage facility. The aquifer overburden protection capacity rating in the vicinity of VES 03, 05, 12, 14, 15, and 17 is good (0.54 - 0.93, implying that the aquifer in these locations are not vulnerable to pollution through infiltration of leachate.
5. Conclusion
The results of this study have led to the precise delineation of the subsurface geological structure, groundwater quality variations and aquifer properties such as transmissivity and aquifer vulnerability in the study area. Four geoelectric layers were identified viz a top soil, a wet clay layer, and a fine-medium-coarse sand layer identified as the aquiferous horizon. The fourth layer was not resolved due to the spread length. Depth to the aquifer ranges from 4.5m in the vicinity of VES 05 to 27.0 m at the vicinity of VES 15. Sounding curve types obtained in the area are mostly “HA” but fresh water lenses with low concentration of conducting minerals such as iron were obtained only in locations that exhibit “KH” curve types. However, hydrochemical analysis of water samples from boreholes from the different curve types would be required to ascertain the degree of variation in water quality. High transmissivity values were recorded over most parts of the study area which agrees with the geology of the Benin Formation (Coastal Plain sands) consisting of fine-medium-coarse sands. Aquifer overburden protection capacity in the vicinity of VES 01, 02, 04, 06, 07, 08, 09, 10, 11, 13, 18 and 19 are rated poor to weak, the aquifer in these areas are vulnerable and hence susceptible to pollution through infiltration of leachate from decomposed refuse dumps and/or leakage from buried storage facilities. Other locations are rated moderate to good overburden protective capacity.
6. Acknowledgements
The authors are grateful to the final year students of the department of Geology & Physics for assisting in the field work. The cooperation of the Elders and Chiefs of the various communities deserve special appreciation. We are grateful to Mr Bright Sydney for producing the map of the study area.
REFERENCES
- G. V. Keller and F. C. Frischnechk, “Electrical Methods in Geophysical Prospecting,” Pergamon Press, Oxford, 1966, pp. 91-135.
- A. A. A. Zohdy, G. P. Eaton and D. R. Mabey, “Application of Surface Geophysics to Groundwater Investigations,” In: G. V. Keller and F. C. Frischnechk, Eds., Techniques of Water Resources Investigations of the United States Geological Survey, United States Government Printing Office, Washington DC, 1974, pp. 12-26.
- P. Sikander, A. Bakhsh, M. Arshad and T. Rana, “The Use of Vertical Electric Sounding Resistivity Method for the Location of Low Salinity Groundwater for Irrigation in Chaj and Rana Doabs,” Environmental Earth Sciences, Vol. 60, No. 5, 2010, pp. 1113-1129. doi:10.1007/s12665-009-0255-6
- L. C. Amajor and C. O. Ofoegbu, “Determination of Polluted Aquifers by Stratigraphically Controlled Biochemical Mapping: Example from the Eastern Niger Delta, Nigeria,” In: C. O. Ofoegbu, Ed., Groundwater and Mineral Resources of Nigeria, F. Vieweg, Braunschweig/Wiesbaden, 1988, pp. 62-73.
- J. R. L. Allen, “Late Quaternary Niger Delta and Adjacent Areas: Sedimentary Environments and Lithofacies,” American Association of Petroleum Geologists Bulletin, Vol. 49, No. 5, 1965, pp. 549-600.
- K. Short and A. J. Stauble, “Outline of Geology of Niger Delta,” American Association of Petroleum Geologists, Vol. 51, No. 5, 1965, pp. 761-779.
- J. O. Etu-Efeotor and E. G. Akpokoje, “Aquifer Systems of the Niger Delta,” Journal of Mining and Geology, Vol. 26, No. 2, 1990, pp. 279-284.
- R. Mailet, “The Fundamental Equations of Electrical Prospecting,” Geophysics, Vol. 12, No. 4, 1974, pp. 529- 556. doi:10.1016/0022-1694(85)90050-2
- J. P. Henriet, “Direct Applications of Dar Zarrouk Parameters in Groundwater Surveys,” Geophysical Prospecting, Vol. 24, No. 2, 1976, pp. 344-353. doi:10.1111/j.1365-2478.1976.tb00931.x
- W. Kelly, “Geoelectric Sounding for Estimating Aquifer Hydraulic Conductivity,” Ground Water, Vol. 15, No. 6, 1977, pp. 420-424. doi:10.1111/j.1745-6584.1977.tb03189.x
- S. H. Ward, “Resistivity and Induced Polarization Methods,” In: S. H. Ward, Ed., Geotechnical and Environmental Geophysics, Society of Exploration Geophysics, Houston, 1990, pp. 147-189. doi:10.1190/1.9781560802785
- K. M. Onuoha and F. C. C. Mbazi, “Aquifer Transmissvity from Electrical Sounding Data: The Case of the Ajali Sandstone Aquifers South-West Enugu, Nigeria,” In: C. O. Ofoegbu, Ed., Groundwater and Mineral Resources of Nigeria, F. Vieweg, Braunschweig/Wiesbaden, 1988, pp. 17-30.
- E. W. Mbipom and J. E. Archibong, “Vertical Electric Sounding of Coastal Aquifers near Qua-Iboe Estuary,” Nigerian Journal of Mining and Geology, Vol. 25, No. 2, 1989, pp. 151-154.
- K. A. Mogaji, K. A. N. Adiat and M. I. Oladapo, “Geoelectric Investigation of the Dape Phase III Housing Estate FCT Abuja, North Central Nigeria,” Online Journal of Earth Sciences, Vol. 1, No. 2, 2007, pp. 76-84.
NOTES
*Corresponding author.