Journal of Water Resource and Protection
Vol. 3 No. 8 (2011) , Article ID: 6992 , 13 pages DOI:10.4236/jwarp.2011.38070
Relationship between Climate and Groundwater Recharge in the Besseke Watershed (Douala-Cameroon)
1Department of Earth Sciences, University of Yaounde I, Yaounde, Cameroon
2Department of Earth Sciences, University of Ngaoundere, Ngaoundere, Cameroon
E-mail: rfeumba2002@yahoo.fr
Received May 29, 2011; revised July 2, 2011; accepted August 4, 2011
Keywords: Cameroon (Douala, Besseke), Climate Variability, Impact, Water Balance, Recharge
ABSTRACT
In Douala, economic capital of Cameroon, annual rainfall and temperature from its meteorological station (latitude: 4˚00'N; longitude: 9˚43'E; elevation: 5.0 m) were obtained and analysed to investigate the impact of climate variability on groundwater recharge. The climate shows a strong evidence of changes towards persistent weather conditions. The region is mainly characterized by a mean inter-annual temperature of 27.4 ˚C and influenced by the mount Cameroon (4095 m in elevation). A recent decrease in mean annual rainfall occurred since 1982. The average annual rainfall which was 4200 mm with about 220 days of rainfall from 1917 to 1937 has moved to 4049 mm for the period 1937-1957, to 3826 mm for the period 1968-1988 and to 3619 mm for the period 1971-2001. Between, 1997 and 2007, the total number of days of rainfall has not exceeded 220 (193 days of rainfall in 1998 and 216 days of rainfall in 1999). By using Gauss law on 31 years (1971-2001) of annual rainfall, one note that the value 2850 mm has 20% of luck to be not observed and the value 4219 mm has 20% of luck to be exceeded. Douala already suffers from water shortage not because of decrease of rainfall but due to quality of underground water and salty taste of the main river catched for water supply. Moreover, precipitation is considered as the main replenishment source of all water resources in the study area (watershed of Besseke). The calculated interannual groundwater recharge rate (potential recharge, not necessarily real) is about 9% compared to the interannual total precipitation received by this area located closer the Atlantic Ocean (Gulf of Guinea). Groundwater discharge from the aquifer occurs between November and March.
1. Introduction
Some studies have confirmed the global warming of the planet induced by the emission of greenhouse gases and whose consequences are expected: changes in the intensity and direction of winds and ocean currents, the acceleration rising sea levels, increased flooding in low lying areas, desert encroachment and scarcity of rainfall where the drying up of lakes, rivers and the lowering of groundwater levels [1-5]. Because of its impact on the environment, issues of climate variability and their implications on water resources are placed for some time a central concern of scientists and policy makers in the world [6].
In cities of developing countries like those of Douala and Yaounde, nearly 60% of resident populations make use of groundwater through wells and springs. This water resource vulnerable to anthropogenic pollution and highly sought by these people is drained by rainfalls which vary not only throughout the year but also fluctuate from year to year.
In order to evaluate the characteristics of the meteorological and hydrological drought and to study the effects of interannual variation of rainfall on groundwater recharge, this research is based on the study of hydrological and rainfall data observed in the watershed of Besseke located about 7 km from the meteorological station of the airport in Douala and in the heart of the industrial zone of Bonaberi-Douala.
2. Characteristics of Besseke Watershed
The Besseke Watershed (Figure 1) is one of 11 basins
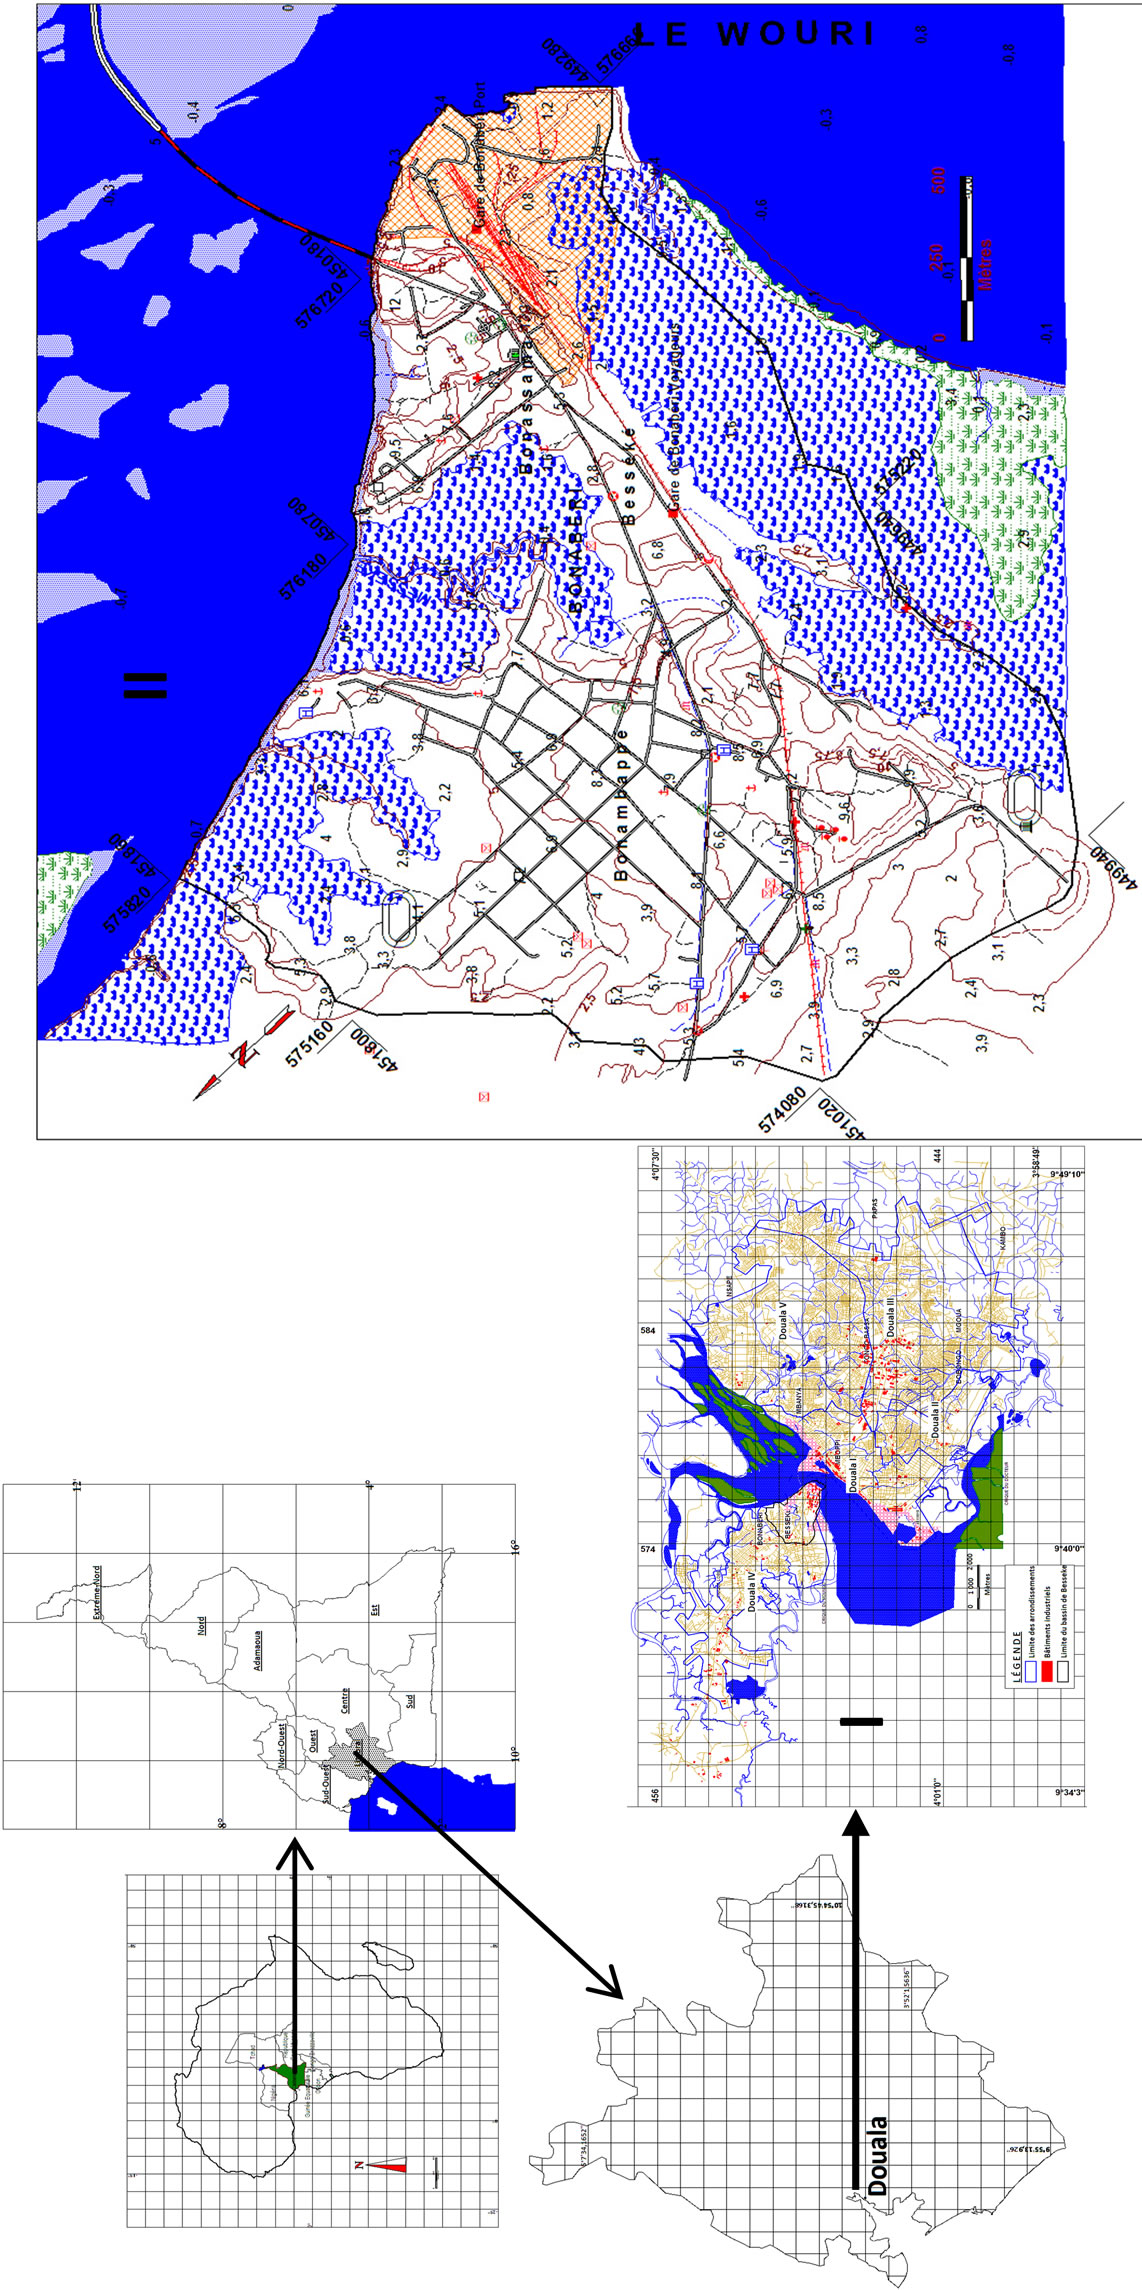
Figure 1. Geographic location of the Besseke sub-basin (II) in the Douala basin (I).
that make up the city of Douala is located on the right side of the river Wouri (NW) between 449,500 m and 452,000 m N and 574,000 m and 577,000 m East longitude in UTM coordinates. This basin is named like that because of the river Besseke that flows (W → E) in a very sinuous in a large valley that stretches from the area behind the hospital Bonambappe St. Thomas (2.1 m) across neighborhoods Bonaberi, and Bonassama Besseke to the river Wouri, east sector of the basin (0 m), the rest is presenting as a plain crossed by the very gently sloping bowls (3.5%).
The drainage basin of Besseke has an area of 436.6 hectares, a perimeter of 9.197 km and a Gravelus index of 1.237 [7]. By its geographical position, it is subjected to an equatorial climate of Guinea type influenced by the deviation of the monsoon due to Mount Cameroon Mountain, located 60 km west and culminating at 4070 m [8] with two distinct seasons [9]. Rainfalls in the watershed of Besseke show a temporal distribution, which can be demonstrated using data collected at Douala Airport station. Annual rainfall varies considerably from 2595.9 mm to 4597.0 mm and varies in time and space. Temperatures are also variable with an average minimum of around 26.1˚C and an average maximum of 28.3˚C.
Based on reference [10], the city of Douala is based on the sedimentary basin called “sedimentary basin of Douala” separated from the Rio del Rey by horst axis volcanic of Mount Cameroon-Bioko and is the largest coastal sedimentary basin of Cameroon, with an area of about 7000 km2 and is located along the Gulf of Guinea between 3˚00' and 4˚30' North latitude and between 9˚20' and 10˚20' East longitude. In this coastal basin, deposits are divided into coastal sand, vases black mangrove and river alluvium accumulated a great thickness in continuity with the Pliocene deposits at present. Continental and marine sediments are based on the metamorphic basement consists of gneisses, migmatites, micaschistes and lowered from 3000 to 4000 m. The lithology is as follows, from top to bottom:
Quaternary Sediments: they represent the Wouri’s unit which is dating since Plio-Pleistocene [11]. This unit consists of three levels: a coarse, gravelly level and a level sandy clay matrix more or less kaolinite. It is an azoic formation which is based uncomfortably on all previous units;
Tertiary Sediments: they are represented by the formations of Nkapa, Souellaba and Matanda;
Secondary Sediments: here we find the formation of Logbaba and Mundeck.
The sedimentary basin of Douala has two aquifer systems of unequal size which are divided into four aquifers. It differs from the bottom up the deep system (basal sandstones and Paleocene sands) and the superficial system (Mio-Pliocene formations and Quaternary alluvium), Figure 2.
In the Watershed of Besseke, hydrogeological formations (Figure 3) are represented by sandy-clayey levels, positive and graded gravelly to sandy gravelly clay.
3. Data and Methods
This research is based on the use of climatic data (rainfalls, temperature) on a long series of observation (from 1971 to 2001 and from 1998 to 2007) of the Douala Airport station. These data were obtained to the Center of Meteorology of Douala (Ministry of Transport). Temperature data are covering only the years 1998-2007.
The method of weighted moving averages or low-pass filter Hanning of order 2 was used to screen the seasonal variations by calculating the weighted total rainfall [12]. To better visualize the deficit years of surplus rainfall years, moving averages were centered and reduced. The diagram of Franquin was used to distinguish the dry months of the wet months of the city of Douala [13]. This diagram defines the dry months as those with the curve of potential evapotranspiration (ETP) in mm are lower than average rainfall in mm (Figure 4).
Statistical analysis following the normal or Gaussian was used to assess the frequency, probability of occurrence of spatio-temporal variations in rainfall. The objective of this analysis was to 1) verify whether or not rainfall variations persist in the decay over time and 2) whether these variations are significant and rainfall affect the recharge/discharge of the aquifer. The scope (maximum value minus minimum value) used in the normal distribution was used to highlight the ten classes. The graphs were plotted using the Excel software.
3.1. Water Balance
3.1.1. Evapotranspiration
During studies on plant growth, Thornthwaite, climatologist and botanist American, noted that the water exchange between the plant and the atmosphere conditioned to a large extent the growth of plant tissue [14]. Potential evapotranspiration is an optimal water supply plant.
For the calculation of potential evapotranspiration, we can use the Thornthwaite method, the water balance of a watershed is a calculation method that allows assessment of the relationship between inputs and outputs of water, over a period of time, which corresponds to a complete hydrological year [15]. It is used to check the consistency of all data collected and calculated: measurement of precipitation, evapotranspiration calculation, measurement of the mean flow.
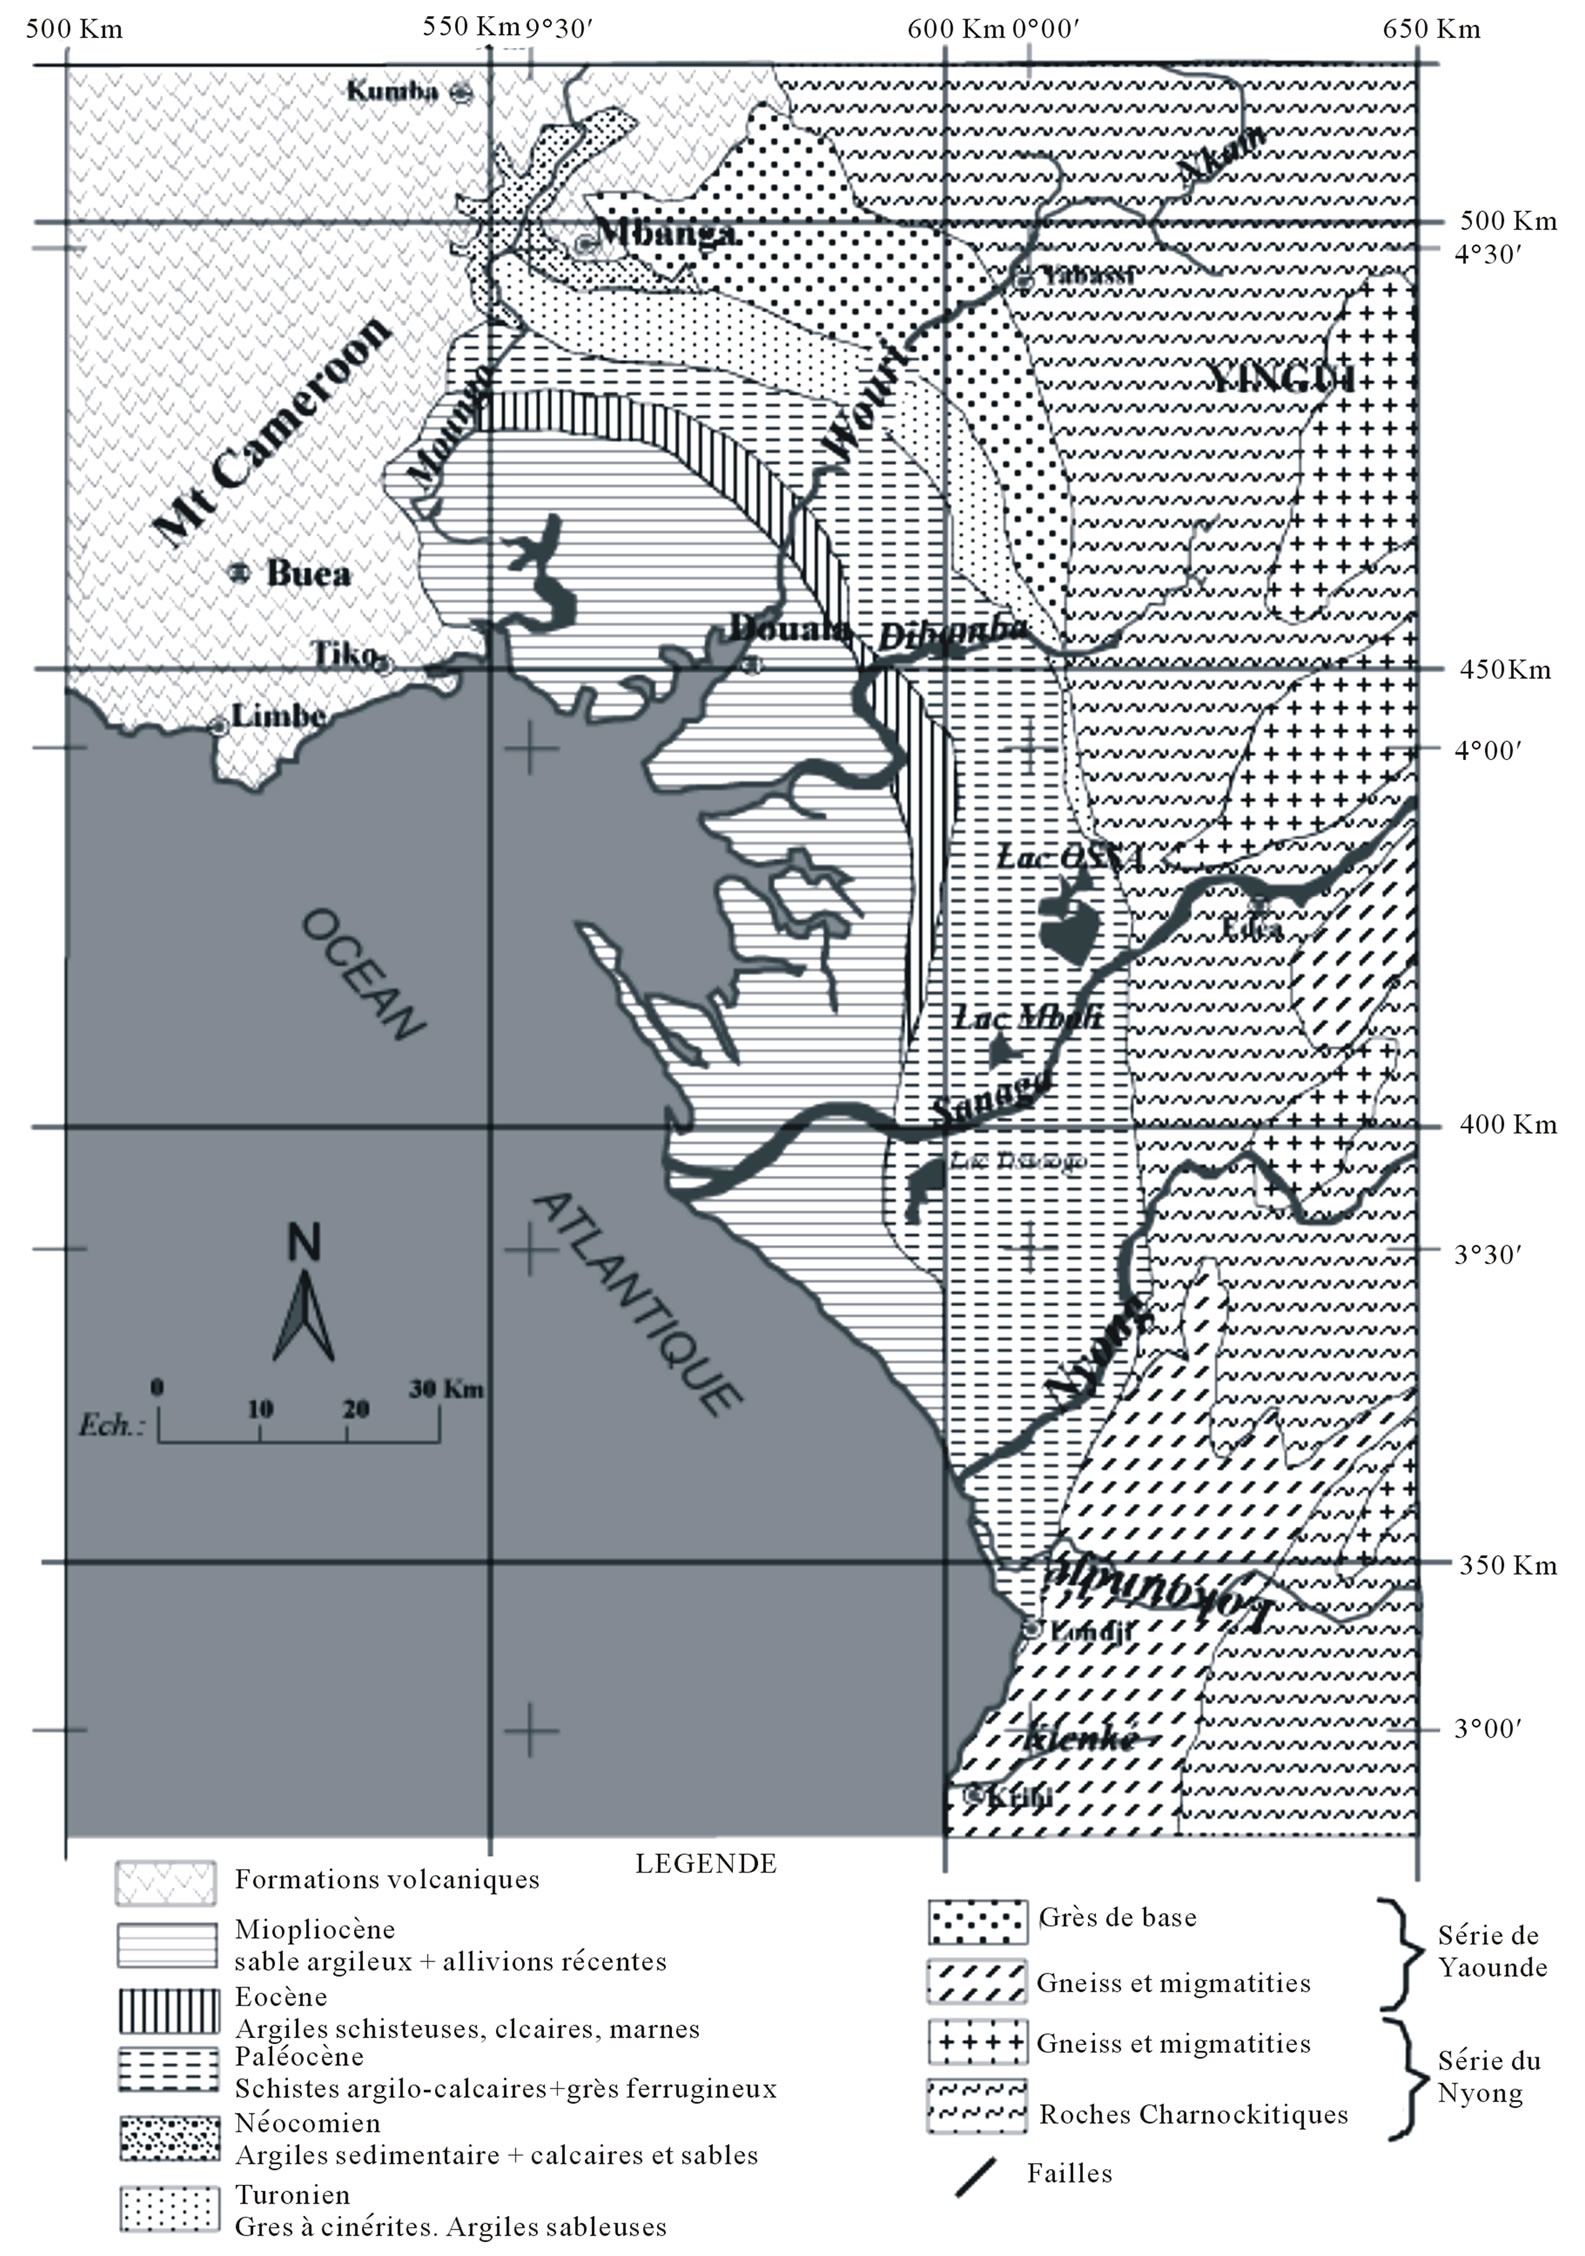
Figure 2. Geological map of the Douala basin (Njiké Ngaha, 1984, modified).
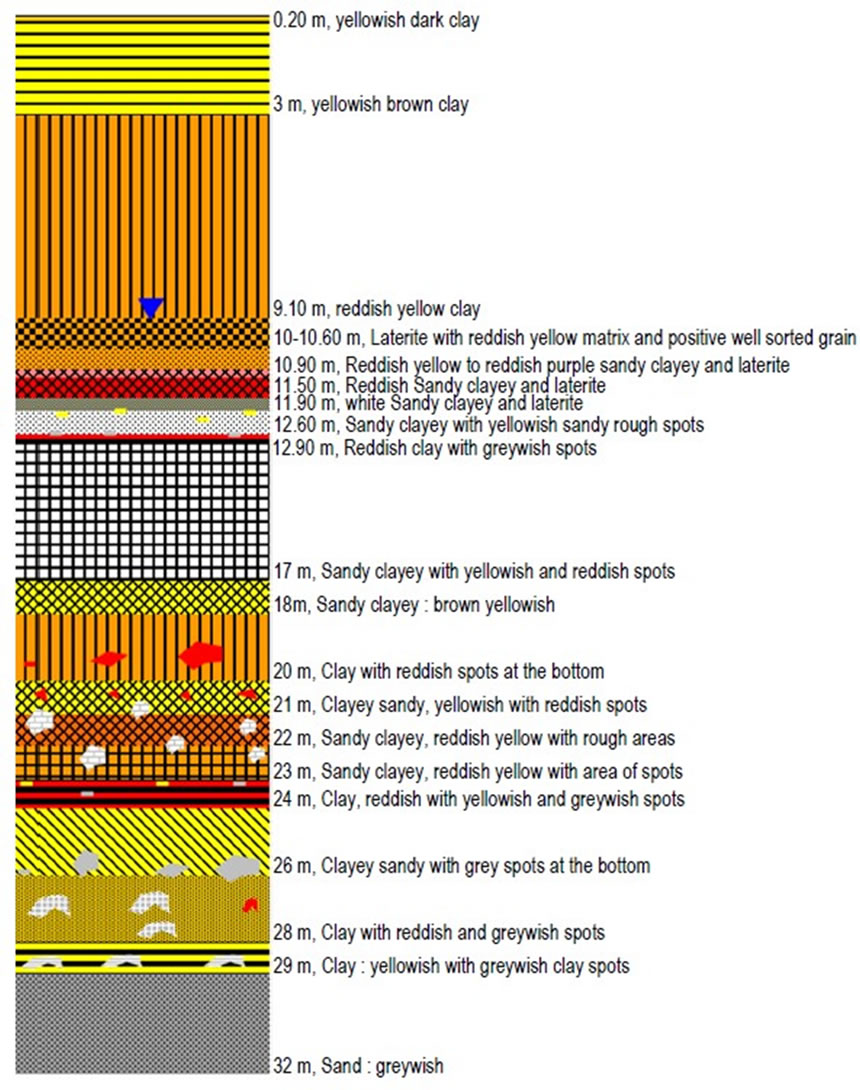
Figure 3. Hydrogeological terrains in the Besseke basin (Douala)
3.1.2. Equation of Parameters of Water Balance
The assessment evaluates the inputs and outputs of water over a specified period. The assessment of water balance is necessary for the physical parameters of the environment such as weather elements, soil involved in the water cycle. The calculation of this balance is necessary for knowledge of the geographical environment, to better define the overall requirements and targets mainly the middle and for assessing the volume of groundwater resources (infiltration) and surface (runoff). The water balance of a watershed can lead to the following equation:

With P: Average rainfalls in the basin in mm.
The term evapotranspiration is the amount of water vapor released into the atmosphere both by direct evaporation in the soil itself by sweating aerial organs of plants. The study of evapotranspiration demands are defined as two essential concepts: actual evapotranspiration (ETR) and potential evapotranspiration (ETP). The latter appeared particularly with the work of Thornthwaite and is defined as representing the amount of water available in the form of soil moisture, enough so that plants can maintain their transpiration rate to a maximum level. ETR: actual evapotranspiration in mm. Actual evapotranspiration is the amount of water actually evaporated transpired over the study area. The ETR depends on the rainfalls stored in soil and total rainfall. R: Runoff in mm ΔRFU: Variation of water in soil easy to use, that is to say the layer of water stored in soil, plants can use. The RFU begins feeding the ETR when rainfall becomes less than ETP.
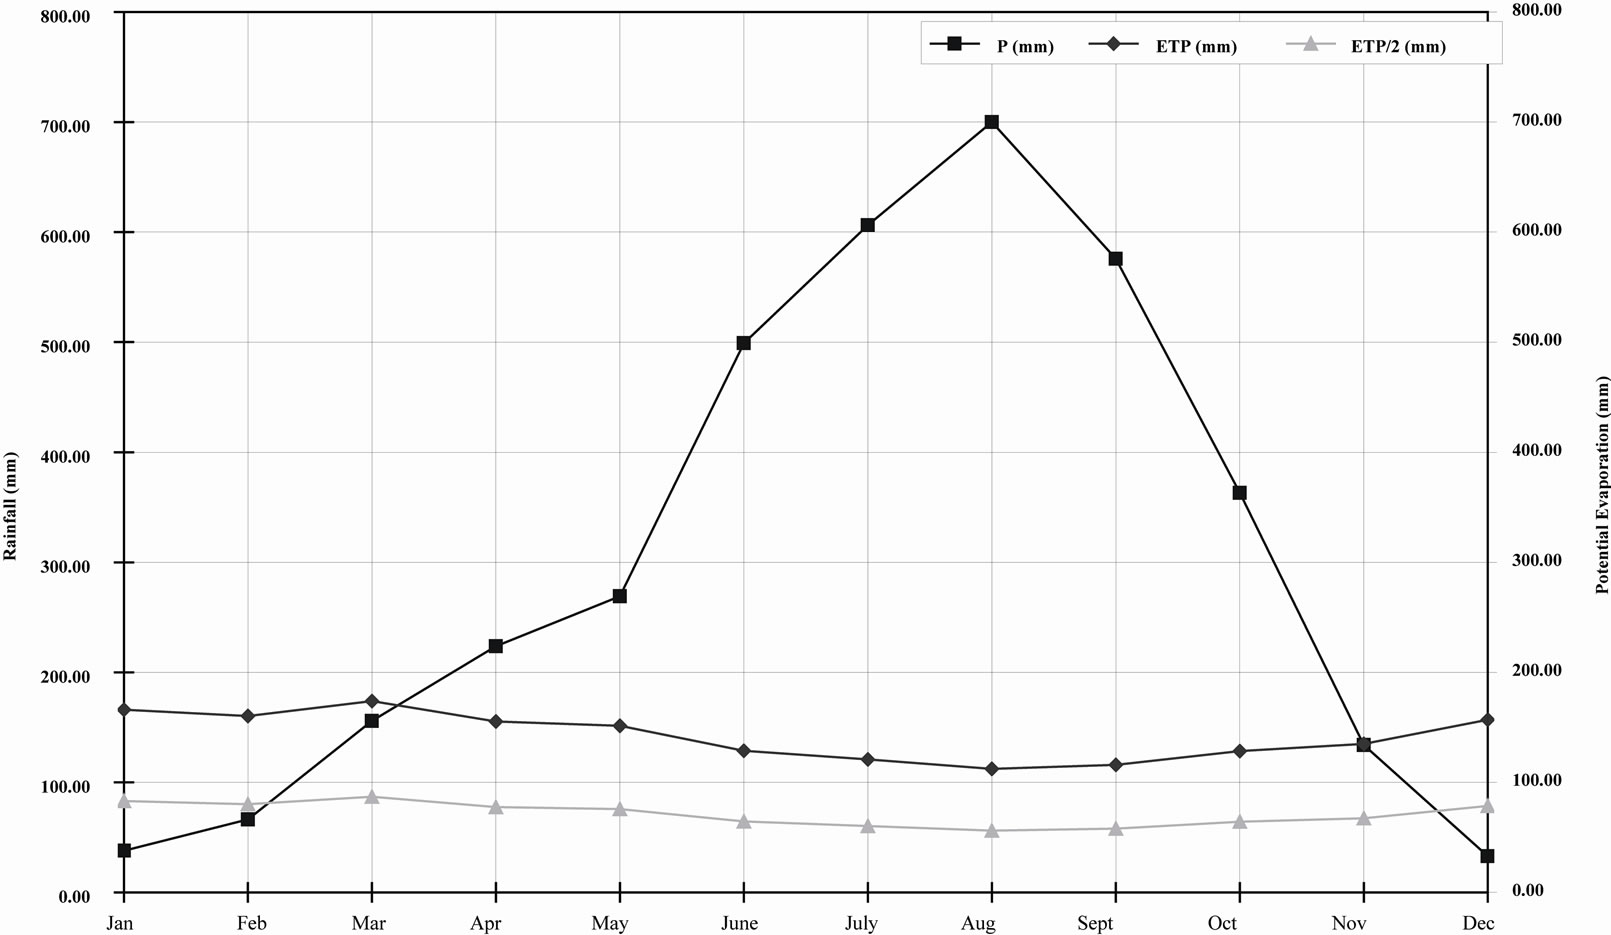
Figure 4. Franquin diagram of the Besseke basin (Douala) from 1998 to 2007.
The excess (EXC), positive difference, by definition, between precipitation and actual evapotranspiration, is the excess rainfall that can infiltrate or run off, the excess is treated as effective rainfall, this concept differs from one author to another. In hydrogeology effective rainfall (Pe) is sometimes confused with infiltration. In Hydrology, an effective rainfall (Pe) is the part that feeds the rivers. The excess (EXC) is the amount of rainfall runoff and infiltration, EXC = I + R.
3.2. Method of Calculation
The necessary data are represented by the gross rainfall, temperatures, relative humidity of the atmosphere, duration of sunshine and the states of filling the tank in question. The non-fitting of weather stations used for determining certain parameters, requires us to use the Thornthwaite method based on data obtained and has in the past provided good results in a climate like ours. The water balance is calculated from monthly values: mean monthly temperature (average maximum and minimum temperatures for each day of the month at the Douala airport station, monthly rainfall, and monthly potential evapotranspiration. Cycle’s vertical feed deficit or surplus will be identified and correlated with changes in the potentiometric surface (water table) collected in 2010.
The measurement of geographic coordinates (longitude, latitude, and elevation) was carried out works with a Garmin GPS model type 12X and that of water table using a probe sound of 115 wells monitored between January and December 2010. Water table was measured once a month. The data collected helped to realize the piezometric map of the watershed of Besseke (Figure 5).
Besides data and hydro hydrodynamic soil sampling
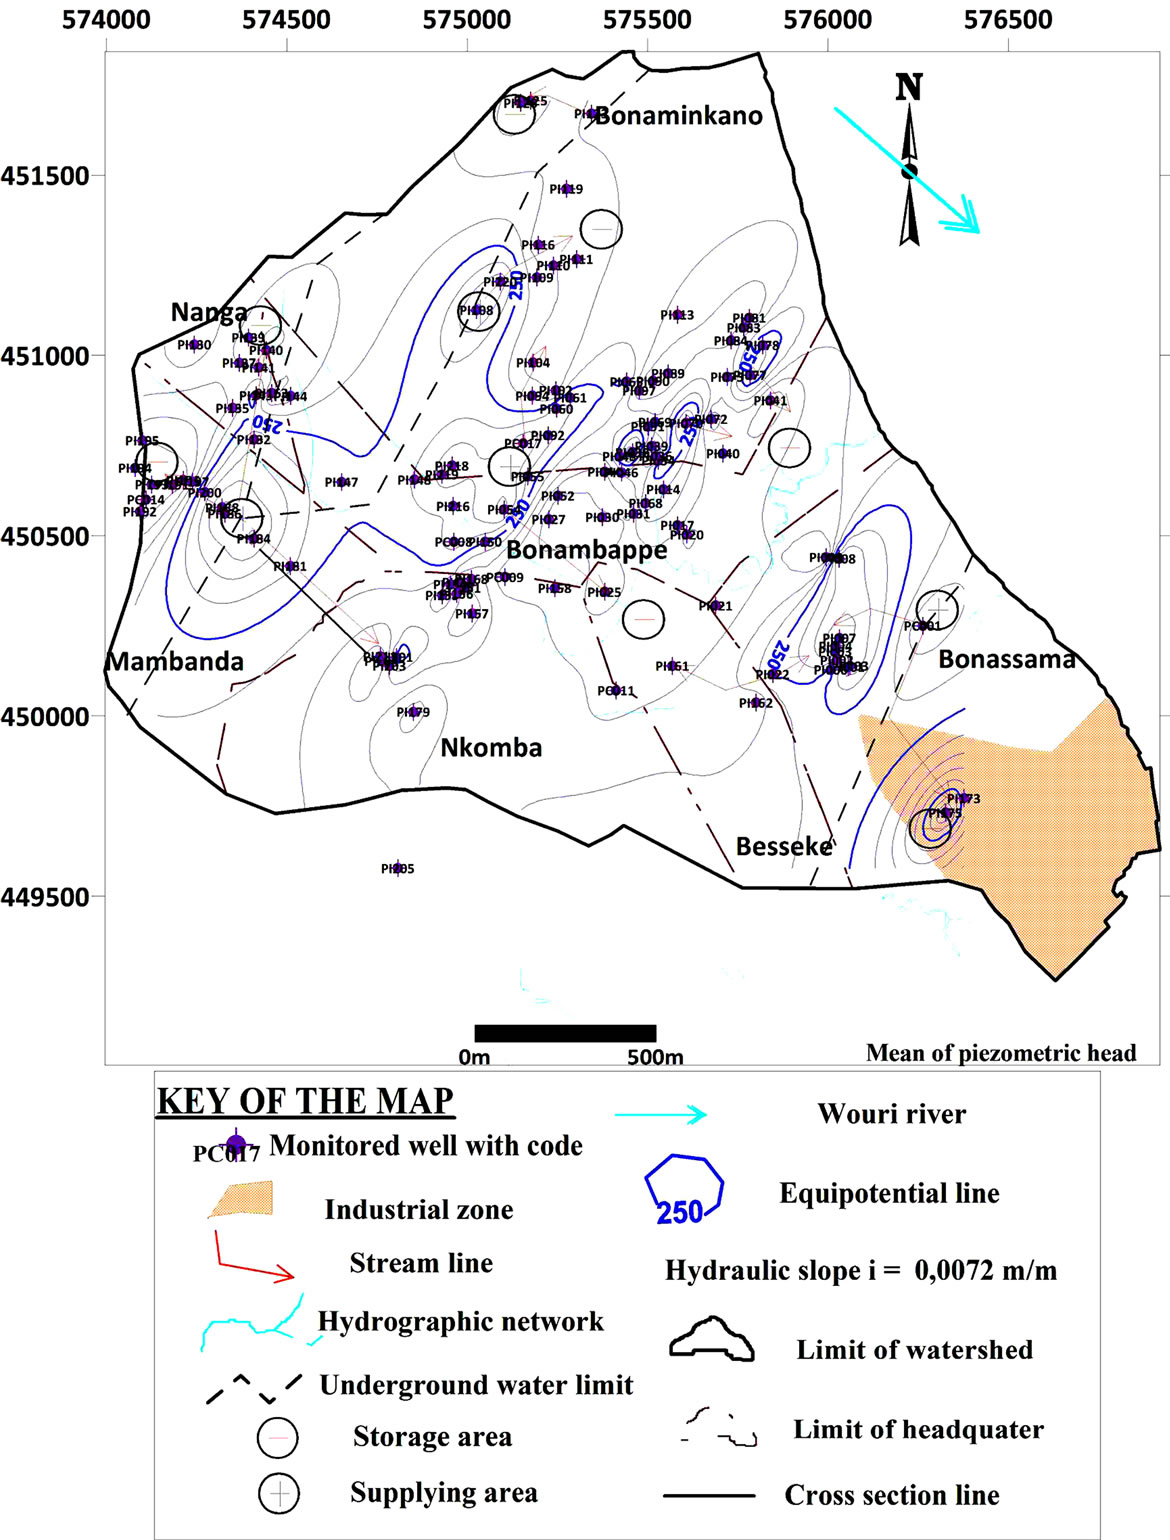
Figure 5. Piezometric map of the water table in the Besseke basin (year 2010).
was conducted between 50 and 100 cm at two points in the watershed in order to have information on waterholding capacity of soils. The values of hydraulic conductivities were determined by the method of Hazen and grading process by sedimentometry at the Geotechnical Laboratory of the National Advanced School of Engineering of Yaounde.
3.3. Results and Discussion
3.3.1. Rainfall and Temperature
The climatic trend of a given region can be known through the series of annual rainfall amounts, especially when they are long enough [16]. The rainfall in the city of Douala in general and watershed of Besseke in particular is unimodal and varies over time and space. The rainfalls vary considerably and still tend to fall by 1982 (3573.3 mm) to 2000 (3552.0 mm) with peaks observed in 1986 (4120.1 mm) and 1994 (4121.4 mm). However, these values did not recover those observed between 1971 (4597.0 mm) and 1981 (4565.7 mm). The lowest values being recorded in 1984 (2595.9 mm) and 1998 (2860.6 mm) (Figure 6), which is confirmed by the evolution curve rainy mobile computed (Figure 7).
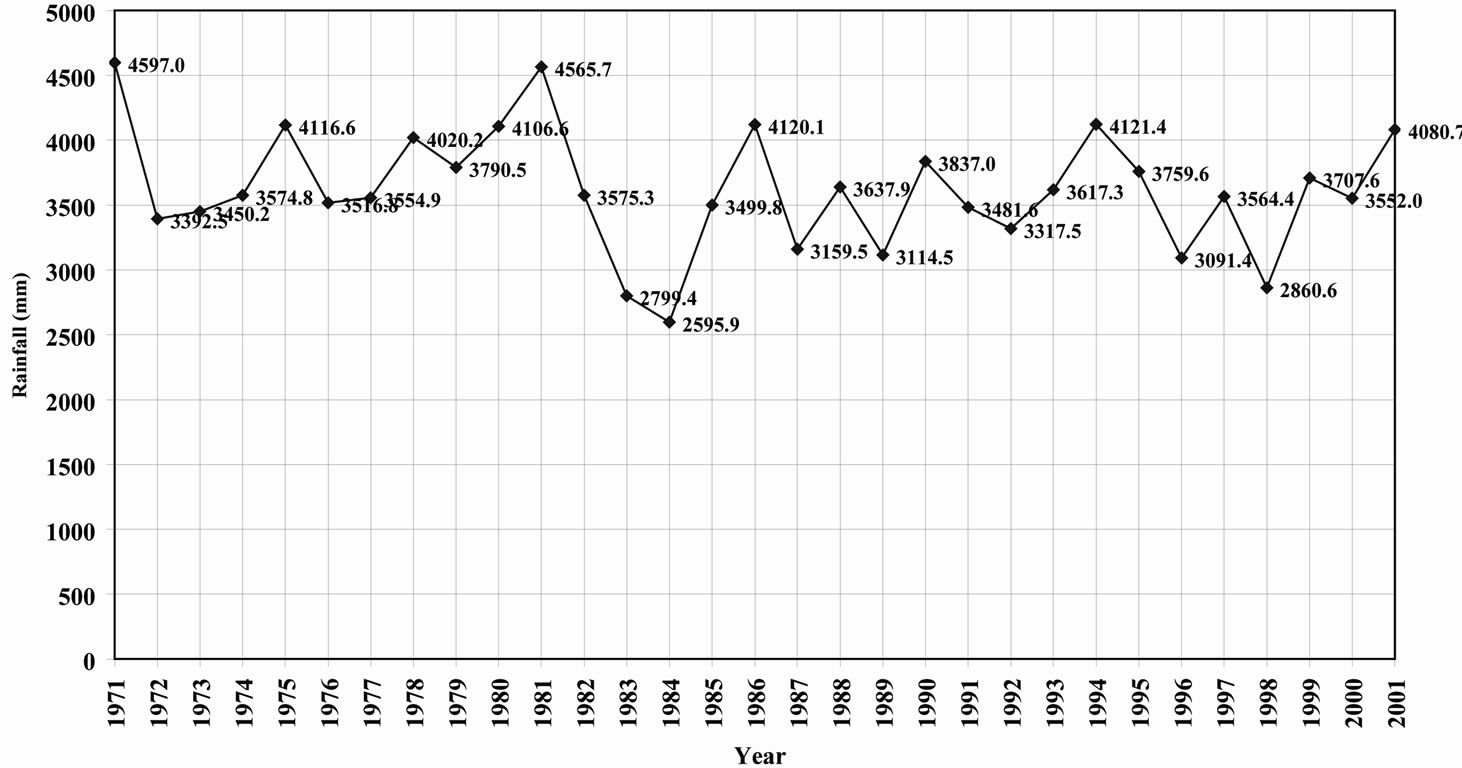
Figure 6. Curve of the annual rainfall trend in the Besseke basin (Douala) from 1971 to 2001.
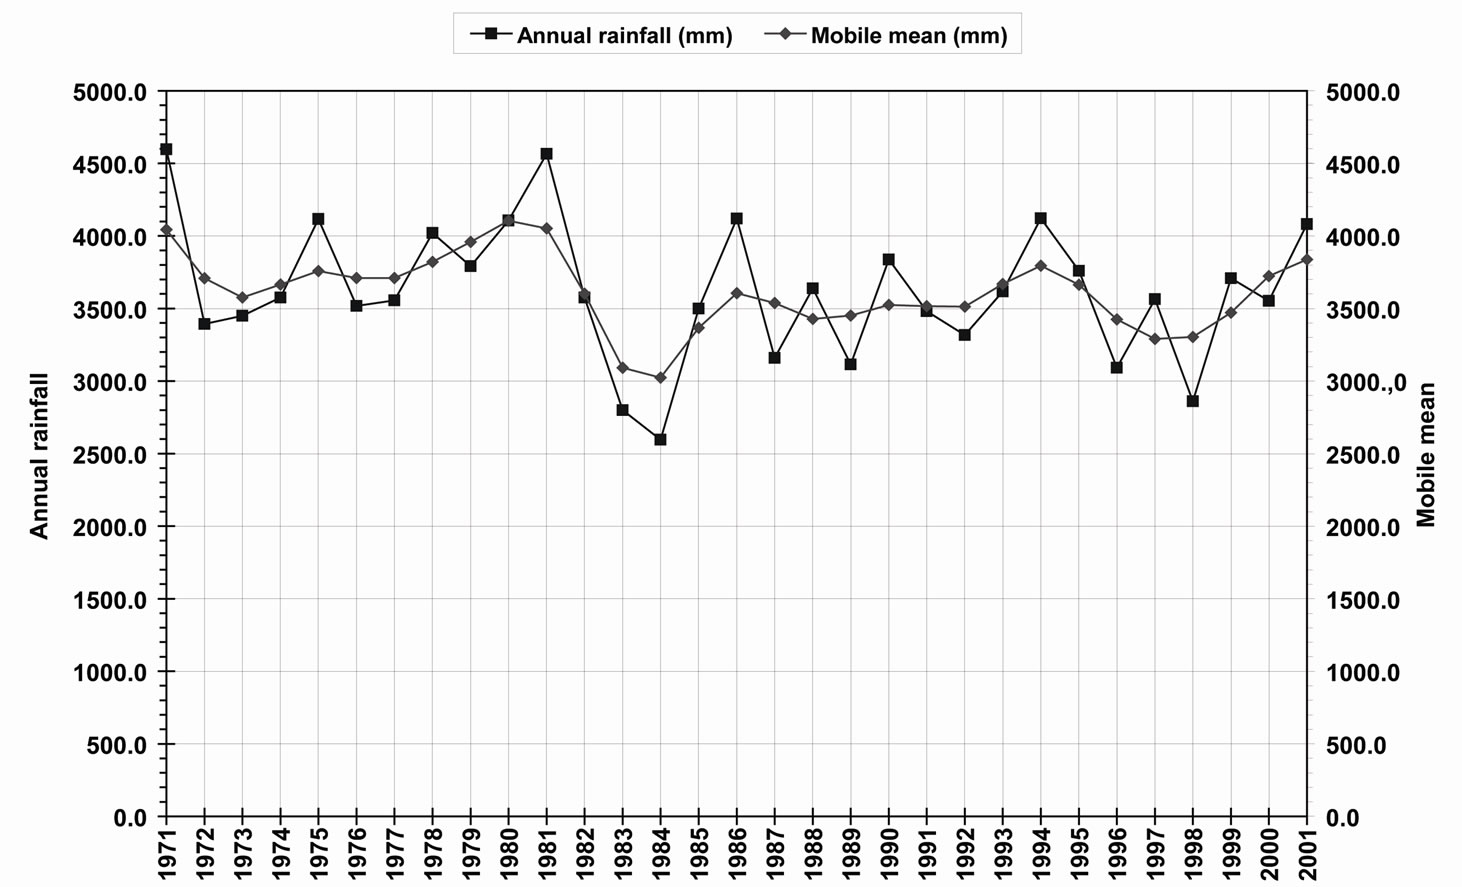
Figure 7. Curve of the annual rainfall anomaly trend in the Besseke basin (Douala) from 1971 to 2001.
The Identification of a break climate in West Africa and Central America in the early 1970s has been the subject of numerous studies [17-20]. These studies conclude to a significant decline in general heights annual rainfall but with a sufficiently clear to make heterogeneity of this phenomenon one of its main characteristics [21].
The use of the low-pass filter Hanning highlights two trends in climate or hydrological period (Figure 8): dry periods alternating with wet periods with a tendency towards dry seasons. Wet periods ranging from 1971 to 1981 with past wetlands between 1993 and 1995 and between 2000 and 2001. However, there is a dry period observed in 1973. The others are all dry periods (1982 to 1992 and from 1996 to 1999). According to reference [22], on the scale of the African continent, there is a relative contrast between wet period 1931-1960 and the 1968-1997 period covering the stage of drought that began in the late 1960s. The difference between the averages of these two periods reaches 20% - 40% in the West African Sahel and is generally of the order of 5% - 10% elsewhere [21].
The frequency of occurrence of rainfalls highest belongs to the class [from 3396.3 to 3596.4] and lowest in the class [from 4196.7 to 4396.8]. This means that it is quite possible that one reaches more annual rainfall of 4200 mm as observed between 1917 and 1937 (Figure 9).
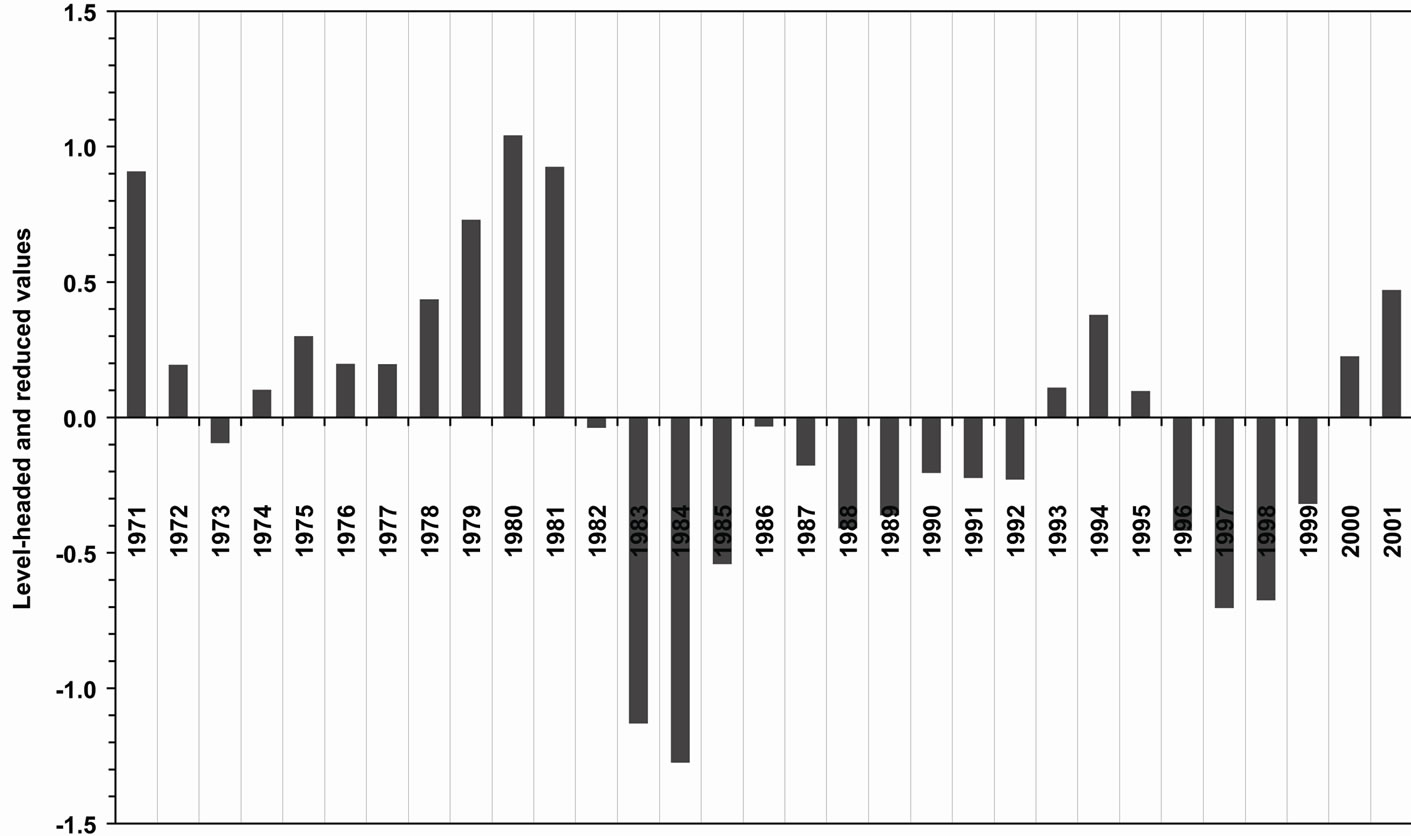
Figure 8. Interannual variation of rainfall in the Besseke basin (Douala).
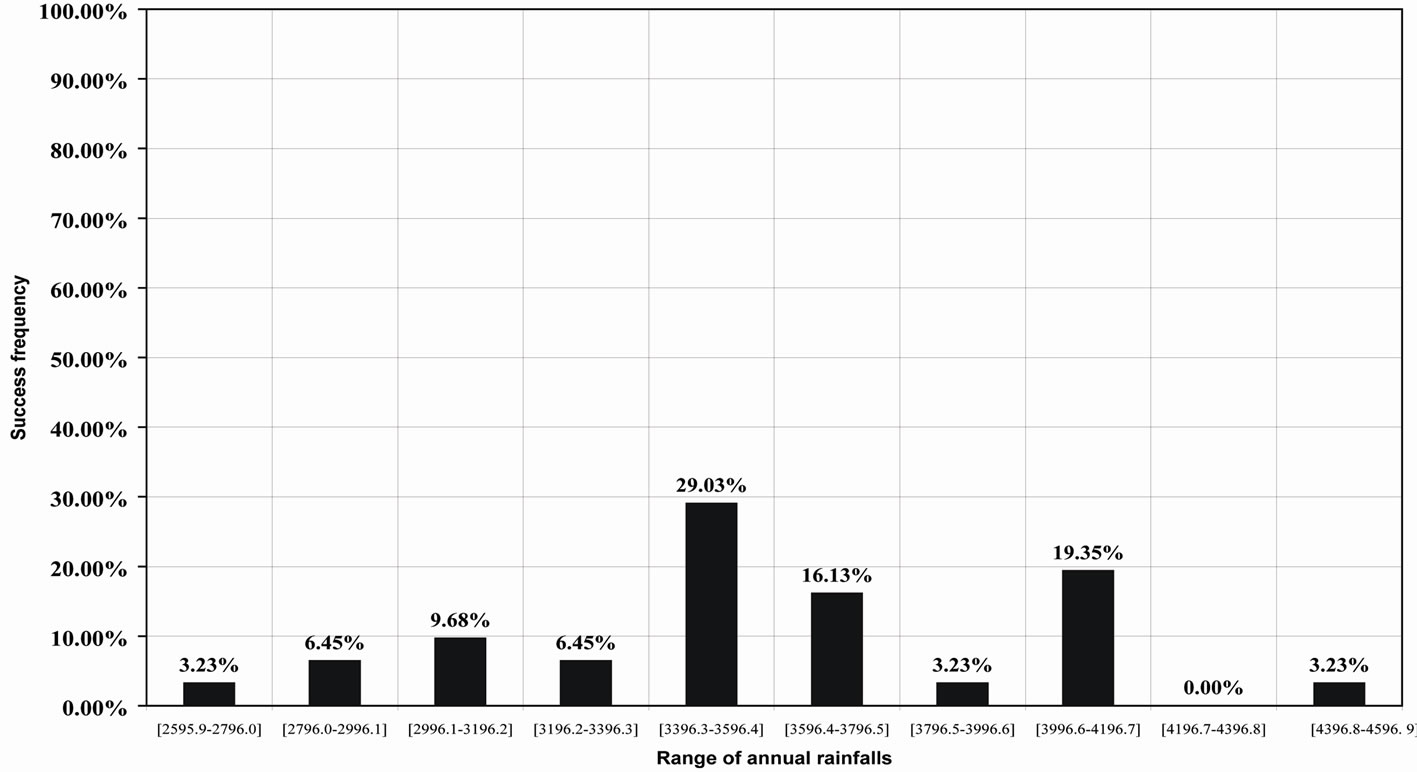
Figure 9. Annual frequency of occurrence of rains per class in the Besseke basin (Douala).
In addition, there is 80% of success that the total annual rainfall of 3168.8 mm is passed and 80% of success that 3864.4 mm is not exceeded after a period of 5 years. After a period of 10 years, there is 90% of success that 2986.7 mm is not exceeded and 90% of success that either exceeded 4046.5 mm. After 20 years, there is 93% of success that 2837.6 mm is not reached and 93% of success that 4195.6 is reached.
The module of 31 years of rainfall is 3618.7 mm for a standard deviation of 468.6 mm. The statistical analysis of the normal rainfall data over 31 years indicates that the Douala region has the following characteristics:
• Decennial dry year is 3018.9 mm;
• Twenty-year dry year is 2850.2 mm;
• Five-year dry year is 3225.3 mm;
• Ten wet year is 4218.5 mm;
• Five-year wet year is 4012.3 mm;
• Twenty-year wet year is 4387.2 mm.
All these probabilities show water stress of the city of Douala (Figures 10(a) and (b)). However, the variability of rainfall in the region of Douala is low amplitude, these results from its geographical position which gives him a strong influence of the Inter Tropical Front (ITF) and the proximity to the Atlantic Ocean. At the current pace deforestation in the Congo Basin, it is likely that this balance is broken, even as deforestation is not the main cause of drought [23].
As well as rainfall, temperature varies space-time with
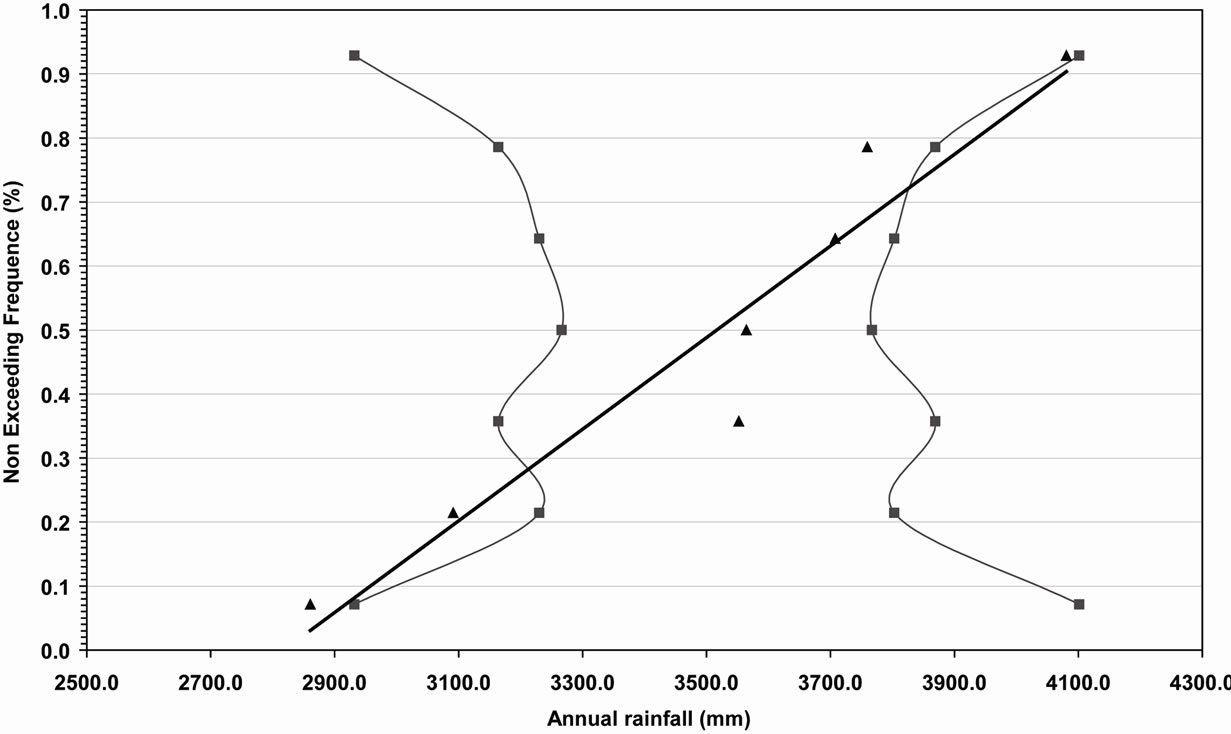 (a)
(a)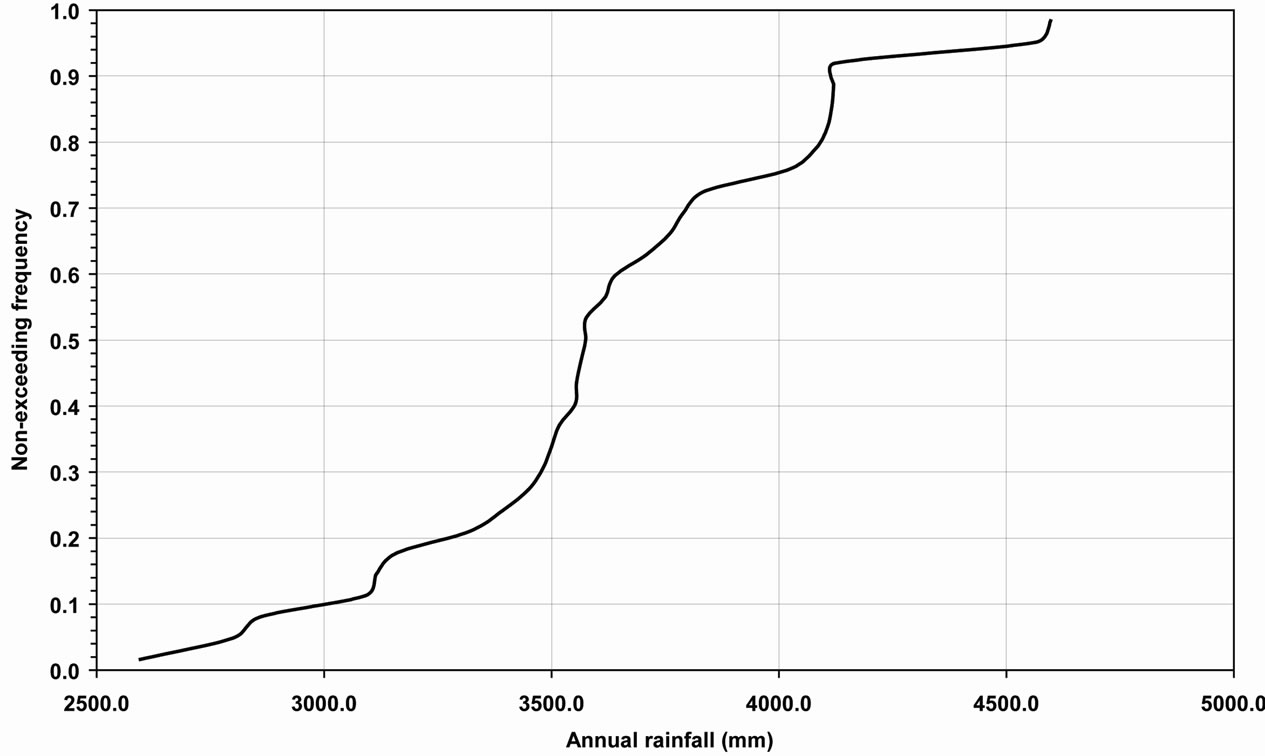 (b)
(b)
Figure 10. (a) Fitted line of the last six years in the Besseke basin (Douala). (b). Distribution function of the annual rainfall in the Besseke basin (Douala).
a maximum of 28.3˚C and minimum 26.7˚C or high thermal amplitude of 1.6˚C between 1998 and 2007. One notes, however, an almost constant temperature between 1999 and 2004 and a fluctuation of the later since 2005 (Figure 11).
From the hydrological, all results obtained at the Douala airport weather station are shown in Table 1 and Figure 12.
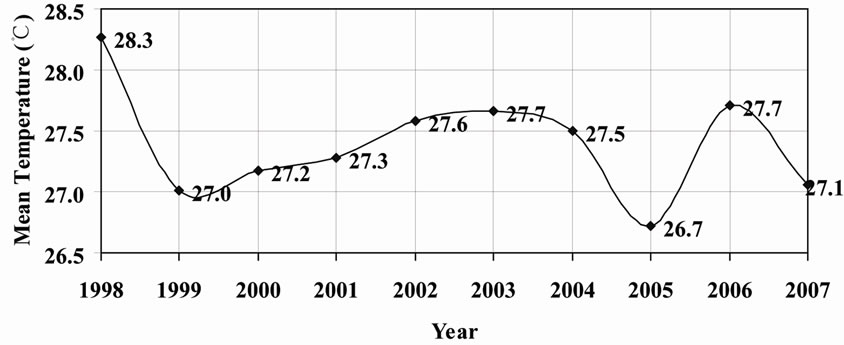
Figure 11. Curves of the mean annual temperature trend in the Besseke basin (Douala).
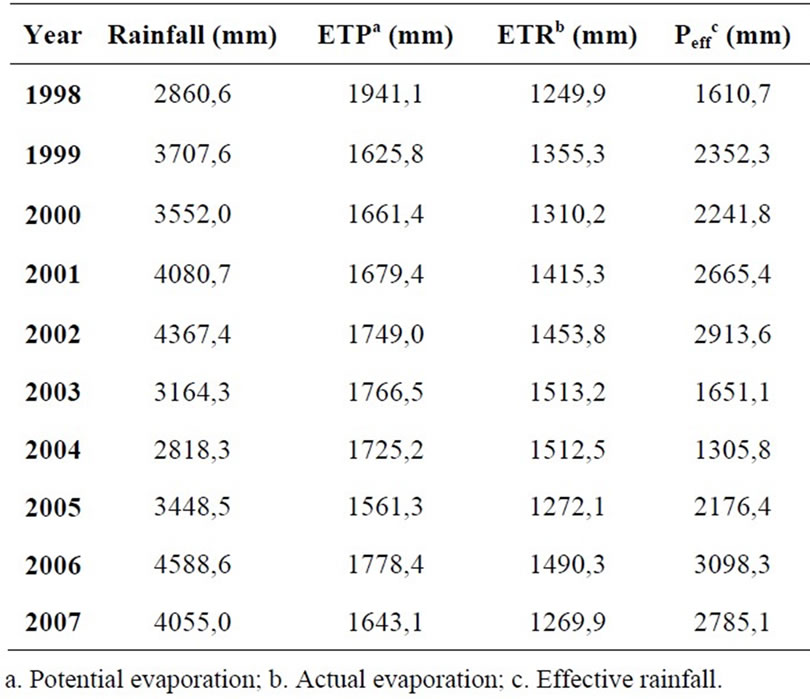
Table 1. Water balance for the period 1998 to 2007 in the study area (data collected from the meteorological station of Douala airport).
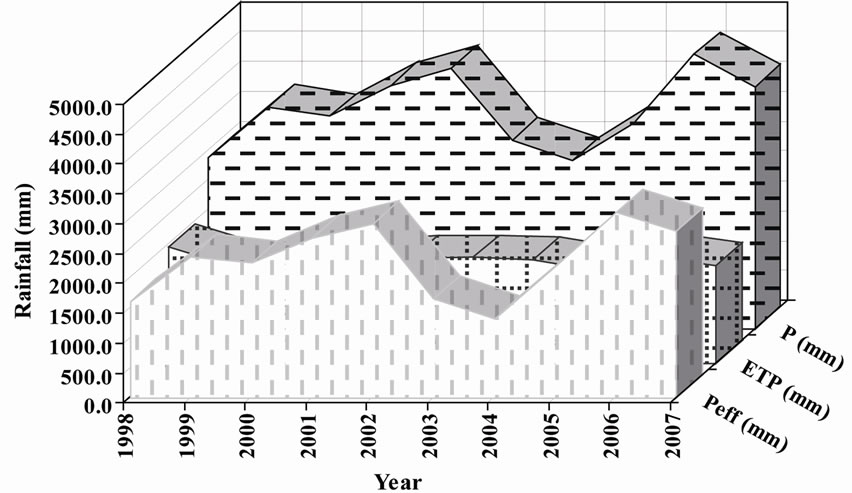
Figure 12. Comparison between total rainfall, evaporation and effective rainfall in the Besseke basin (Douala).
According to reference [24], analysis of the vertical drainage of an aquifer by effective rainfall or effective infiltration is based on the assumptions of [25] and [15]. The graph showing the evaluation of the effective rainfall can observe a change in the surplus from one year to another. Indeed, we notice an oscillation on the graph, a significant decrease in 2004. We recorded significant increases in effective rainfall during the years 2002 and 2006. A significant decrease in height effective rainfall since 2002 until 2004 to see in 1998 another year of recharge. During the study period, there has been three years that can be distinguished from the remaining years, two years of groundwater recharge (from 1998 to 2002 and from 2004 to 2006), a year of groundwater discharge (2002 to 2004). In conclusion, we can say that: In the period 1998 to 2007, the total rainfall in the watershed of Besseke is 36,643 mm and the total ETR is 13842.7 mm, which corresponds to 38% of evapotranspiration, the total surplus is calculated to 22800.6 mm that is 62% of rainfalls, remains available for runoff and infiltration. The average annual rainfall came in at 3664.3 mm for an average ETR of 1384.24 mm and a surplus of 2280.06 mm. These values are more than twice as much higher than those obtained in the chalk aquifer of the northern margin of the Paris Basin by Lallahem [26].
In addition, the study of water balance using Thornthwaite interannual (Table 2) shows that 9.53% of the rainfalls seeps into the ground to help recharge the aquifer.
Recharge rates of 9% - 16% were estimated in granite formations in Galicia-Costa Spain [27]. Figure 13 summarizes the periods of recharge/discharge of the aquifer. The temporal distribution of seasons has a significant influence on recharge/discharge of the water. The complete emptying occurs during the long dry season (November to March). Charging is directly influenced by rainfall patterns and also suffers with a delayed effect, the incidence of cumulative rainfall deficits. The role of rainfall in the recharge of groundwater has been shown and specified by the action of water table in wells monitored.
3.3.2. Relationship Rainfall-Water Table-Flow
The evolution of static water levels in wells monitored in the watershed is almost identical to changing rainfall
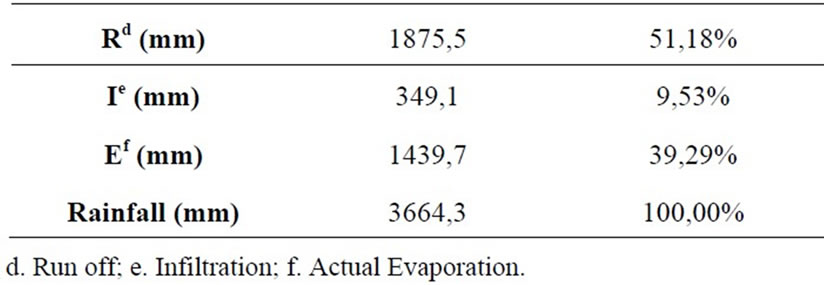
Table 2. Thornthwaite water balance for the period 1998 to 2007 in the study area.
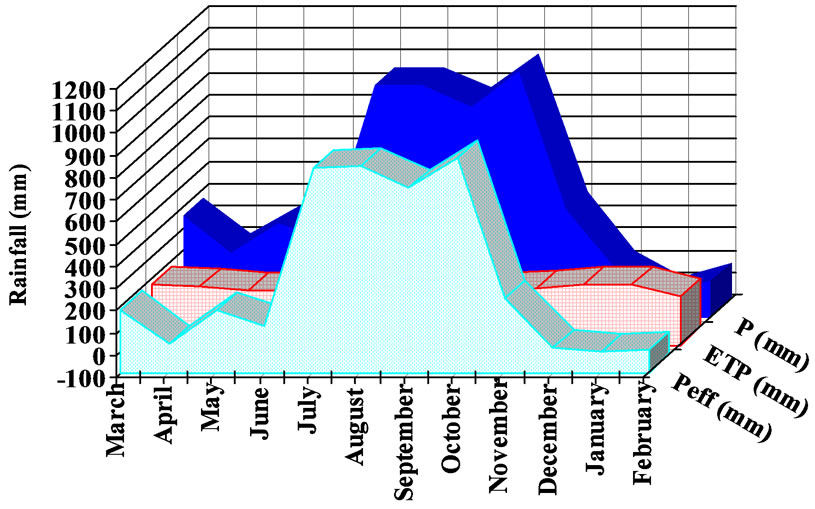
Figure 13. Curves showing the period of recharge and discharge of the water table in the Besseke basin (Douala).
during the same year (Figure 14).
This dependence of the effective rainfall infiltration has been recognized in other parts of the world [28-30]. The water table in wells decline between January and March. The fluctuation of water table is quite high and ranged between 0.00 and 5.80 m. This reflects more or less sensitivity to changes in wells and therefore, an aquifer constantly fluctuating with the seasons. 2% of these wells have a zero water table no matter what the climatic season (PI041 and PI072).
It is important to note that the spring of the Besseke’s river is a temporary resurgence. His topographic position does not make measurements to calculate flow. It dries up during the dry season and reappeared in the rainy season (July, August and September).
In general, the correlation between rainfall and water table of well is clear (water table of some wells is almost zero during dry season). This water table increase during dry season and decrease during wet seasons. Whatever time of year, the water is almost flush. However, except for wetlands, water table of wells is found at a depth of 9.00 m during the discharge of the water that runs from mid-November to mid-March against 2.62 m on average during periods of high waters or recharge period that runs from mid-March to mid-November, that is a fluctuation of 6.38 m. The only problem encountered by people in the water, is the questionable quality of water that people consume and the saltiness of the water distributed by public network [31].
3.3.3. Soil Characteristic
Soils in the study area are sandy-gravelly sand. Soil type (Table 3) with the expected rate of rainfall, increase the infiltration rate of water in the drainage basin of Besseke. But, given the high values of evaporation also recorded at the meteorological station in Douala Airport, the effective rainfalls (2280.06 mm) that reach the ground floor is low and thus reduce the infiltration rate. Indeed,
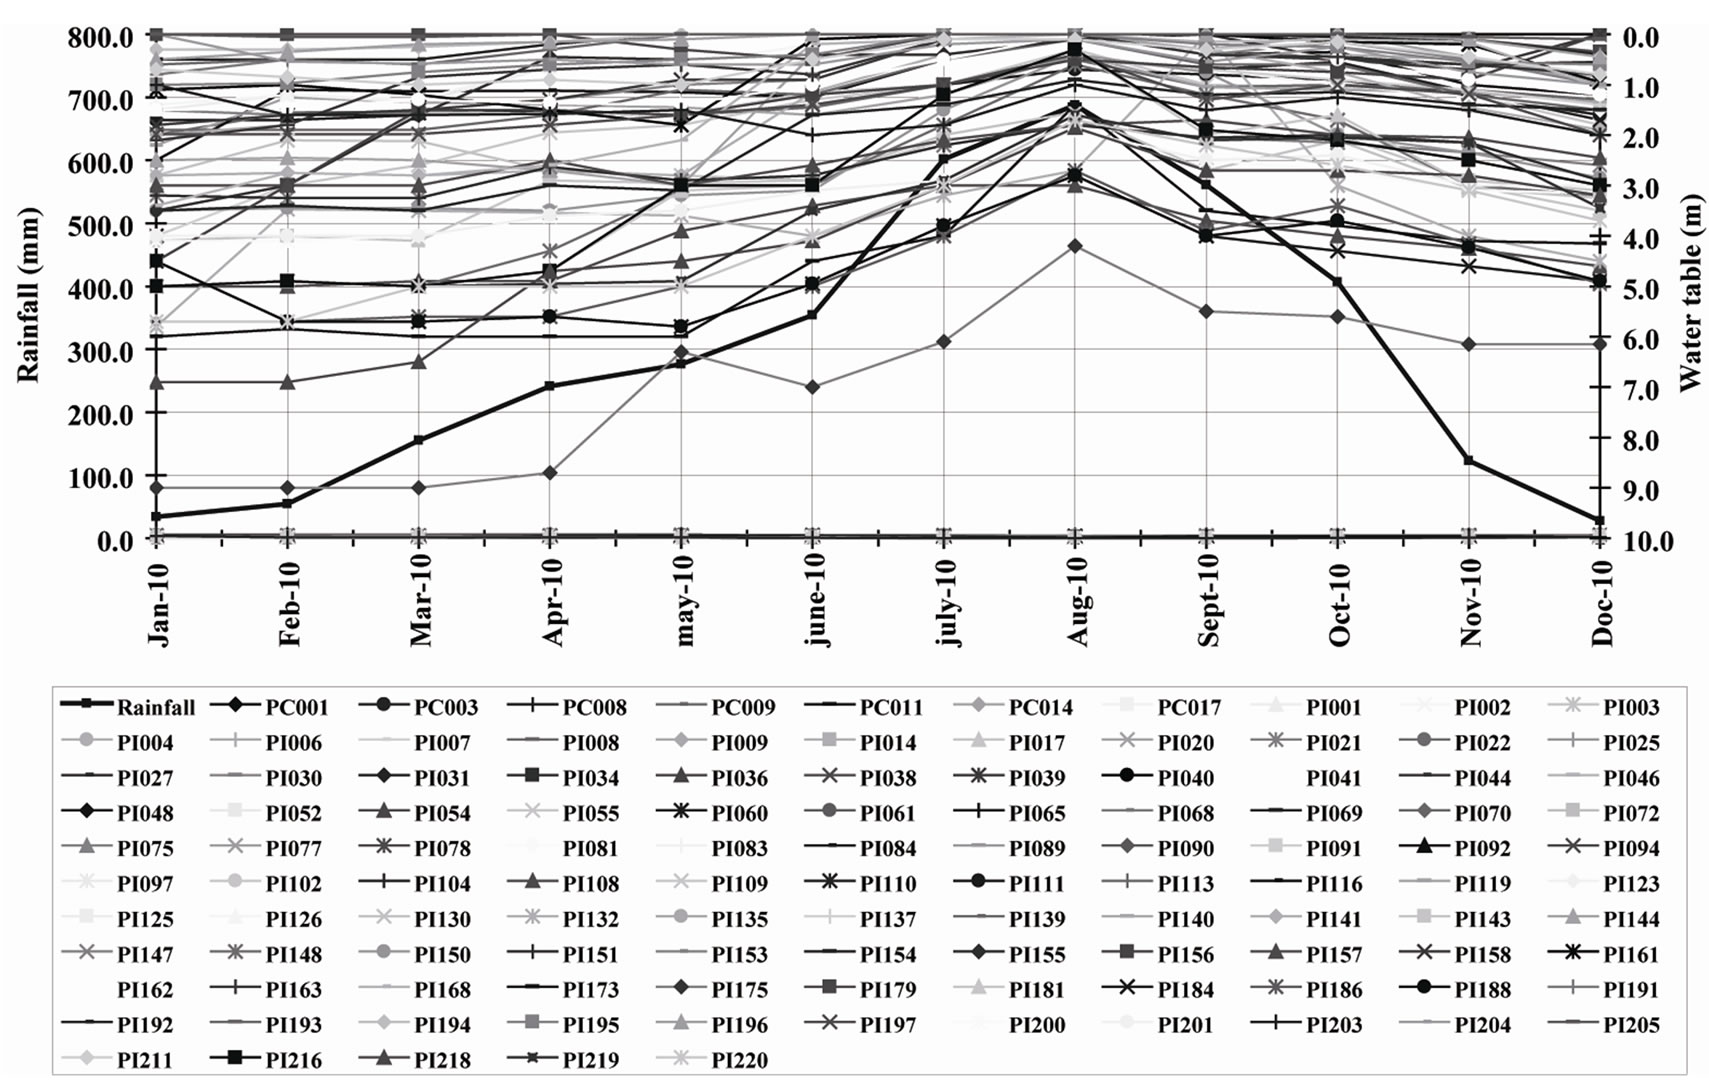
Figure 14. Curves of water levels trend according to rainfall in the Besseke basin (Douala), PC mean common well and PI, individual well.
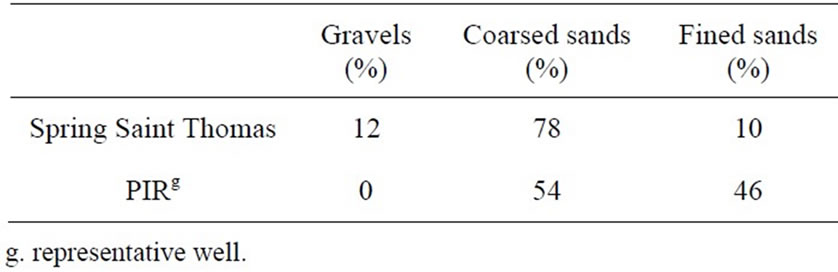
Table 3. Soils portions of the study area expressed in percentage and the values of the activity coefficient.
the permeability values obtained (10–8 - 4.41 × 10⁻⁶ m/s) reflect a slow supply of the upper aquifer by rainwater and confirm the infiltration rate given by the water balance. In addition, in view of the quantity of effective rainfall reaching the soil, infiltration rate is close to that found in the city of Yaounde (10.31%) in general and in the watershed of Ekozoa especially [7].
4. Conclusions and Outlook
The interest of this study was to put in evidence climate variability in a wet region where the continuing trend of declining rainfall, the groundwater balance is very variable. However, very little of this variability is noticeable that emphasizes long-term may be responsible for the degradation of the hydrological system. In addition to this degradation of the hydrological system, we must also mention the deterioration of the quality of water resources on the one hand, by bacteria and some pollutants (ammonium, nitrate and heavy metals) and secondly, by upwelling of saline water that degrade the taste of the water distributed in the network. From 1971 to 2001, total annual of rainfalls are changing along a downward trend. The shortfalls are relatively small compared to those observed in the Sahel regions like the far north Cameroon. The water budget analysis indicates a total period drain of water between November and March. It is quite obvious that this decrease in reserves of groundwater continues many activities related to human being will be affected.
This first overview of changes in rainfall should of course call for a comprehensive study on the variability of water resources in basins of similar size, than on larger basins and in other latitudes, taking into account the effects of human being in the development of water resources. This study also opens perspectives on the use of hydrological modeling tool in an objective forecasting resource (under various scenarios) in the horizons of medium and long term.
5. Acknowledgements
The authors would like to thank the Meteorological station of Douala airport for the climatic data collected and the International Foundation for Sciences for their support.
REFERENCES
- F. Mkamkan Kamga, “Validation of General Circulation Climate Models and Projections of Temperature and Rainfall Change in Cameroon and Some of Its Neighbouring Areas,” Theoretical and Applied Climatology, Vol. 67, No. 1-2, 2000, pp. 97-107. doi:10.1007/s007040070018
- F. Mkamkan Kamga, “Impact of Greenhouse Gas Induced Climate Change on the Runoff of the Upper Benue River (Cameroon),” Journal of Hydrology, Vol. 252, No. 1-4, 2001, pp. 145-156. doi:10.1016/S0022-1694(01)00445-0
- Intergovernmental Panel on Climate Change, “Climate Change 2001: Impacts, Adaptation and Vulnerability, Contribution of Working Group II to the Third Assessment Report of the Intergovernmental Panel on Climate Change (IPCC),” In: J. J. McCarthy, O. F.Canziani, N. A. Leary, D. J. Dokken and K. S. White, Eds., Cambridge University Press, Cambridge, p. 1032.
- L. Menzel and G. Burger, “Climate Change Scenarios and Runoff Response in the Mulde Catchment (Southern Elbe, Germany),” Journal of Hydrology, Vol. 267, No. 1-2, 2002, pp. 53-64. doi:10.1016/S0022-1694(02)00139-7
- I. D. Phillips, G. R. Mcgregor, C. J. Wilson, D. Bower and D. M. Hannah, “Regional Climate and Atmospheric Circulation Controls on the Discharge of Two British Rivers,” Theoretical and Applied Climatology, Vol. 76, No. 3-4, 2003, pp. 141-164. doi:10.1007/s00704-003-0021-8
- D. Sighomnou, L. Sigha, G. Lienou, A. Dezetter, G. Mahe, E. Servat, E. Paturel, J. C. Olivry, F. Tchoua and G. E. Ekodeck, “Impacts des Fluctuations Climatiques sur le Régime des Écoulements du Fleuve Sanaga au Cameroun, Prospectives Pour le XXIème Siècle,” Technical Document in Hydrology, UNESCO, Vol. 80, 2007, pp. 173- 182.
- R. Feumba, J. G. Tabue Youmbi and B. Ngounou Ngatcha, “Variabilité Climatique dans le Bassin Versant de l’Ekozoa à Yaoundé au Cameroun et Impact sur la Recharge de la Nappe,” Paper Presented at the Workshop Held in Cotonou, Benin on ‘Climate Change’ within the Framework of the Launch of Projects RIPIESCA and CORUS 2, 8-11 Octobre 2007.
- J. B. Suchel, “Les Climats du Cameroun,” Thèse Doctorat d’Etat, Université Bordeaux III, Bordeaux, Vol. 4, 1987, p. 1186
- J. C. Olivry, “Fleuves et Rivières du Cameroun,” MesresOrstom, Paris, 1986, p. 733.
- P. R Njiké Ngaha, “Contribution à L’Etude Géologique, Stratigraphique et Structurale de la Bordure du Bassin Atlantique du Cameroun,” Thèse de Doctorat 3eme Cycle, Université de Yaoundé, Yaoundé, 1984, p. 133.
- M. Regnoult, “Synthèse Géologique du Cameroun—Ministère des Mines, de l’Eau et de l’Energie,” 1986, p. 119.
- E. Kouakou Koffi, A. Goula Bi Tie and Savane Issiaka, “Impacts de la Variabilibité Climatique sur les Ressources en eau de Surface en Zone Tropicale Humide: Cas du Bassin Versant Transfrontallier de la Comoé, Côte d’IvoireBurkina Faso,” European Journal of Scientific Research, Vol. 16, No. 1, 2007. pp. 31-43.
- P. Franquin, “Analyse Agro Climatique en Région Tropicale, Saison Pluvieuse et Saison Humide, Application,” Cahier ORSTOM, Série Biologique, No. 9, 1969, pp. 65- 95.
- P. Brochet and N. Gerbiers, “L’évapotranspiration,” Monographie n 65, S.M.M., Climatolog, Paris, 1975, p. 95.
- C. W. Thornthwaite, “An Approach toward a Rational Classification of Climate,” Geography Review, Vol. 38, No. 1, 1948, pp. 55-94.
- S. Sambou and E. N. Malanda Nimy, “Critique Statistique des Séries de Pluies Annuelles dans le Bassin Amont du Fleuve Sénégal,” IAHS Publication, Vol. 308, 2006, pp. 319-324.
- J. E. Paturel, E. Servat, B. Kouamé, H. Lubès, M. Ouedraogo and J. M. Masson, “Climatic Variability in Humid Africa along the Gulf of Guinea, Part Two: An Integrated Regional Approach,” Journal of Hydrology, Vol. 191, No. 1-4, 1997, pp. 16-36. doi:10.1016/S0022-1694(96)03069-7
- J. E. Paturel, E. Servat, H. Lubes and M. O. Delattre, “Analyse de Séries Pluviométriques de Longue Durée en Afrique de l’Ouest et Centrale non Sahélienne dans un Contexte de Variabilité Climatique,” Hydrological Sciences Journal, Vol. 43, No. 6, 1998, pp. 937-946. doi:/10.1080/02626669809492188
- E. Servat, J. E. Paturel, H. Lubès, B. Kouamé, M. Ouedraogo and J. M. Masson, “Climatic Variability in Humid Africa along the Gulf of Guinea. Part One: Detailed Analysis of the Phenomenon in Côte d’Ivoire,” Journal of Hydrology, Vol. 191, No. 1-4, 1997, pp. 1-15. doi:10.1016/S0022-1694(96)03068-5
- D. Sighomnou, “Analyse et Redéfinition des Régimes Climatiques et Hydrologiques du Cameroun: Perspectives D’évolution des Ressources en Eau,” Thèse de doctorat d’Etat es Sciences, Université de Yaoundé I, Cameroun, 2004, p. 209.
- H. Niel, C. Leduc and C. Dieulin, “Caractérisation de la Variabilité Spatiale et Temporelle des Précipitations Annuelles sur le Bassin du Lac Tchad au Cours du 20ème Siècle,” Hydrological Sciences Journal, Vol. 50, No. 2, 2005, pp. 223-243.
- S. E. Nicholson, “Climatic and Environmental Change in Africa during the Last Two Centuries,” Climate Research, Vol. 17, No. 2, 2001, pp. 123-144. doi:10.3354/cr017123
- Secheresse, “Journal Sècheresse,” Secheresse, Vol. 14, No. 1, January-March 2003.
- G. Castany, “Traité Pratique des Eaux Souterraines,” 2nd Edition, Dunod, Paris, 1963, p. 696.
- L. Turc, “Evolution des Besoins en eau D’Irrigation. Evapotranspiration Potentielle. Formule Climatique Simplifiée et Mise à Jour,” Annuaire Agronomique, Vol. 12, No. 1, 1961, pp. 13-49.
- S. Lallahem, “Structure et Modelisation Hydrodynamique des Eaux Souterraines: Application à L’Aquifere Crayeux de la Bordure Nord du Bassin de Paris,” Thèse de Doctorat en Génie Civil, spécialité Hydrogéologie; Université des Sciences et Technologies de Lille, laboratoire de Mécanique, 2002, p. 243.
- J. Molinero and J. Raposo, “Recharge Estimation and Groundwater Resources Assessment in Granitic Terrains of Galicia-Costa Hydrographical District (NW Spain),” In: L. Ribeiro, A. Chambel, Condesso and M. T. De Melo, XXX IAH Congress—Groundwater and Ecosystems, Abstract book, 2007, pp. 221-222.
- Y.-Y. Kim, K.-K. Lee and I. Sung, “Urbanization and the Groundwater Budget, Metropolitan Seoul Area, Korea,” Hydrogeology Journal, Vol. 9, No. 4, 2001, pp. 401-412. doi:10.1007/s100400100139
- M. Kili, El M. Bouabid and C. Jamal, “Bilan Hydrique des Sols et Recharge de la Nappe Profonde de la Plaine du Gharb (Maroc),” Sécheresse, Vol. 19, No. 2, 2008, pp. 145-151.
- Tristan D’Orgeval, “Impact du Changement Climatique sur la Saison des Pluies en Afrique de L’Ouest: Que nous Disent les Modèles de Climat Actuels?” Sécheresse, Vol. 19, No. 2, 2008, pp. 79-85.
- R. Feumba, B. Ngounou Ngatcha, C. Njakou Fomegni, E. Ngnikam and G. E. Ekodeck, “Water Quality, Exposure and Health of Population of the Industrial Zone of Bonaberi-Douala in Cameroon: Case of the Watershed of Besseke,” Poster présented at Ecohealth 2010, Londres, 18-20 2010.