Journal of Water Resource and Protection
Vol. 2 No. 10 (2010) , Article ID: 2961 , 8 pages DOI:10.4236/jwarp.2010.210104
Micro-Droplet Flux in Forest and its Contribution to Interception Loss of Rainfall – Theoretical Study and Field Experiment
1Department of Civil Engineering, University of Tokushima, Tokushima, Japan
2Dorset Environmental Science Centre, Ontario Ministry of the Environment,
Dorset, Ontario, Canada
E-mail: huaxia.yao@ontario.ca
Received July 16, 2010; revised August 9, 2010; accepted August 17, 2010
Keywords: Rainfall Interception, Micro-Droplet Transfer, Vapour Flux, Forest Canopy, Aerodynamic Diffusion
ABSTRACT
A new approach to explain forest interception was proposed by introducing micro-droplets of crushed raindrops during rainfall. The aerodynamic diffusion and transfer of both vapour and micro-droplets from canopy to upper air were described and calculated, and proposed formulas applied to eight rainfall events at the Okunoi Experimental Station, Tokushima, Japan. Contributions from droplet transfer were 0.9-58.2 times of contributions from vapour transfer, taking a majority portion in total interception loss. Accounting only the vapour transfer or evaporation loss as estimated by Penman equation was not able to account for actual interception loss. The micro-droplet flux component took major portion in the two heavily rained events, and completely made up the interception as happened in October 2004. The droplet flux could accommodate a high interception rate, even when the air was nearly vapour-saturated and vapour flux was zero. This approach provided a new explanation to extraordinarily high interception rates.
1. Introduction
Traditional theories and estimation methods of rainfall interception and its evaporation were based on a dominating conception: raindrops fell on leaves and branches of vegetation, some of raindrops were caught or intercepted by the leaves and branches, and intercepted raindrops were vaporized and transported outward during rainfall periods and after the periods. Three major methodologies as summarized by Chow et al. [1] have been developed to describe the interception evaporation process and estimate interception-evaporation rates: aerodynamic methods such as Thornthwaite-Holzman equation, energy balance methods, and combined methods such as Penman equation. They performed well for many geographical regions and various types of vegetations in the world. However, at some locations (especially humid tropical forests, maritime areas, or islands experiencing frequent storms or typhoons), none of the three methods could give satisfactory estimations.
One main reason for the failure would be that only vapour flux was considered in these methods, while other forms of water in the air – floating or suspended water droplets, or micro-droplets created by the canopy during rainfall interception – have not been paid much attention. Apart from the raindrops captured by the canopy, some raindrops were crushed into tiny/micro droplets looking like mist or fog droplets. These micro-droplets have much smaller sizes than raindrops and can float in the air, and can be aerodynamically transported from inside canopy to outside. During rainfall events, the air near ground or around forest was easily saturated with water vapour, and the micro-droplets appeared. This portion of micro-droplets and their vertical flux were a loss to the rainfall (they did not fall down onto ground as throughfall), and should be a component of interception loss. If that portion took a substantial proportion in the total interception loss, an underestimation of interception loss could occur as explained later. Therefore, the role of micro-droplet flux in interception loss needs to be noted for the situations of tropical forests, maritime areas, and islands.
So far no specific studies have been conducted to address the flux of micro-droplets and its connection to interception process. A few field studies have partially touched the topic. The fogwater droplets and their vertical movement were confirmed by field measurements [2,3], reminding a possible contribution from the micro-droplets. The phenomenon of extraordinarily high interception rates (higher than the Penman-Monteith equation rate) was partially explained by different perspectives: an extra energy coming from horizontal transfers (from dry locations to raining locations, or from warmer oceans to cooler forests) might lead to the high evaporation rate [4,5], the aerodynamic resistance of the canopy could be very low to force a high evaporation rate [5,6], the interception rate was related to rainfall rate and exceeded the net radiation [7], or the wind gusts and splashed droplets might enhance evaporation rates [8,9]. But neither of these studies or suggestions has given a thorough explanation for the phenomenon.
Therefore, we tried and suggested a new approach by introducing the existence and transport of micro-droplets. In our scheme for interpretation of interception loss of rainfall, the interception flux is composed of two flux components: vapour flux and micro-droplets flux. The vapour flux has its source from the liquid water on canopy surface and raindrops within the canopy; liquid water is vaporized first because of radiation or heat and the vapour is transported in the air. The micro-droplets are not gaseous vapour, not created by vapouration but by rain crushing on leaves and branches; the droplets do not fall down, they are transported by aerodynamic diffusion and winds. Not neglecting the droplets, an aerodynamic transfer estimation method was proposed and applied to both the vapour and droplets in the air within and above the canopy to calculate interception evaporation process, and each of the two flux components were calculated. The new method was presented in this article, and a case study was provided to demonstrate its applicability (capable to explain the extraordinarily high interception loss).
2. Experimental Station and Data
The Okunoi Forest Experimental Station (latitude 34o 01’, longitude 134o 12’) is located at Yamakawa Town, Yoshinokawa City, Tokushima Prefecture, Japan (Figure 1), where the annual precipitation and annual averaged air temperature are 1600 mm and 15oC respectively.
A meteorological observation tower was set up at the elevation of 230 m, with a height of 26 meters. Meteorological observations were conducted at three different heights along the tower. A set of meteorological factors
(temperature, humidity, wind speed, wind direction, sunshine duration, and net radiation) were measured at the height of 18.2 m, temperature and humidity were
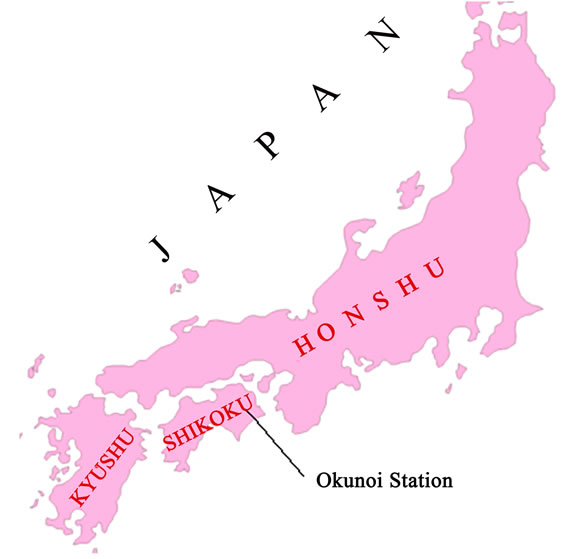
Figure 1. Location of experimental station.
measured at the height 1.5 m and 25.8 m.
Measurements of canopy’s interception of rainfall were made for two typical trees: a Hinoki cypress (Chamaecyparis obtusa, a conifer in cypress family and native to Japan) and a Sugi cypress (Cryptomeria japonica, a conifer in cypress family and endemic to Japan), using similar methods as described by Chang [10]. The gross rainfall was measured at an open spot close to the station with standard rain gauges. The representative Hinoki and Sugi trees were both 17 m high.
Automatic recording of meteorological variables was started in 1999 at the meteorological tower, and hourly, daily and annual data were collected for the station. Interception measurements were conducted in 2003 and 2004, providing hourly data of throughfall, stemflow and interception loss.
3. Methods
Vertical transfer flux of vapour and micro-droplets by turbulent air diffusion were described by the Fick law of aerodynamics as follows.

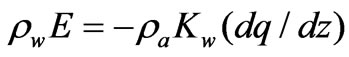 (1)
(1)
where, ρw was the density of liquid water, E the rate of interception loss (volumetric water loss per unit time per unit area), ρwE the vertical flux of interception, ρa the density of moist air, Kw the coefficient of turbulent air diffusion, q the specific humidity of water vapour and droplets in the air at a giving height z.
Momentum flux of turbulent air mass was expressed as
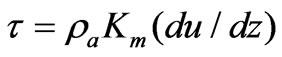 (2)
(2)
where τ was the friction stress at height z, Km the diffusion coefficient for the momentum (usually equal to the turbulent air diffusion coefficient Kw), and u the wind velocity at height z.
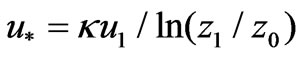
Vertical profiles of wind velocity and specific humidity, and an illustrative scheme of transfer fluxes of vapour and droplets were illustrated in Figure 2. The tree canopy had a height of h, produced a roughness height of z0 at which the wind velocity was zero, gave a canopy’s displacement height of d at which a zero heat flux existed. The z1 and z2 were two heights (may be the meteorological measurement heights), and their corresponding wind velocity and specific humidity were u1, u2 and q1, q2 respectively. Note that any height as z, z1 or z2 was the height measured against the position of displacement height, or it was a residual height of actual height from the ground minus the displacement.
Applying (1) and (2) to the heights z0 and z1 respectively and combining the results together, gave the following equation.
 (3)
(3)
Wind velocity distribution in vertical was well described by a logarithm formula:
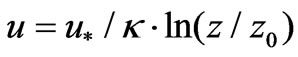 (4)
(4)
Here u* was the frictional velocity of air, κ the Von Karman constant (0.4). Applying (4) to the height z1 provided an estimation of frictional velocity,
 (5)
(5)
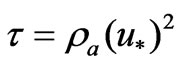
The friction stress was expressed as a relationship of frictional velocity,
 (6)
(6)
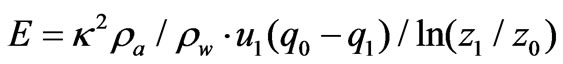
In (3) let the u0 being zero and Km being equal to Kw, and substitute it for (6), an estimation formula for the rate of interception loss E was obtained.
 (7)
(7)
This equation of interception rate had a similar shape as traditional ones. However, here the specific humidity included both water vapour and droplets. The vapour pressure or its humidity component could be measured in field or calculated with empirical formulas, while the droplet pressure or its humidity component were not measured at present and had to be estimated.
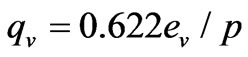
Vapour pressure ev was related to its specific humidity qv as
 (8)
(8)
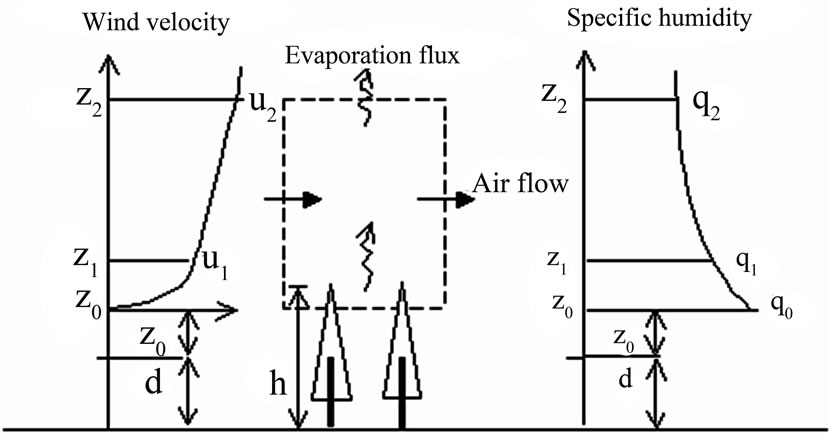
Figure 2. Scheme of evaporation flux and profiles of wind velocity, specific humidity.
where p was air pressure. It was assumed that the combined pressure e of water vapour and droplets in the air was similarly related to their specific humidity q: q = 0.622e/p. A new equation of interception rate in terms of pressure was obtained by inserting the q~e relation into (7).
 (9)
(9)
Since u1 was known from wind observation, and all other parameters except e0 and e1 were known too, (9) was written as
 (10)
(10)
in which A was a constant for a given canopy. For example, for the Sugi tree, h = 17 m, z0 = 0.07 h or 1.19 m, d = 0.78 h [11] or 13.26 m, z1 = 4.94 m. Other constant parameters in (9) or (10) took values as p = 1,013 hPa, ρa = 1.19 kg/m3, ρw = 997 kg/m3. By using the units of E, u1, eo and e1 in mm/hr, m/s, and hPa respectively, a value for A was determined as 0.20835.
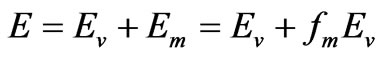
An effort was made to separate pressure e into two compartments – the vapour pressure ev and droplet pressure em, so that ev could be described by existing knowledge and em could be estimated in some way. For the height z0, the separation was expressed as
 (11)
(11)
 (12)
(12)
where esat was the saturated vapour pressure and was determined solely by air temperature at the site. It was acceptable that the vapour pressure e0v would be equal to or very close to the saturated vapour pressure, when it was raining and floating droplets existed in and around canopy. In order to estimate the droplet pressure, e0m was supposed to be proportional to e0v as appeared in (12). Whenever the ratio fm was determined, the droplet pressure and flux could be estimated.
Similarly the separation was used for the height z1 that was usually a meteorology observation height and close to the top of canopy, resulting in e1 = e1v + e1m = e1v + fm·e1v. By substituting this e1 expression and (11) for (10), a calculation formula for vapour and droplet flux was established as:
 or
or
 (13)
(13)
where Ev and Em were water vapour flux and droplet flux respectively. The integrated vapour and droplet flux E was a sum of vapour flux and droplet flux.
It was difficult to determine the separation ratio fm for any given time as it varied with time. It was not practical to derive a ratio value by using (13) and observing vapour and droplet pressures for any time in a rainfall process. Therefore, an approximate method of determining the ratio fm was proposed. A rainfall-interception event or process (with time scale of some hours to a few days) was divided into many segments timely with each segment being a time unit such as an hour. From the starting hour till a time point in the process, the cumulative interception amount I was the sum of cumulative loss via vapour flux and cumulative loss via droplet flux, i.e.,
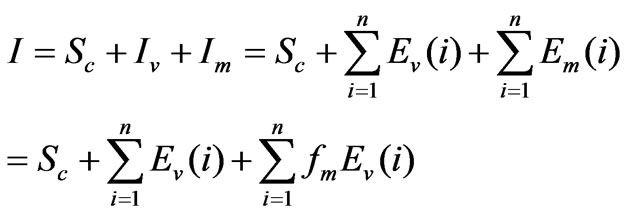 (14)
(14)
where Iv was the interception loss via vapour transfer, Im was the loss via droplet transfer, Sc was the storage of water held by canopy, and i was the number of time segments. The Sc possessed a small portion in total interception loss when the rainfall was large enough, and could be negligible. For instance if there was a rainfall of 50 mm, the loss would be 10 mm via interception, while the water on canopy was 1 mm.
If the average value of fm over a time period (from segment 1 to n) was named as fma, Equation (14) became (15).
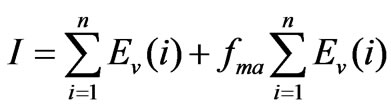 (15)
(15)
Now the average ratio for the cumulative time period at a time point was estimated by following formula. And that average ratio was an approximate estimation of fm at a time point during rainfall.
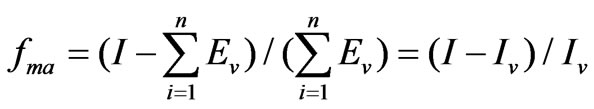 (16)
(16)
A calculation process for a rainfall event looked like this: starting from the first time segment, getting interception loss and vapour flux during the segment using observed data, obtaining a ratio value for the first segment with (16), obtaining the droplet flux loss with (14); then going to the second segment, getting cumulative interception loss and vapour flux loss for the two segments, obtaining a ratio (average) and a droplet loss; and so on continued until the end of rainfall. The processes of cumulative interception, vapour flux and droplet flux were calculated, and separate vapour flux loss and droplet flux loss for a rain event were thus obtained.
The rainfall events whose rainfall amount was more than 50 mm were considered, because the canopy water storage in (14) could be neglected for these events. Eight such events were chosen from collected data in year 2004. The date of events, duration D, total rainfall amount R, observed interception amount I of the Sugi cypress tree at the Okunoi Experimental Station, mean temperature T for a event, mean wind speed u and mean relative humidity Rh1 as observed at height 18 m, and mean humidity Rh2 as observed at height 26 m were listed in Table 1.
The rain events occurring in May through October had rainfall durations of 14 to 74 hours, rainfall amounts of 56 to 425 mm, interception loss of 7.7 to 51.7 mm, air temperatures of 14.6 to 24.2oC, wind speeds of 0.2 to 1.4 m/s, and relative humidity of 97.6 to 99.7% at the height 18 m which was just on top of canopy. Humidity in the canopy was very high for all events. However, the humidity at height of 26 m was 86.6 to 96.0%, a little bit lower.
Another typical method of estimating evaporative loss from intercepted water was the Penman method as follows,
 (17)
(17)
where EP was the Penman’s evaporation rate from canopy surface (water vapour flux from captured water),  the psychrometric constant, equal to 0.66 mbar/0C,
  the slope of the saturation-vapour-pressure versus temperature curve (mbar/0C),
  , (mm・hr-1・mbar-1), u the wind velocity (m/s), esat and ev are the saturation and actual values of vapour pressure.
4. Results
4.1. Existence of Droplet Transfer and its Separation from Total Interception
Interception loss of each event (Figure 3) was strongly proportional to total rainfall. A traditional aerodynamic method estimating interception took only vapour flux into consideration, i.e., the Iv component in Equation (14). Obviously Iv was much less than observed interception I. In other words, an important interception component, the droplet transfer, did exist in these rain events and could not be ignored. The difference I – Iv was the droplet transfer and had values of 7.1 to 70.0 mm, possessing a percentage of 48 to 98 % in total interception amount.
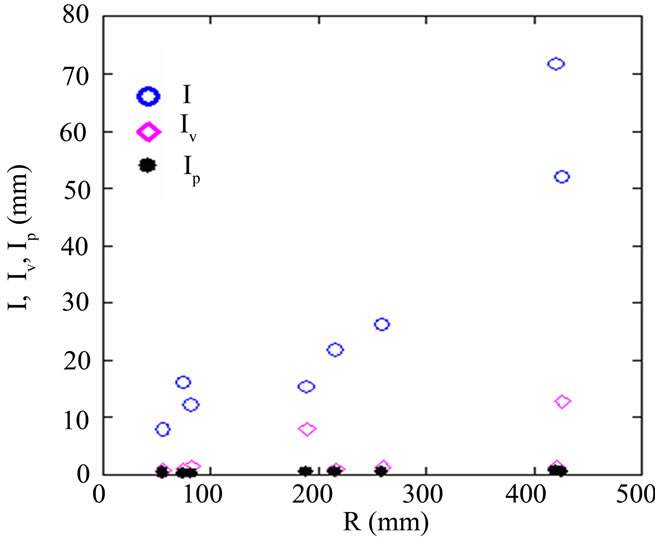
Figure 3. Observed interception loss, estimated interception by aerodynamic method or Penman method, corresponding to total rainfall of eight events.
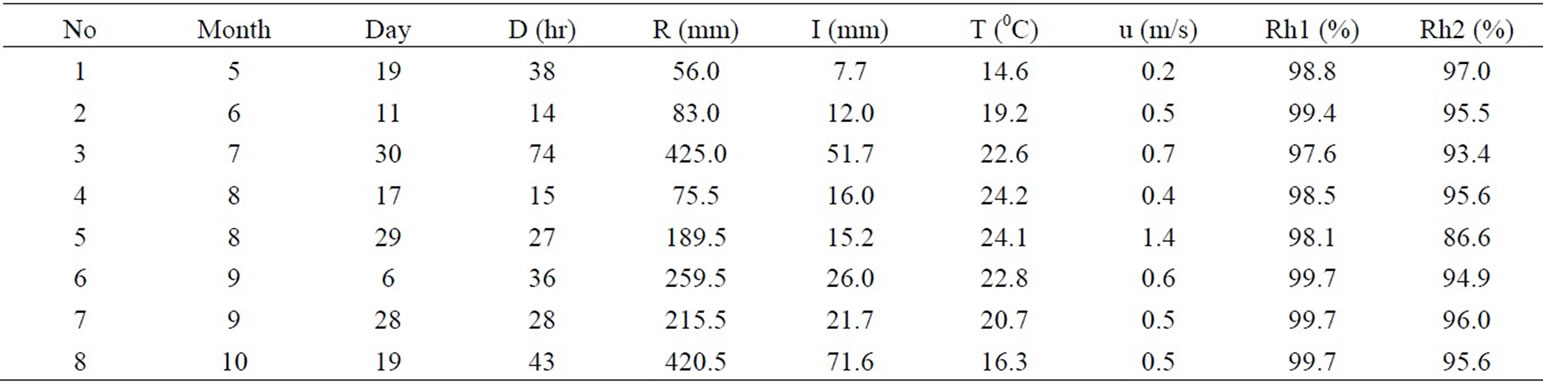
Table 1. Interceptions of Sugi tree and meteorological conditions of rain events (2004).
Estimated interception IP with the Penman equation was compared with observed I in the figure. IP was too less than I to give a reasonable estimation. The underestimation of aerodynamic method (Iv) or Penman method (IP) against observed interception loss was explained like this: during the hours or days of rainfall events, water vapour in and around canopy was saturated or near saturation, and vapour diffusion could hardly proceed to transfer the moisture which was lost via interception process; the low level of net radiation was not able to vapourize water on wet canopy and maintain the interception rate, and vapour transfer did not contribute much to interception. On the other hand, the floating droplets created by raindrop crushing provided water source for interception loss, and this part of water transfer became the major part in interception for these events.
The average ratio fma of droplet pressure to vapour pressure for an event, or the average ratio of total droplet transfer to vapour transfer in the event, was calculated with (16). The ratio varied between 0.9 and 58.2 (Figure 4) among the eight events depending on individual condition of each event. It did not imply that a bigger rainfall gave a bigger ratio value.
4.2. Detailed Processes in Two Different Events and their Comparison
In the above section, total interception losses of eight rainfall events were displayed and explained. Hourly process of interception in an event was discussed by using two events that have different meteorological conditions and interception features, and their difference was explained. There were two events with extraordinary heavy rainfall: one occurred on July 30-31-August 1, the other occurred on October 19-20-21. Name them as Event A and B. Both A and B had rainfall over 400 mm, but A had higher temperature, greater wind speed, smaller humidity, smaller rain intensity, longer rain duration, and less interception loss, compared to B. The meteorological condition and hourly interception rate were displayed in Figure 5.
Among the meteorological factors, rainfall intensity
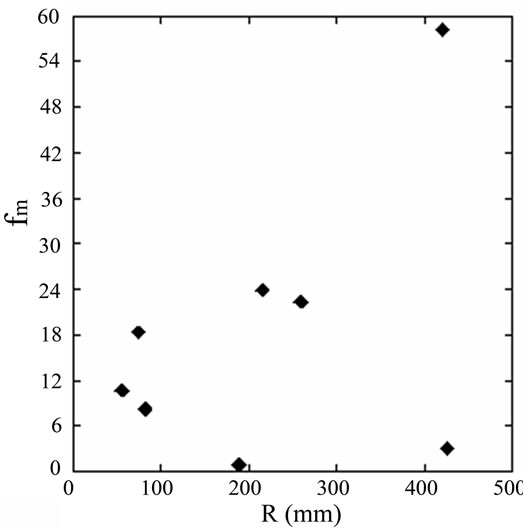
Figure 4. Average separation ratio and total rainfall.
played the most important role in shaping interception rates. Although the higher temperature, lower humidity and larger wind speed condition in Event A would have caused more interception than Event B would do, the weaker rain intensity of A determined that its total interception loss was 51.7 mm, less than the total loss 71.6 mm of B which had stronger intensity, even A has a longer duration (74 hours versus 43 hours). The interception amount which happened around the peak rainfall rate was keen in determining the total loss. A clear proportional relationship between interception rate and rain intensity was seen in Figure 6, especially for Event B.
Interception process or the changes with time was described in terms of cumulative features. Cumulative interception ∑i (i.e., accumulated interception by the 10th hour was i1 + i2 + ……+ i10), and cumulative rainfall amount ∑r, were displayed in Figure 7 for Event A and B, starting from the first hour and ending at the last hour. Cumulative vapour transfer ∑iv estimated with aerodynamic Equation (10) and cumulative interception estimation ∑ip estimated with Penman equation were also showed in the figure. For Event A, vapour component ∑iv dominated the cumulative interception for the initial hours, and then lose its domination, and the droplet component (∑i - ∑iv) dominated the cumulative interception. Estimation by Penman method ∑ip was almost zero.
For Event B, cumulative vapour transfer did not appear, and the entire interception process was controlled
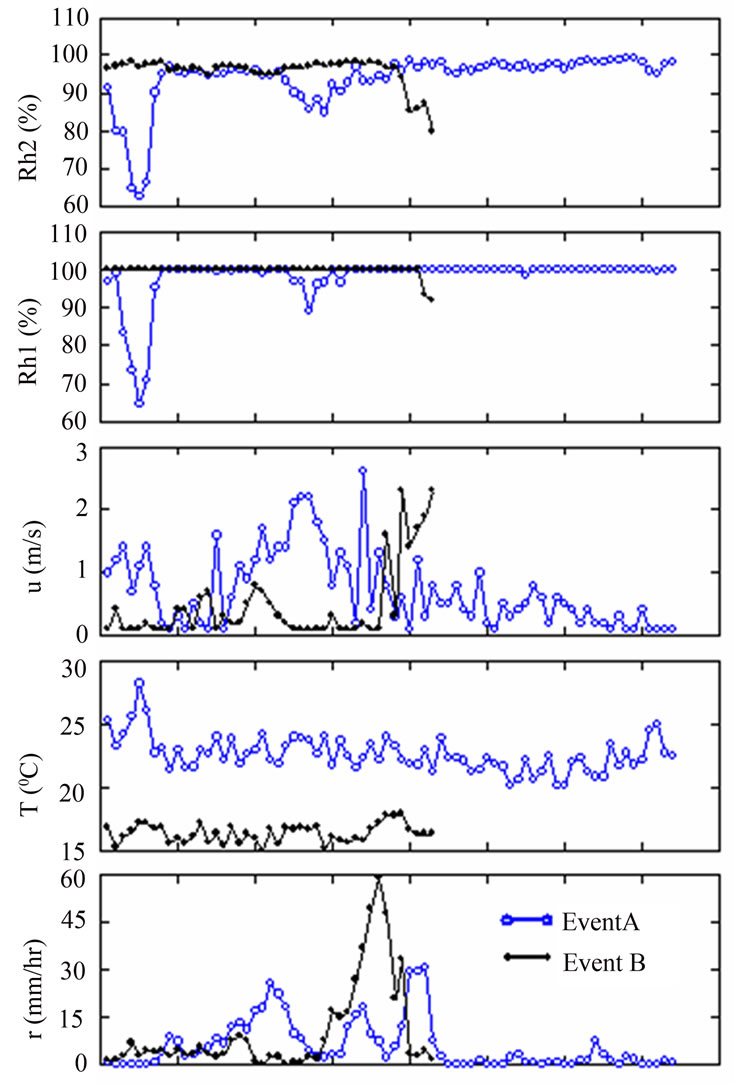
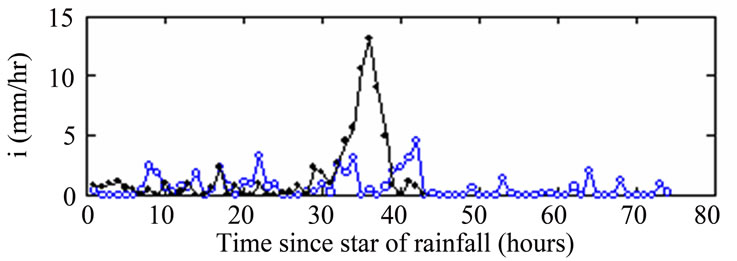
Figure 5. Meteorological conditions and interception rates for Events A and B (r – rainfall intensity, T – temperature, u – wind speed, Rh1 – relative humidity at height 1, Ph2 – relative humidity at height 2, i – interception rate as observed).
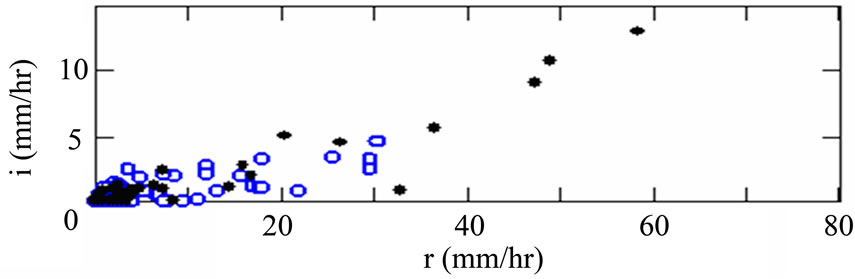
Figure 6. Relationship of interception rate i and rainfall intensity r (circles for Event A, solid dots for Event B).
by droplet transfer component.
The ratio of cumulative droplet transfer (∑i - ∑iv) to cumulative vapour transfer ∑iv was named as fmc, and showed in Figure 8. For Event A, it fluctuated at first, and then increased with cumulative rainfall (or with time) and reached over 3. This meant that droplet component possessed more and more contribution in the cumulative interception. The ratio for Event B was not seen in the
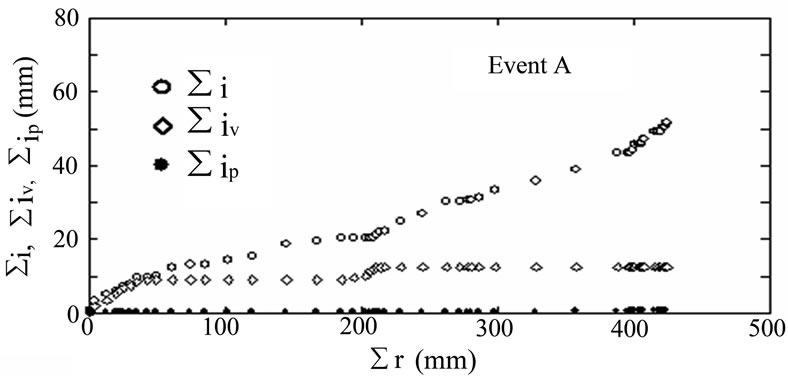
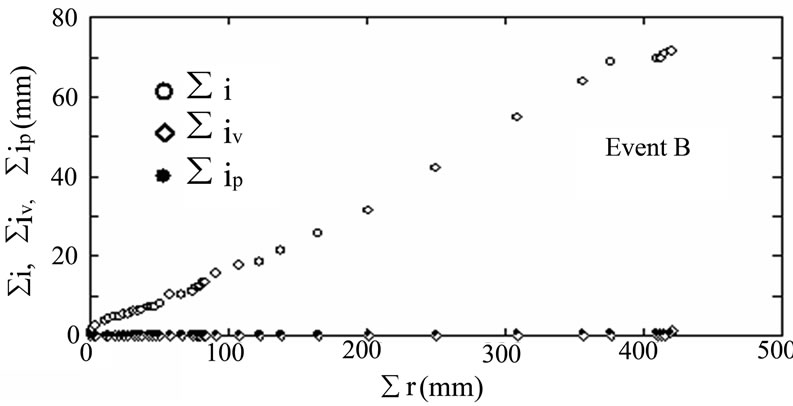
Figure 7. Cumulative interception during Event A or B, respectively from observation, aerodynamic method and Penman method.
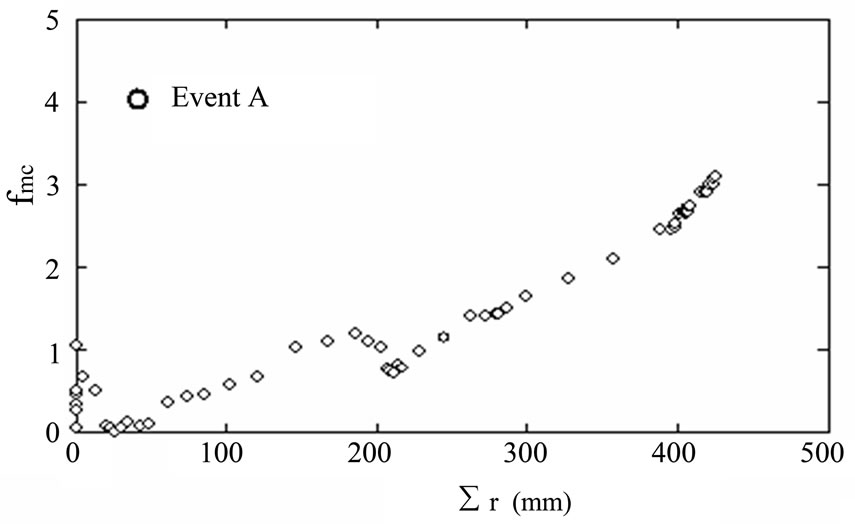
Figure 8. Ratio of droplet flux to vapour component.

figure as the value was too big – the cumulative vapour component was close to zero.
To explain the importance of droplet transfer component more clearly, a ratio of cumulative droplet transfer (∑i - ∑iv) to cumulative interception ∑i was plotted in Figure 9. For Event A the ratio changed between 0.0 and 0.8 and increased with cumulative rainfall. Droplet component possessed more than 50% in most of the duration. For Event B, the ratio did not change and took the highest value 1.0, or there was only droplet component in the interception for that case.
5. Discussion
The behavior and relative importance of the two components vary with climate condition, rainfall type and size, canopy structure and so on. It is reasonable that vapour
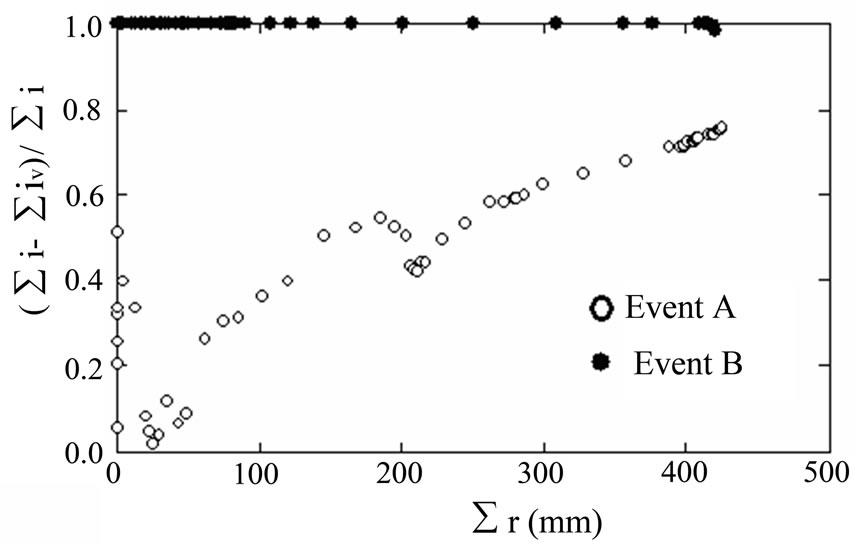
Figure 9. Ratio of droplet flux component to cumulative interception.
transfer is the main part of interception loss in areas of temperate/cold regions where there are often drizzle rains – they do not show a good chance to produce droplets, and the canopy is easily wetted. The droplet transfer component may be the main part of interception in other areas such as tropical rainforests or humid islands where there are more storms with heavy rainfall and larger raindrops.
Droplet transfer, advected heat/energy provision from nearby environment, and upward wind may together contribute to the reported and questioned high interception rates, or some of the three mechanisms contribute more substantially. For example, to take droplet transfer into consideration would help to explain the questions and contradictions indicated by Dykes, Schellekens et al., Zimmermann et al., Hashino et al., Murakami, and Vernimmen et al.
Hall’s investigation [12] at tropical tree canopies showed that predicted interception loss was relatively insensitive to raindrop size, while some others’ results indicated the sensitivity. The interception calculation he used was based on a mechanism of canopy wetting, and therefore raindrop size was not as important as canopy characteristics in determining the loss. If we also think of the existence of micro-droplets and their contribution to interception loss, the size of raindrops may need to be considered, because the volume of micro-droplets are related to raindrops.
Toba and Ohta [13] compared two Siberian forest sites and five Japanese forest sites with regards to interception loss. At the Siberian sites, net radiation was always larger than latent heat flux consumed by interception, therefore the energy supply met the interception evaporation usage. The Japanese sites often showed opposite pattern: latent heat flux exceeded net radiation and gave high interception rates. They noted that air temperature at upper levels were higher than that at lower levels, and thought that the sensible heat flux was directed downward to support the evaporation from wet canopies. We would like to say that micro-droplets are another reason for the exceedance of interception rate over net radiation. In the temperate and humid Japanese sites, heavy and frequent rains produce micro-droplets that are not negligible for interception loss, while in the cold Siberian sites, micro-droplet transfer is not so important.
6. Conclusions
The aerodynamic diffusion and transfer of both vapour and micro-droplets from canopy zone to upper air were described and calculated in a new perspective, and proposed formulas were applied to eight rainfall events at the Okunoi Experimental Station. Contributions from droplet transfer were 0.9-58.2 times of contributions from vapour transfer, taking a majority portion in total interception loss of the rain events. Taking only the vapour transfer or evaporation loss estimated by Penman equation was not able to account for the actual interception loss at some tropical forests and maritime areas, because the important portion as droplet flux were ignored.
Micro-droplets flux component took major portion in the two heavily rained events, and even completely made up the interception as happened in October 2004. It was an important finding that droplet flux could accommodate a high interception rate, even when the air was nearly vapour-saturated and vapour flux was zero. This proposed approach was tried to answer the difficult question on significantly high interception rates.
The separation ratio fm or fmc was estimated using observed interception data in our study. An effective method to determine the ratio and then to derive interception process without using the observed data has not been established because of limited information and research source. Detailed experiments on droplets size, their pressure or liquid water content, and droplets flux have not been conducted at our study site. This problem or challenge should be targeted in future studies.
REFERENCES
- V. T. Chow, D. R. Maidment and L. W. Mays, “Applied Hydrology,” McGraw-Hill Book Company, New York, 1988.
- R. Burkard, W. Eugster, T. Wrzesinsky and O. Klemm, “Vertical Divergence of Fogwater Fluxes above a Spruce Forest,” Atmospheric Research, Vol. 64, No. 1, 2002, pp. 133-145.
- G. M. Lovett, “Rates and Mechanisms of Cloud Water Deposition to a Subalpine Balsam Fir Forest,” Atmospheric Environment, Vol. 18, No. 9, 1984, pp. 361-371.
- A. P. Dykes, “Rainfall Interception from a Lowland Tropical Rainforest in Brunei,” Journal of Hydrology, Vol. 200, No. 1, 1997, pp. 260-279.
- J. Schellekens, F. N. Scatena, L. A. Bruijnzeel and A. J. Wickel, “Modelling Rainfall Interception by a Lowland Tropical Rain Forest in Northeastern Puerto Rico,” Journal of Hydrology, Vol. 225, No. 3, 1999, pp. 168-184.
- L. Zimmermann, C. Fruhauf and C. Bernhofer, “The Role of Interception in the Water Budget of Spruce Stands in the Eastern Ore Mountains/Germany,” Physics and Chemistry of the Earth (B), Vol. 24, No. 7, 1999, pp. 809-812.
- M. Hashino, H. Yao and H. Yoshida, “Studies and Evaluations on Interception Processes during Rainfall Based on a Tank Model,” Journal of Hydrology, Vol. 255, No. 1, 2002, pp. 1-11.
- S. Murakami, “A Proposal for a New Forest Canopy Interception Mechanism: Splash Droplet Evaporation,” Journal of Hydrology, Vol. 319, No. 1-4, 2005, pp. 72-82.
- R. R. E. Vernimmen, L. A. Bruijnzeel, A. Romdoni and J. Proctor, “Rainfall Interception in Three Contrasting Lowland Rain Forest Types in Central Kalimantan, Indonesia,” Journal of Hydrology, Vol. 340, No. 3-4, 2007, pp. 217-232.
- M. Chang, “Forest Hydrology: An Introduction to Water and Forests,” CRC Press LLC, Boca Raton, 2006.
- Y. Tsukamoto, “Forest Hydrology (in Japanese),” Buneido Press, Tokyo, 1992.
- R. Hall, “Interception Loss as a Function of Rainfall and Forest Types: Stochastic Modelling for Tropical Canopies Revisited,” Journal of Hydrology, Vol. 280, No. 1-4, 2003, pp. 1-12.
- T. Toba and T. Ohta, “An Observational Study of the Factors that Influence Interception Loss in Boreal and Temperate Forests,” Journal of Hydrology, Vol. 313, No. 3-4, 2005, pp. 208-220.