Journal of Water Resource and Protection
Vol. 2 No. 8 (2010) , Article ID: 2454 , 9 pages DOI:10.4236/jwarp.2010.28084
Kinetic Studies for an Aerobic Packed Bed Biofilm Reactor for Treatment of Organic Wastewater with and without Phenol
1Department of Biotechnology, Heritage Institute of Technoloy, Kolkata, India
2Environmental Engineering Division, Civil Engineering Department, Jadavpur University, Kolkata, India
E-mail: sudiptadey_80@yahoo.com
Received June 5, 2010; revised July 5, 2010; accepted July 15, 2010
Keywords: Packed Bed Reactor, Biofilm, Mixed Culture, COD Removal, Phenol, Kinetic Model
ABSTRACT
A laboratory scale aerobic fixed film bioreactor packed with glass beads for biofilm growth was used to evaluate the removal efficiencies of COD and phenol for a carbohydrate—phenol mixture in wastewater. It was done by an indigenous mixed culture inoculums developed after collecting sludge from a return line of an activated sludge plant. The test result on continuous flow in the above biofilm reactor indicated an optimum hydraulic loading range of 4-6.4 m3day-1m-2 for attainment of reasonable amount of COD removal in case of carbohydrate substrate only. The COD removal efficiency, however, gradually depleted from 100% to 54% by gradual increase in organic loading (OLR) from 0.72-4.32 kgday-1m-3, beyond which removal was not significant. For the identical loading conditions, in presence of phenol in the substrate along with carbohydrate, the COD removal was observed varying from 100-40% in the above organic loading range. The COD removal kinetics in presence of phenol also shows a decreasing trend compared to data obtained without the presence of phenol in wastewater that reveals biological inhibition. The experimental data were fitted in a simple plug flow model for evaluating the zero order, first order and Monod form of rate equations to evaluate the kinetics. It was found that Monod type rate equations combining a zero and first order rate expression is the best fit for the above hydraulic and organic loading that gives a best fit half velocity constant value of 35 mgL-1 (R2 = 0.9612).
1. Introduction
Biofilm reactor is a popular method for biological treatment of wastewater to combat high organic strengths owing to enhanced mean cell residence time and economical oxygen supply [1-4]. However, adequate mixing in the biofilm reactor is important to ensure uniform distribution of substrate, sufficient contact between the microorganism and substrate and prevention of localized accumulation of toxic matter. In absence of recirculation, mixing can be achieved to some extent by uniform supply and distribution of oxygen in the reactor. Wastewater emanated from petrochemical, pharmaceutical, coke oven plant etc contains high phenolic compounds along with appreciable amount of COD. COD removal from wastewater can be obtained by either pure culture organism or by mixed culture system. As wastewater from industry contains mixed nature of organic matters and toxic compounds, and the maintenance of pure culture in industry for the treatment process of wastewater is difficult to achieve, so it is advisable to use mixed culture for treatment of wastewater having high COD and phenol concentration.
Phenol biodegradation by pure cultures of bacteria has been described by substrate inhibition models [4-7]. Otherwise, when mixed cultures are used there is no unique kinetic model for general agreement, but phenol is often considered as inhibitory at high concentrations [8-10]. At low substrate concentration, however, the inhibition is negligible; the model proposed by Monod may be used to describe the biodegradation process by either pure or mixed cultures. Furthermore, if the substrate concentration is much lower than the half-velocity constant (K), then a first-order kinetic model often applies.
Wastewater having high concentration of COD and phenolic compounds can be treated mainly by either physico-chemical method e.g. adsorption, chemical coagulation, membrane filtration process or by biological methods such as activated sludge or anaerobic cultures under acclimatized condition. Some researchers consider activated sludge more attractive due to its various advantages [11-13]. Activated sludge reactors have been widely used for COD and phenol removal from industrial wastewater [14-16], but immobilized cell reactors offer several advantages over suspended cell reactors. These include higher biomass concentrations, allowing higher loading rates, and resistance to shock loading of inhibitory compounds, then requiring less time to revert to normal operation. Fixed film reactors are receiving increasing interest in wastewater treatment. Most of the works on fixed bed reactor have been done in anaerobic condition [17-19]. Few works have been done on combined aerobic-anaerobic fixed film reactor system for COD removal. G. R. Moosavi et al. [20] investigated the COD removal for high strength organic wastewater in this reactor and found COD removal efficiency about 95% under organic loading of 0.8-7.6 kg CODm-3day-1. R. Del Pozo and V. Diez [21] have studied the COD removal for organic matter containing wastewater in aerobic-anaerobic packed bed reactor and they found the efficiency to be 92% at organic loading of 0.39 kg COD m-3day-1. They have also found that most COD removal occurred mainly by aerobic process. In another study, Lorenzo Bertin et al. [22] has shown that an aerobic reactor, fed with olive mill effluent from anaerobic GAC reactor, could be a stable process to remove 24% and 39% of organic load under 50.42 and 2.04 gL-1day-1 of COD and phenol loading rates, respectively. In the present work, the activated sludge was collected from a return line of a nearby sewage treatment plant. The microbial consortia was grown on glass beads forming a fixed biofilm and used for further experiment. The main purposes of the present investigation are as follows: 1) To understand the behavior of the reactor under different operating conditions like different hydraulic and organic loading and finding out the optimum operating conditions of it. 2) To find out the change in efficiency of the reactor to treat the carbohydrate containing wastewater in the presence and absence of phenol. 3) To use the experimental data for fitting in the kinetic model for COD removal.
2. Materials and Methods
2.1. Collection of Inoculum
Biomass from a return line of a sewage treatment plant operating as activated sludge process was collected as inoculum for the reactor starting up. The inoculum was first grown as batch mode with nutrient medium in the reactor and air was supplied from the bottom through a mini-compressor. The culture was replenished with fresh substrate medium time to time so that the bacterial culture can get sufficient nutrient for their growth. After 6 weeks of operation, a thin film coating was found to develop on the glass beads, and then the operation was changed to continuous mode. Microorganisms were first grown on easily degradable substrate (up to 1000 mgL-1 COD contributed) and then acclimatized to phenol. Acclimatization of the activated sludge sample grown in the trickle bed reactor was carried out to initiate the ability of the sludge to biodegrade phenol along with other organic matter.
2.2. Nutrient Medium and Culture Condition
The required nutrients for the growth of the microorganisms were supplied by the medium with compositions as follows in 1L of solution: Glucose 0.5 g, peptone 0.2 g, beef extract 0.2 g, Yeast extract 0.2 g, K2HPO4 0.3 g, KH2PO4 0.15 g, NH4Cl 0.2 g, CaCl2 0.1 g, FeCl3 0.1 g, MgCl2 0.1 g. The glucose concentration was varied to vary the inlet COD to the reactor according to need of organic loading variation, while peptone and yeast extract concentration dropped to zero during the study of COD removal performance of the reactor.
2.3. Analytical Procedure
COD was measured by standard closed reflux method in HACH (USA) make reflux apparatus. The sample was oxidized with K2Cr2O7 in a strong acidic condition (H2SO4), followed by titration of the excess dichromate with Mohr salt solution. Phenol was determined by standard 4-amino antipyrene method.
2.4. Experimental Set Up
The experimental set up is shown in Figure 1. The bioreactor was 65 cm high with 2.5 cm internal diameter of cylindrical Borosil make glass column. Glass beads with average 3 mm diameter were used as inert support media for the biofilm growth. There was an in-built perforated support at the bottom to hold the glass beads. The treated water after filtration was taken as the effluent. Inlet and outlet for the wastewater were provided at the top and bottom of the bioreactor, respectively. There were two other sampling ports at 25 cm and 45 cm from the top of the reactor for collecting intermediate samples at times. The synthetic wastewater was prepared with glucose, as concentration ranging from 100-400 mgL-1 by diluting the glucose stock in distilled water along with necessary nutrients in proportionate amount as stated above. The synthetic wastewater was fed to the reactor from an aspirator
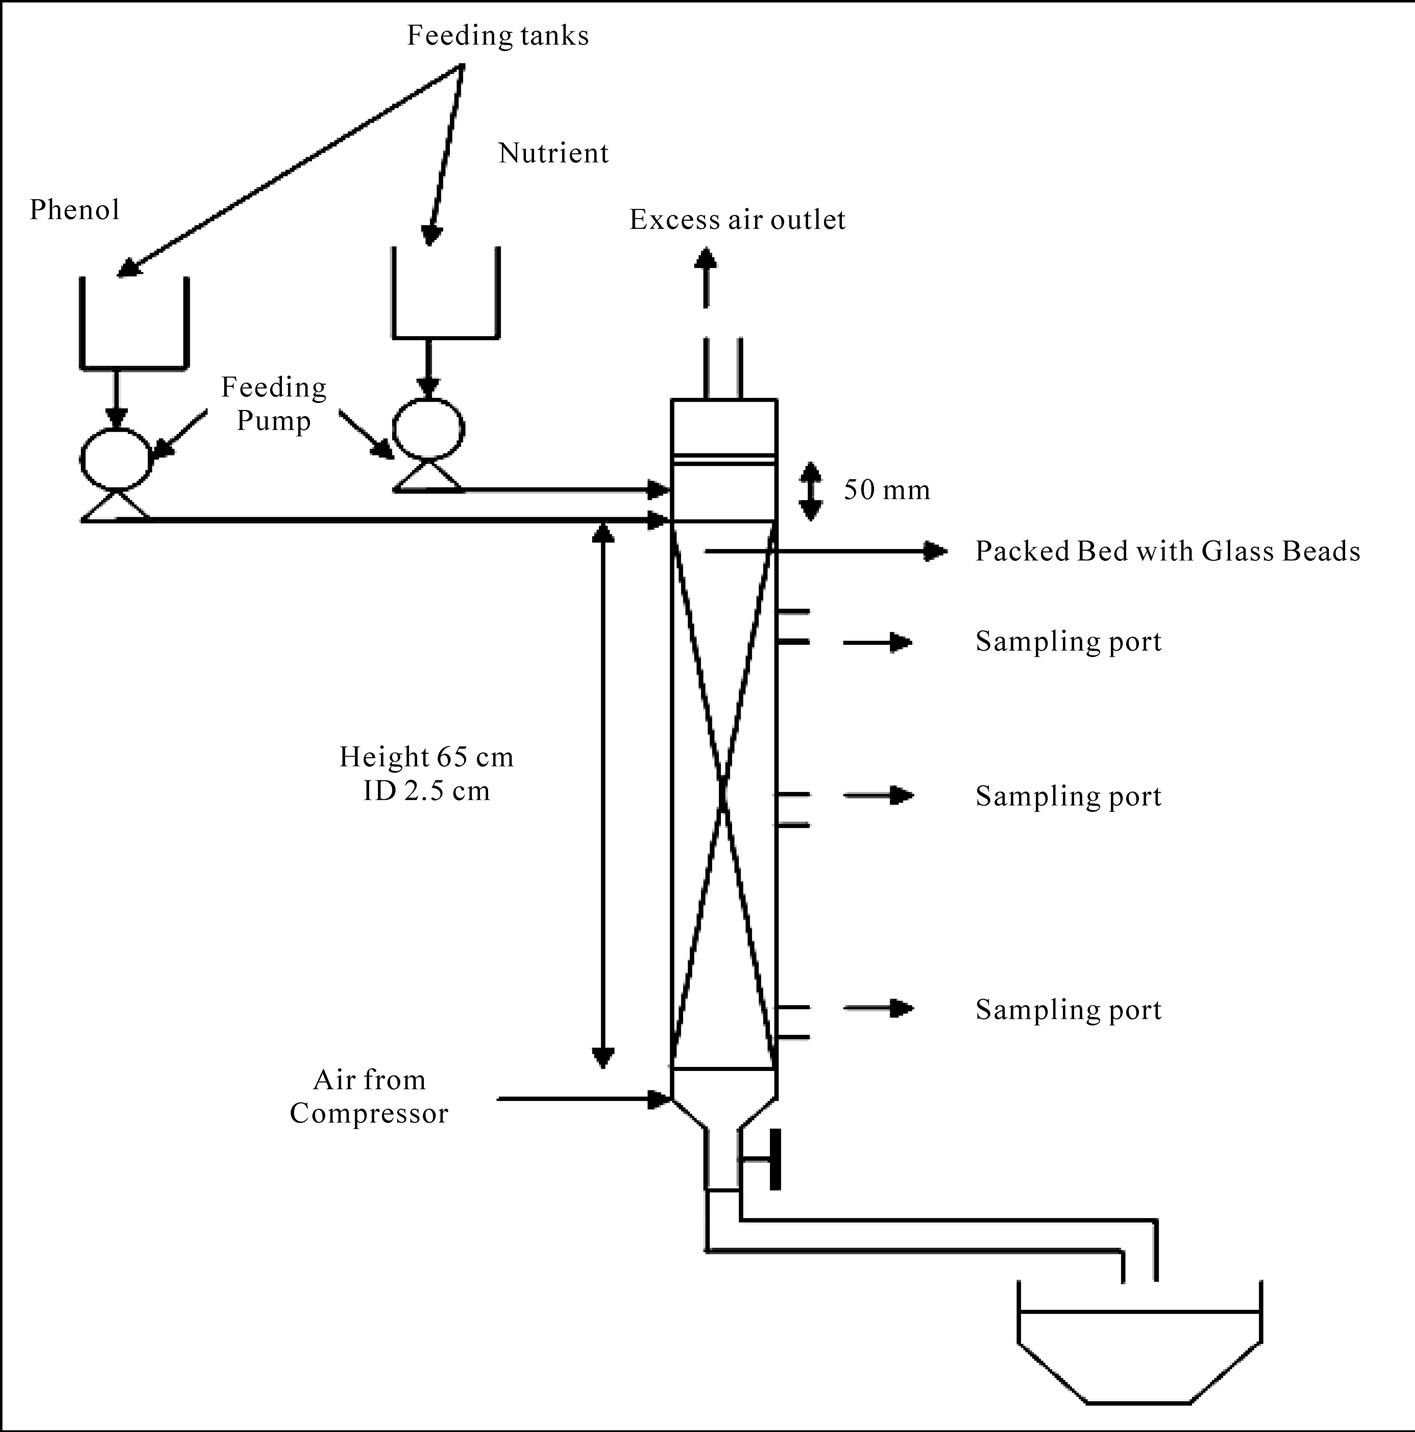
Figure 1. Experimental set up.
bottle in the down-flow mode. The effluent was collected from the bottom outlet of the reactor and filtered to remove the suspended solids. Then the samples are tested for residual COD. All the COD removal studies were done for a single pass of wastewater though the bioreactor without any recirculation. After finding out the optimum hydraulic and organic loading rates for the reactor, 50 mgL-1 phenol was fed to the reactor having glucose as the major carbon source other than phenol in the synthetic wastewater. In these set of experiments, residual COD was tested in the effluent.
2.5. Hydraulic Loading Rates (HLR)
The flow rates of the wastewater fed to the reactor were calculated in order to operate at low hydraulic loading rates. Although there is no general agreement about limits for operating in this regime, but first superficial velocities were selected in such a way that the corresponding hydraulic loadings ranged from 4.27-9.96 m3m-2day-1. The reactor performances in steady state conditions were evaluated at four hydraulic loading rates: 4.27, 6.4, 7.11 and 9.96 m3m-2day-1.
2.6. Organic Loading Rates (OLR)
For each of the hydraulic loading rates, initially, the bioreactor was fed with synthetic wastewater containing carbohydrate without phenol at different organic loadings. Total COD of the influent for each run is measured. The inlet COD concentrations range were 100-400 mgL-1 corresponding to organic loading rate varying from 0.72-4.8 Kgm-3day-1. Percentage removal of COD at each HLR and OLR were determined. The COD removal performances of the reactor at the optimum HLR were also examined for treatment of wastewater having 50 mgL-1 of phenol along with glucose as organic matter. The concentration of glucose in the influent wastewater was varied in such a way that the total organic loading fell within the range of OLR stated above even in presence of phenol in inlet wastewater.
3. Results and Discussion
3.1. Effect of Hydraulic Loading Rates on Organic Removal Efficiency
Figure 2 shows that the percentage COD removal vs. hydraulic loading at different organic loadings. It is seen from the above figure that for a particular HLR, the removal efficiency decreases as OLR increases. Organic matter was well degraded almost 100% corresponding to the hydraulic loading of 4.27 m3m-2day-1 and organic loading of 0.72-1.44 Kgm-3day-1. At OLR of 2.037 Kg m-3day-1, the percentage COD removal was 88.33, but a further increase in OLR, a sharp descend of COD removal to 60% is observed for the HLR at 4.27 m3m-2day-1. Further, when HLR is increased to 6.4 m3m-2day-1, then also 100% COD removal is achieved at OLR of 1.08 Kg m-3day-1. The COD removal was decreased to 83% when the applied OLR was doubled at 2.16 Kgm-3day-1, keeping the HLR constant at 6.4 m3m-2day-1. While studying the performance of the reactor at higher HLR i.e. at 7.11 m3m-2day-1, 100% removal was possible to achieve only up to an OLR of 1.2 Kgm-3day-1, beyond that, a further increase in OLR to 2.4 Kgm-3day-1, the percent removal was declined significantly to 66.5%. An Increase of HLR up to a value of 9.96 m3m-2day-1 exhibited poor removal efficiency.
3.2. Optimum Operating Range of Bioreactor
From the reactor performance data as given in Table 1, and shown in Figure 2, it is evident that the optimum
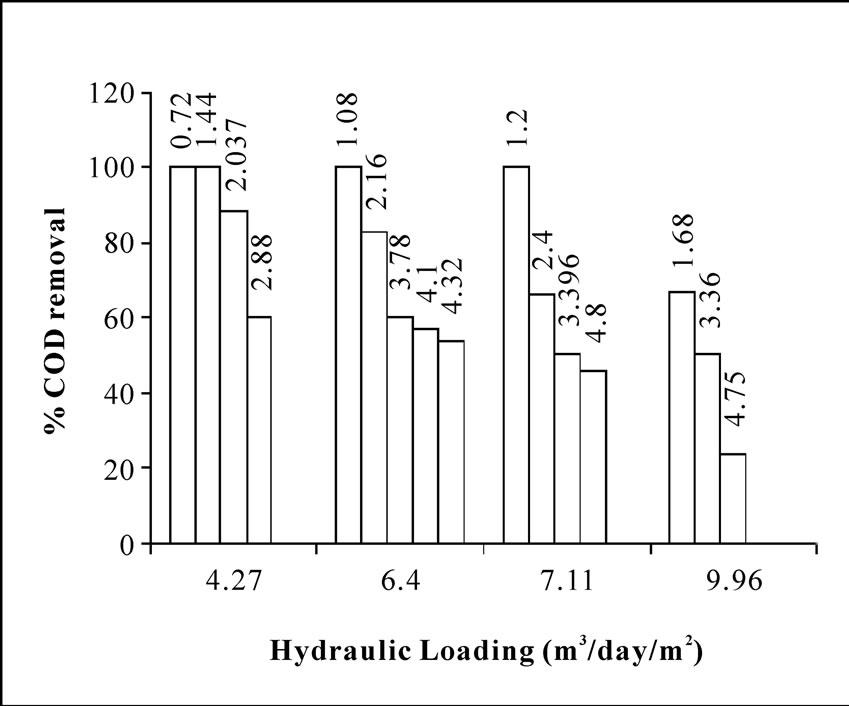
Figure 2. Percentage COD removal from wastewater containing organics (no phenol) versus hydraulic loading at different organic loading (noted at the top of each bar).
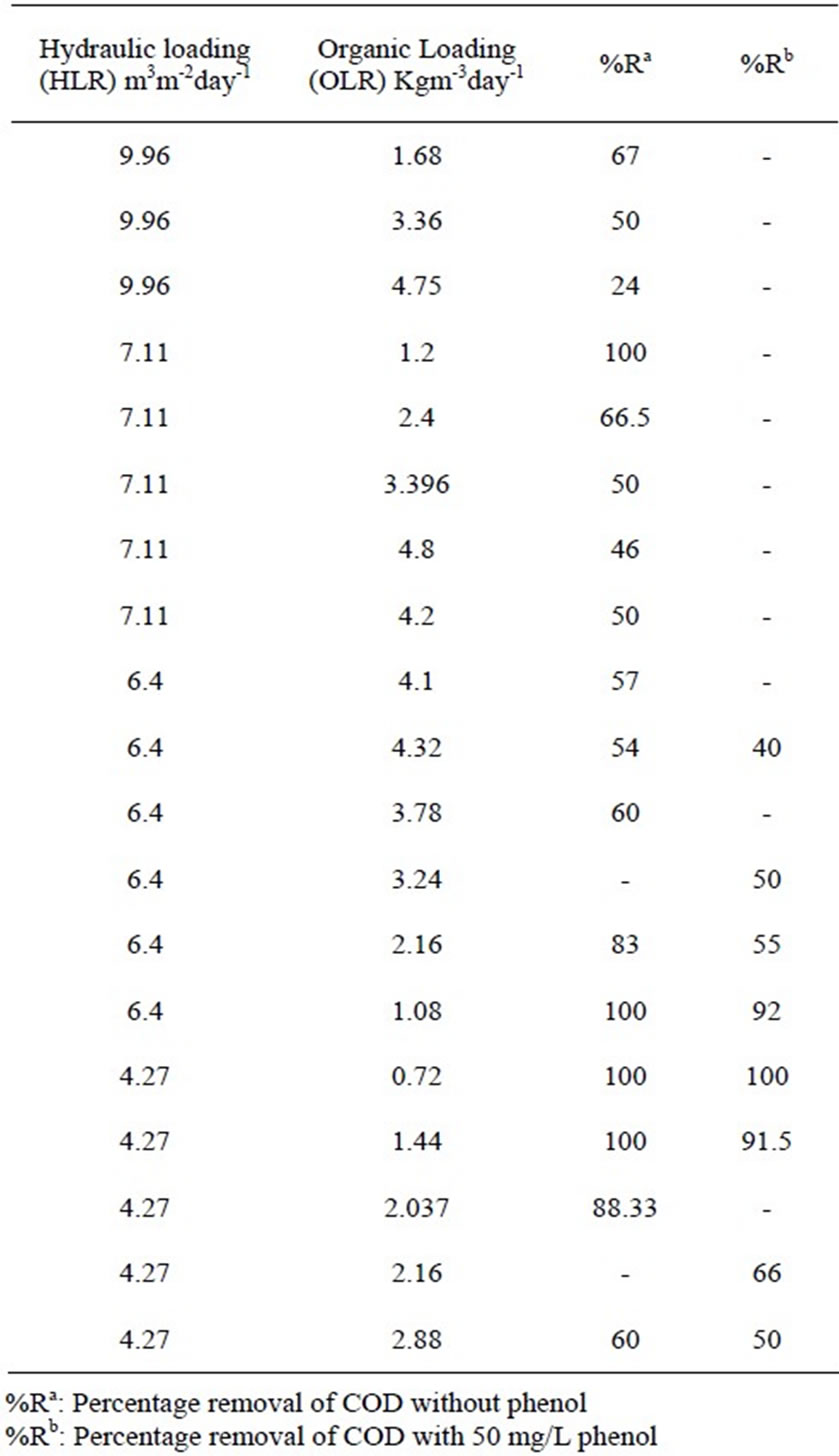
Table 1. Rector performance a different HLR an OLR with and without phenol condition.
range of HLR for the bioreactor should be between 4-6.4 m3m-2day-1 and the optimum OLR up to 4.32 Kgm-3day-1. It was also observed that the COD removal efficiency shows a range from 100-54% at the above corresponding HLR range for the organic loading 0.72-4.32 Kgm-3day1 as shown in Figure 2. G. R. Moosavi et al. [20] have tested an upflow anaerobic/aerobic packed bed reactor for COD removal studies. They have operated their reactor with volumetic flow rate of 1.26 Lday-1 and under organic loading rates of 0.8-7.6 Kgm-3day-1. They have found that under the tested organic loading rates, the aerobic section of the reactor could remove COD in the range of 38-92%. It was also shown by their study that 92% COD removal was achieved at organic loading rate of 4.7 Kg m-3day-1. Their result of COD removal agrees well with our present experimental studies under similar range of operating condition.
3.3. Effect of Phenol on Organic Removal Rate
Phenol was found to possess a marginal inhibitory effect on the organic matter biodegradation in the reactor corresponding to a concentration of 50 mgL-1 of phenol. From Figure 3 and Figure 4 it is evident that in presence of phenol, the total COD removal efficiency showed a decreasing trend than treating the wastewater without phenol. The percentage removal of COD ranged from 100-54%, in case of without phenol in the inlet wastewater. The range was marginally fallen to 100-40% in presence of phenol along with other organic substrates at optimum hydraulic and organic loading range and under same operational conditions as stated above. The comparative performance was listed in Table 1. Studies have been done by Lorenzo Bertin et al. [22] for real life olive mill effluent. They have found that post treatment of that effluent (coming out from reactor packed with granular activated carbon) by aerobic packed bed reactor showed only 24% and 39% COD and phenol removal respectively, when charged the reactor with 50.42 ± 4.78 gL-1 day-1 of COD loading and 2.04 ± 0.27 gL-1day-1 of phenol loading rate. Here percentage COD removal is far less compared to the result obtained in present study. This is because of the fact that both COD and phenol concentrations were sufficiently high in olive mill effluent than that tested in our study.
3.4. Kinetic Model
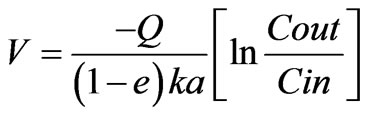
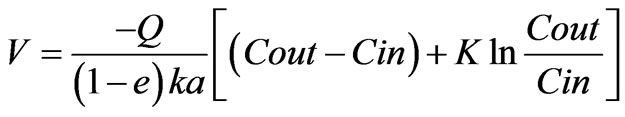
A simple kinetic model to represent the biodegradation behavior obtained in the laboratory was used to understand the reaction rate. The major independent variables in the process were the flow rate (Q), inlet concentration of organic matter in terms of COD (Cin), Outlet COD concentration of the stream (Cout). Assuming there was no growth during the experiment and no diffusion resistance within the biofilm, the usual plug flow model could be used as proposed by [23],
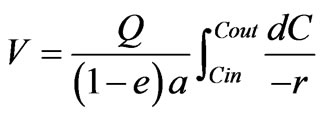 (1)
(1)
where V is the packing bed volume, “a” is the dry weight of biomass per volume of packing, “e” is the void fraction, and apparent reaction rate term r can be defined as r = COD removed time-1 biomass-1.
Assuming zero order kinetics, where r = k, k is a constant and r is independent of C, then Equation (1) can be easily integrated to give a well known linear relationship between Cin and Cout with slope 1.00 as follows:
 (2)
(2)
The experimental data were plotted assuming zero order kinetics in Figure 5, showing not suitable for present
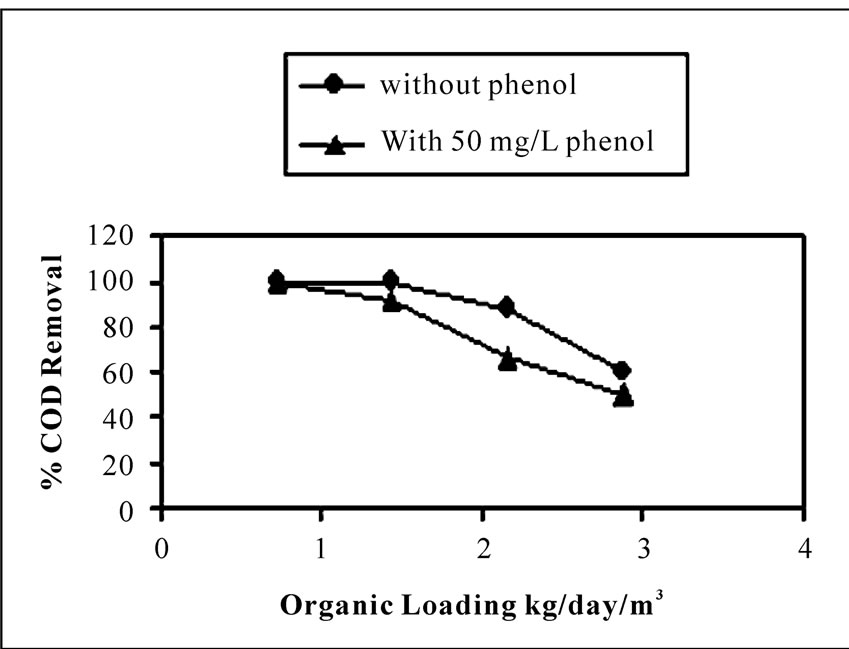
Figure 3. Comparison of percentage COD removal from wastewater containing only carbohydrate (without phenol) and carbohydrate in presence of phenol, against different organic loadings at 4.27 m3day-1m-2 hydraulic loading rate.
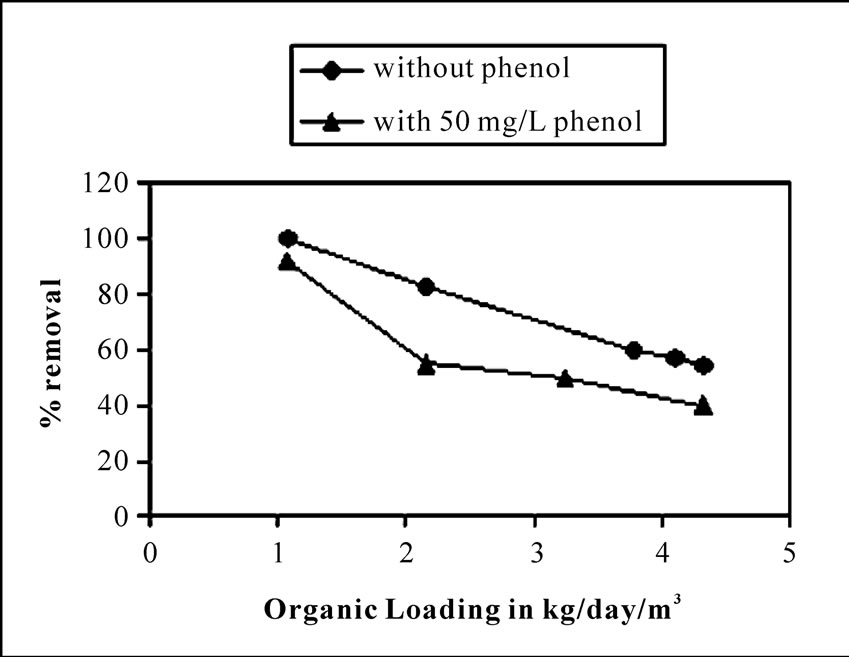
Figure 4. Comparison of percentage COD removal from wastewater containing only carbohydrate (without phenol) and carbohydrate in presence of phenol, against different organic loadings at 6.4 m3day-1m-2 hydraulic loading rate.
experiment as slope of the straight line far away from 1.00.
If the fist order kinetics is assumed where, r = kC, then we obtain,
 (3)
(3)
This can be written as
 (4)
(4)
Here a linear relationship between Q ln Cin and Q ln Cout is expected. Assuming first order kinetics, experimental data plotted in Figure 6. But the experimental data were not fitted well to this model following a R2 value of 0.7779.
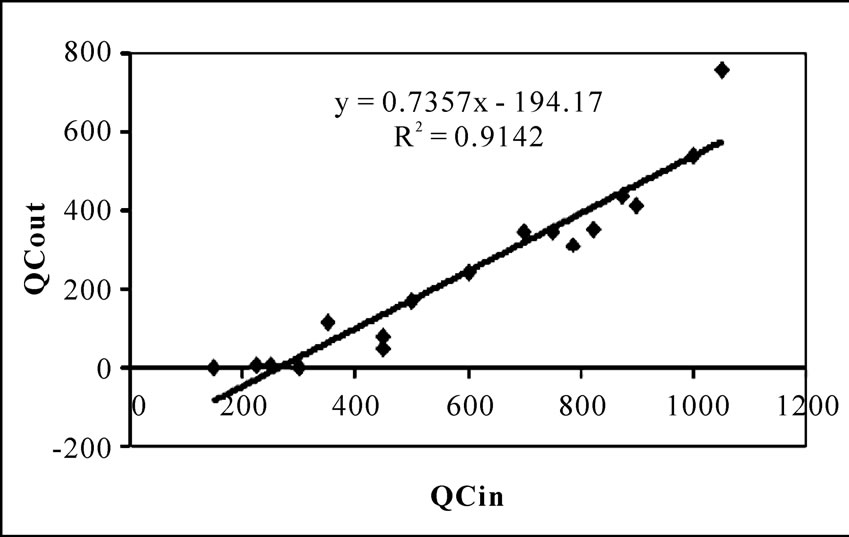
Figure 5. Zero order model for the bioreactor performance.
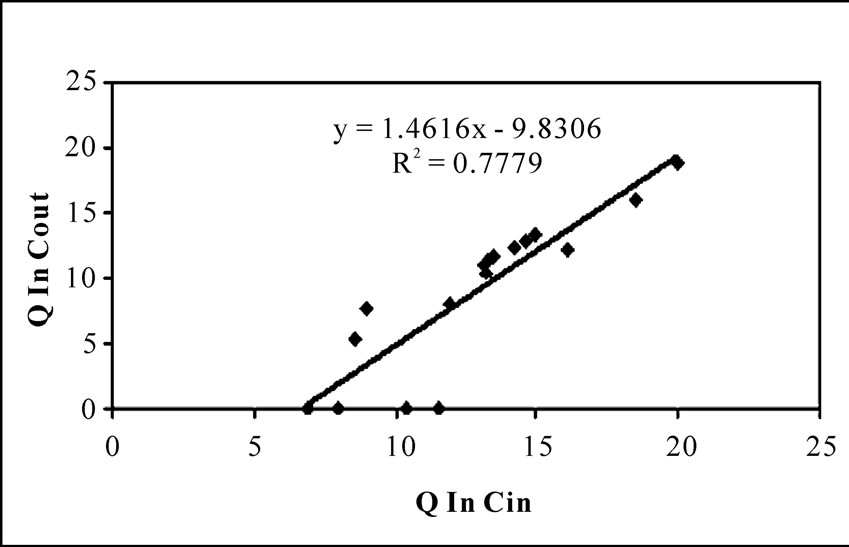
Figure 6. First order model for the bioreactor performance.
However, the Monod form of rate equation combining the zero order and first order rate expression has been chosen, which seems to be more powerful and realistic expression for removal kinetics has the form
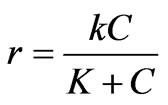
where k is reaction rate constant with unit (time-1. concentration–1) and K is the half saturation constant having the same unit of COD concentration.
Putting this expression to Equation (1) we get,
 (5)
(5)
This can be rewritten as
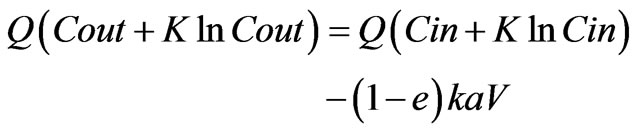 (6)
(6)
In this form, the data can be linearized for a suitable K and plotting each Q (C + K ln C) term on linear paper. The best fit value of K is that gives best fit straight line (by maximizing the coefficient of determination R2). Clearly the slope of the straight line plotted as Q (Cout + KlnCout) vs. Q (Cin + Kln Cin) is expected to be unity and intercept to be negative.
The same experimental data were tested for Equation (6) assuming different K values. Different K values and corresponding values of slope and coefficient of determination are listed in Table 2. Comparing the goodness of fit of the present data in Equation (6) with different K values, it was established that the rate equation described in Monod type form is most suitable for the present study. The half velocity constant values (K) are found between 25-35 mgL-1 for satisfying both of the conditions of values of slope and high value of R2 (Figure 7, Table 2). But the study done by Tomás Wilson et al [24] shown that phenol biodegradation by mixed culture had followed zero order kinetics at 50 mgL-1 phenol concentration under batch mode. The difference in order of kinetics of that result with the present study may be due to the fact that they have studied the phenol degradation under high salt concentration (10% W/V NaCl) and by halophilic bacteria. But the culture for the present study was collected from activated sludge unit of coke oven plant and does not contain any halophilic bacteria. In another study by Gerrard et al. [23] for kinetic modeling of phenol removal by packed bed, it has been reported that mixed culture follow neither zero order nor first order kinetics for phenol biodegradation. This result agrees with our observation. They have shown that using a cocoa-fiber packing in the bioreactor, microorganisms follow Monod type reaction kinetics quite well with K value 100 gm-3 with phenol concentration upto 350 mgL-1. But the goodness of fit increased when the kinetics was fitted to substrate inhibition model. If the present study is compared with that result, it can be stated that present study does not require the necessity of fitting the kinetics in substrate inhibition model. Because it is already established in this work that phenol had marginal inhibitory effect on COD removal from organic waste.
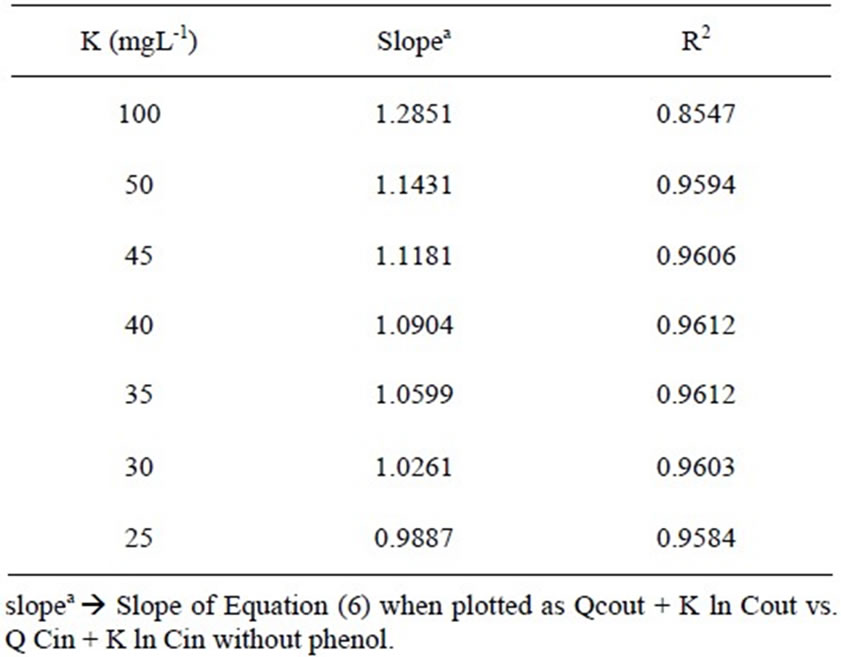
Table 2. Value of half saturation constant (K in mg/L) and corresponding value of slope and value of coefficient of determination R2 for expression of the reaction rate equation in the form of Monod model.
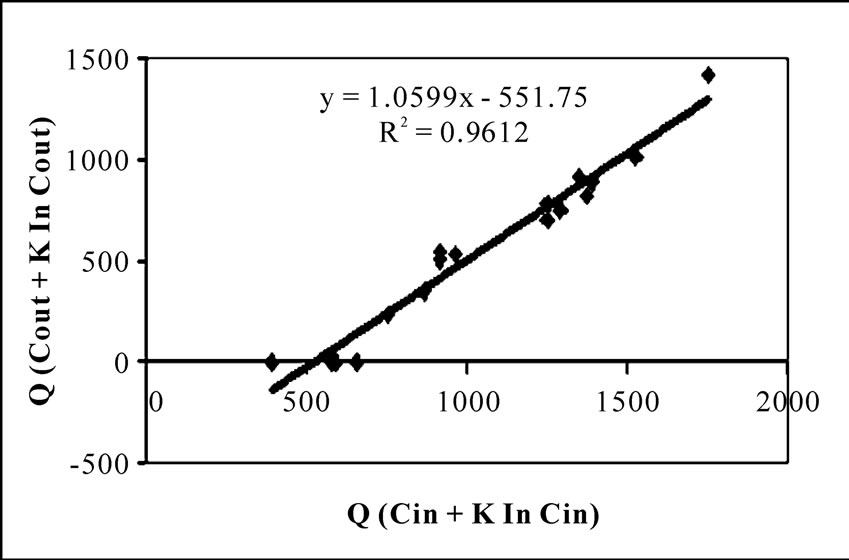
Figure 7. Monod type model for the bioreactor performance with K = 35 mg/L.
This is obvious because the concentration of phenol used in the influent synthetic wastewater was only 50 mgL-1. So, fitting the kinetics in Monod type reaction rate model is quite justified. The K value obtained in our study slightly differs from that obtained by Gerrard et al. [23] due to different reasons. Probably their mixed culture consortium contained different microorganisms than that being studied in present investigation. It should also be noted that Gerrard et al. have studied the biodegradation of phenol only, where as, present study deals with COD removal in presence of glucose and phenol as the duel carbon sources in the wastewater where both of these organics contribute to COD value.
4. Conclusions
A packed bed bioreactor has been studied for its COD removal efficiency from wastewater. The reactor is packed with glass beads that are covered by biofilm generated by the growth of indigenous mixed microbial culture. The biodegradation efficiency is measured in terms of percentage COD removal from wastewater. The optimum hydraulic and organic loading rates of the bioreactor are found to be in the range of 4-6.4 m3day-1m-2 and upto 4.32 kgday-1m-3, respectively. Under this range of operating conditions, the COD removal varied between 100-54%. The performance of the bioreactor decreased marginally under 50 mgL-1 phenol charging along with other carbohydrate in the influent wastewater. A mathematical model accounting for reaction kinetics, hydraulic and organic loading rates, is used to describe the steadystate biodegradation of organic matter in presence and absence of phenol, for the bioreactor. In spite of many simplification assumptions made in the mathematical model, our experimental data fits to that model quite satisfactorily. It has been also observed that the rate of biodegradation by the mixed microbial culture in the biofilm followed Monod type rate equation combining a first order and zero order rate expression. By fitting data in the model, half saturation constant value for biodegradation is calculated to be in the range of 25-35 mgL-1.
REFERENCES
- M. Sagy and Y. Kott, “Efficiency of Rotating Biological Contactor in Removing Pathogenic Bacteria from Domestic Sewage,” Water Research, Vol. 24, No. 9, 1990, pp. 1125-1128.
- M. Henze and P. Harremoes “Anaerobic Treatment of Wastewater in Fixed Film Reactors—A Literature Review,” Water Science Technology, Vol. 15, No. 8-9, 1983, pp. 1-101.
- M. G. S. Yap, W. J. Ng and H. Chua, “Performance of an Anaerobic Biofilter for 2-Ethylhexanoic Acid Degradation,” Bioresource Technology, Vol. 41, No. 1, 1991, pp. 45-51.
- A. M. G. Monteiro, R. Boaventura and A. Rodrigues, “Phenol Biodegradation by Pseudomonas Putida DSM 548 in a Batch Reactor,” Biochemical Engineering Journal, Vol. 6, No. 1, 2000, pp. 45-49.
- A. Kumar, S. Kumar and S. Kumar, “Biodegradation kinetics of Phenol and Catechol Using Psedomonas Putida MTCC 1194,” Biochemical Engineering Journal, Vol. 22, No. 2, 2005, pp. 151-159.
- M. Maeda, A. Itoh and Y. Kawasw, “Kinetics for Aerobic Biological Treatment of O-Cresol Containing Wastewaters in a Slurry Bioreactor: Biodegradation by Utilizing Waste Activated Sludge,” Biochemical Engineering Journal, Vol. 22, No. 2, 2005, pp. 97-103.
- C. S. A. Sa and R. Boaventura, “Biodegradation of Phenol by Pseudomonas Putida DSM 548 in a Trickling Bed Reactor,” Biochemical Engineering Journal, Vol. 9, No. 3, 2001, pp. 211-219.
- P. Kumaran and Y. L. Paruchuri, “Kinetics of Phenol Biotransformation,” Water Research, Vol. 31, No. 1, 1977, pp. 11-22.
- M. Schroder, C. Miller, C. Posten, W. D. Deckwer and V. Hechit, “Inhibition Kinetics of Phenol Degradation from Unstable Steady-State Data,” Biotechnology Bioengineering, Vol. 54, No. 6, 1997, pp. 567-576.
- K. Bandyopadhyay, D. Das and B. R. Maiti, “Kinetics of Phenol Degradation Using Psuedomonas Putida MTCC 1194,” Bioprocess Engineering, Vol. 18, No. 5, 1998, pp. 372-377.
- N. T. Joshi and S. F. D’Souza, “Immobilization of Activated Sludge for the Degradation of Phenol,” Journal of Environmental Health (A), Vol. 34, No. 9, 1990, pp. 689-700.
- J. S. Melo, S. Kholi, A. W. Patrawardhan and S. F. D’Souza, “Effect of Oxygen Transfer Limitations in Phenol Biodegradation,” Process Biochemistry, Vol. 40, No. 2, 2005, pp. 625-628.
- D. J. Richards and W. K. Shieh, “Biological Fate of Organic Priority Pollutants in the Aquatic Environment,” Water Research, Vol. 20, No. 9, 1986, pp. 1077-1090.
- I. Talinli and A. Farag, “Enhanced Removal of Phenol and M-Cresol in PAC Additional Activated Sludge System,” Environmental Technology, Vol. 15, No. 12, 1994, pp. 1121-1134.
- C. A. Papadimitriou, X. Dabou, P. Samaras and G. P. Sakellaropoulos, “Coke Oven Wastewater Treatment by Two Activated Sludge Systems,” Global NEST Journal, Vol. 8, No. 1, 2006, pp. 16-22.
- H. Movahedyan, H. Khorsandi, R. Salehi and M. Nikaeen, “Detection of Phenol Degrading Bacteria and Pseudomonas Putida in Activated Sludge by Polymerase Chain Reaction,” Iran Journal of Environmental Health Science and Engineering, Vol. 6, No. 2, 2009, pp. 115-120.
- G. Srinivasan, R. Subramaniam and N. Kumar, “Kinetic Evaluation of Fixed Film Fixed Bed Anaerobic Reactor by Using Dairy Wastewater,” American-Eurasian Journal of Scientific Research, Vol. 4, No. 3, 2009, pp. 213- 218.
- K. J. Kennedy and R. L. Droste, “Startup of Anaerobic Downflow Stationary Fixed Film (DSFF) Reactors,” Biotechnology Bioengineering, Vol. 27, No. 8, 2004, pp. 1152-1165.
- R. Ganesh, R. Rajinikanth, J. V. Thanikal, R. A. Ramanujam and M. Torrijos, “Anaerobic Treatment of Winery Wastewater in Fixed Bed Reactors,” Bioprocess Biosystems Engineering, Vol. 33, No. 5, 2010, pp. 619-628.
- G. R. Moosavi, A. R. Mesdaghinia, K. Naddafi, A. H Mahvi and J. Nouri, “Feasibility of Development and Application of an Up-Flow Anaerobic/Aerobic Fixed Bed Combined Reactor to Treat High Strength Wastewaters,” Journal of Applied Science, Vol. 5, No. 1, 2005, pp. 169- 171.
- R. D. Pozo and V. Diez, “Organic Matter Removal in Combined Anaerobic–Aerobic Fixed-Film Bioreactors,” Water Research, Vol. 37, No. 15, 2003, pp. 3561-3568.
- L. Bertin, M. C. Colao, M. Ruzzi, L. Marchetti and F. Fava, “Performances and Microbial Features of an Aerobic Packed Bed Biofilm Reactor Developed to Post Treat an Olive Mill Effluent from an Aerobic GAC Reactor,” Microbial Cell Factories, Vol. 5, No. 16, 2006.
- A. M. Gerrard, J. Kostečková, J. Páca, M. Stiborová and C. R. Soccol, “Simple Models for the Continuous Aerobic Biodegradation of Phenol in a Packed Bed Reactor,” Brazilian Achieves of Biology and Technology, Vol. 49, No. 4, 2006, pp. 669-676.
- T. Wilson and D. R. Yonge, “Kinetics of Phenol Biodegradation in High Salt Solutions,” Water Research, Vol. 36, No. 19, 2002, pp. 4811-4820.
List of Symbols
C Kgm-3 COD concentration
Cin Kgm-3 COD concentration at reactor inlet
Cout Kgm-3 COD concentration at reactor outlet
Q m3s-1 Volumetric flow rate of wastewater
V m3 Packed Bed Volume
e - Void fraction in packed bed
a Kgm-3 Dry weight of biomass/volume of packing
r s-1 COD removed time -1biomass concentration-1
k s-1(zero order) Rate constant of reaction Kgm-3s-1 (first order)
K Kgm-3 Half velocity constant