Journal of Water Resource and Protection
Vol. 2 No. 7 (2010) , Article ID: 2239 , 7 pages DOI:10.4236/jwarp.2010.27074
Photocatalysis of Naphthenic Acids in Water
1College of Agricultural Engineering and Post Harvest Technology, Central Agricultural University, Ranipool, Gangtok, Sikkim, India
2College of Engineering, University of Saskatchewan, Saskatoon, Canada
3Environmental Systems Engineering, University of Regina, Regina, Canada
4Water Science and Technology Directorate, Environment Canada, Saskatoon, Canada
E-mail: s.mishra@usask.ca
Received April 23, 2010; revised May 24, 2010; accepted May 30, 2010
Keywords: Photocatalysis, Naphthenic Acids, Treatment, Kinetics, Toxicity
ABSTRACT
Naphthenic acids (NAs) are soluble in water and are concentrated in oil sand process water (OSPW) as a result of caustic oil sands extraction processes. Significant environmental and regulatory attention has been focused on the naphthenic acids. A laboratory scale photocatalysis system was developed using UV254 florescent lamps. Experiments were conducted to determine the NA degradation efficiency of this system in presence of TiO2 catalyst. Degradation kinetics for total NAs as well as individual z-families was calculated. The developed treatment system was able to degrade OSPW NAs with half life values ranging between 1.55 and 4.80 h. This system also completely reduced the acute toxicity associated with NAs (up to 5 min. IC50 v/v > 90%) based on Microtox assays.
1. Introduction
Naphthenic acids (NAs) are natural constituents of bitumen and the oxidative product of petroleum hydrocarbons. NAs are solubilized and concentrated in oil sand process water (OSPW) during oil sands extraction and enter surface and subsequently ground water systems through mixing and/or erosion of riverbank adjacent to oil sands deposits [1]. Clemente et al. [2] reported that OSPW in the Athabasca Oil Sands (AOS) north of Fort McMurray (Alberta, Canada) may contain NAs as high as 110mg/L. NA contaminated water can cause gastrointestinal disturbances, effects on the formation of blood platelets, cell proliferation, and respiration [3].
In addition to contributing to OSPW toxicity, NAs cause corrosion in the oil sands refining processes. Most natural NAs occur in their sulfide form, mainly responsible for corrosivity. Availability of carboxylic groups in the NA structure to react with metal ions contributes to this property [4] and also determines the extent of corrosiveness [2]. Corrosion due to NAs is a major concern for petroleum refineries, which limits the choice of materials used in equipment and supply chain.
To address these concerns, many methods have been reported to date, having potential to be used for treating water contaminated with naphthenic acids, including: chemical [5,6], bio-remediation [1,7-11], and photolysis/ photocatalysis treatment [12-14]. These processes, in their present forms, invariably use expensive chemicals, require long retention times, and have large annual operating costs. Among all these treatment methods cited above, photocatalysis, with all its variations and improvements, is considered to bring a revolutionary approach to address the current environmental problems. In this regard, McMartin [12,13] reported that photolysis in presence of sunlight is effective for selective degradation of NAs. Application of UV radiation increased the NAs degradation rate. Photolysis not only degrades NAs, but can also increase their bioavailability. Headley et al. [14] reported that photodegradation of NAs on TiO2 surface is efficient under natural sunlight. Further research is necessary to modify this treatment method for better environmental adaptability.
Photocatalysis in presence of UV light and a catalyst have not been reported for either degradation or increased bioavailability of NAs. To study this potential remediation method, a laboratory scale photocatalysis system is described in the work reported herein. The ability of the system to degrade NAs and reduce toxicity was evaluated. The main objectives of this research were to develop and evaluate a laboratory scale photocatalysis system for the treatment of naphthenic acids in water and to conduct feasibility study for degradation and detoxification of naphthenic acid mixtures in water.
2. Materials and Methods
2.1. Experimental Design and Setup
A photocatalysis system (Figure 1) was designed using UV fluorescent tubes (Philips Ltd., Saskatoon, SK, 8W) and concentric shell water jacketed quartz photo cells. This double-jacketed quartz reactor for photocatalysis was fabricated at the scientific glass blowing facility at the University of Victoria, BC, Canada. Cooling water was circulated through the outer shell to reduce heating load due to the UV source.
Three variables, NAs, water and TiO2, were chosen based on 1 × 2 × 2 × 2 full factorial design with one treatment method, two types of NAs, two water sources, and two TiO2 conditions. Both Fluka and OSPW NAs were used; deionized (Milli-Q) water and water from South Saskatchewan River at Saskatoon, SK, were tested in the presence as well as absence of particulate TiO2
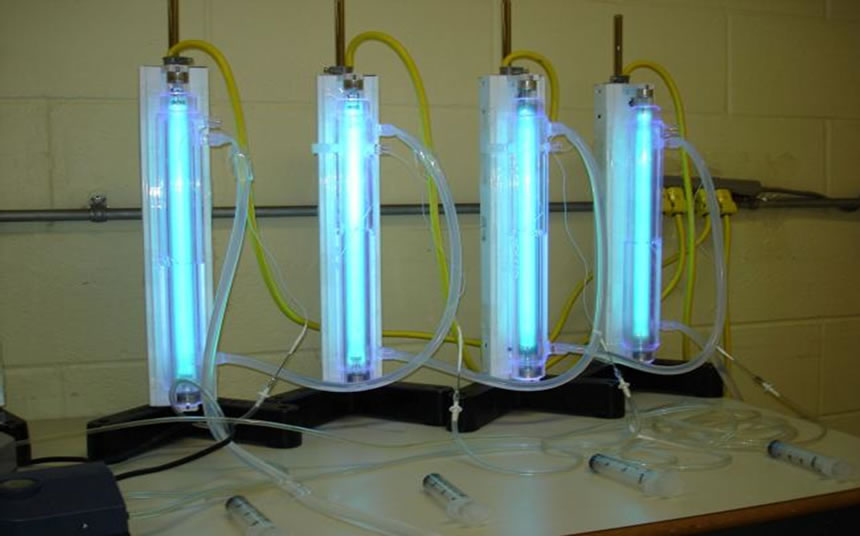
Figure 1. Photocatalysis setup with UV lamps.
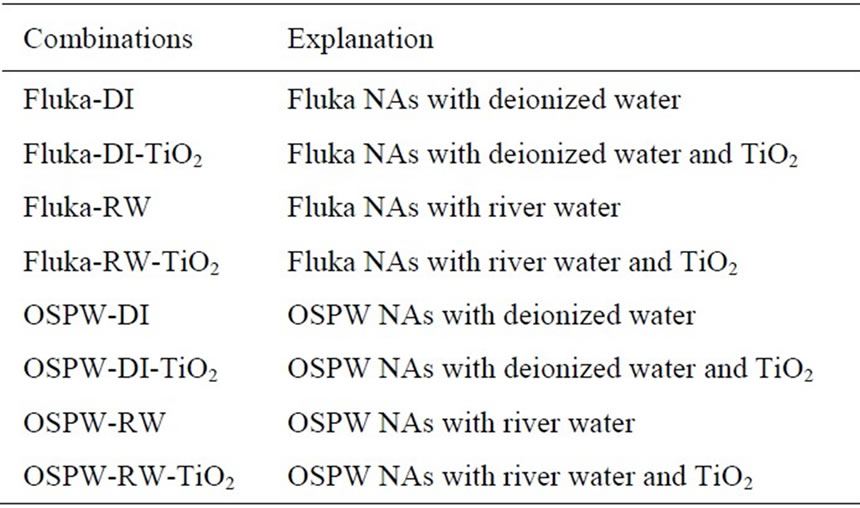
Table 1. Photocatalysis experiment combinations.
catalyst with a concentration of 0.3 g/L. Therefore, eight treatment combinations for the treatment system were tested (Table 1). Four initial concentrations (40, 60, 80, and 100 ppm) were evaluated in triplicate. Samples were collected every 30 min. for 5 h.
2.2. Extraction of OSPW Naphthenic Acids
OSPW was collected from an oil sands extraction operation (Fort McMurray, AB, Canada) to produce the authentic NAs mixture. The NAs were extracted from OSPW using an adapted liquid-liquid extraction method described by Janfada et al. [15]. The final concentration of the NAs extract was determined by serial dilution and comparison to an aliquot of the oil sands NA extract produced by Rogers et al. [16] and was found to be 6,800 mg/L. A five-point linear regression curve was created for quantification of the NA extract used herein and further verified by integrated area comparison of LC-MS results for both the OSPW NAs extract and those for the commercially available Fluka NAs. The two methods were correlated confirming the OSPW NAs extract concentrations. OSPW NAs solutions were prepared by the dilution method (Table 2).
2.3. Sample Preparation
Commercially available Fluka NAs (Sigma-Aldrich, Oakville, ON) and an authentic OSPW NA extract were used in experiments to determine degradation kinetics of NAs in water with or without TiO2 catalyst under UV254. A 4000 ppm stock solution of NAs was prepared in methanol to produce desired concentrations for experimentation (Table 2). For environmental relevance, samples were prepared at concentrations ranging between 40 and 100 ppm at 20 ppm intervals.
2.4. Quantification and Analysis of NAs
Electrospray ionization mass spectrometry (ESI-MS) in negative mode was used to quantify and characterize naphthenic acid concentration in the samples using method described by Headley et al. [17]. This method allowed for a detection limit of 0.01 mg/L [12,17,18].
Kinetic analysis of the degradation of NAs in water was done considering a pseudo first order reaction
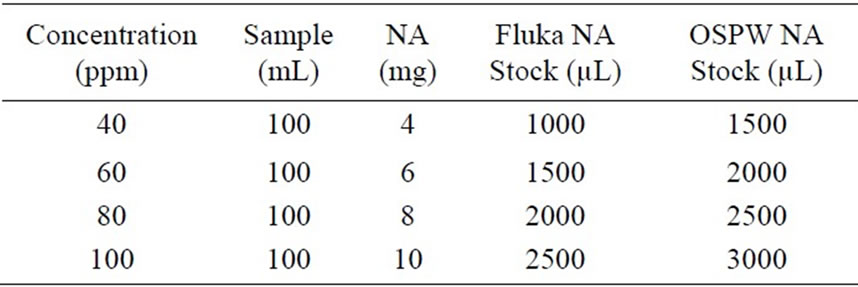
Table 2. Sample preparation with naphthenic acids.
mechanism [12,13], with the rate constant and the halflife period calculated by Integrated Rate Law.
SPSS 14.0 for Windows (SPSS Inc., Chicago, IL) was used to analyze data statistically. Error bars were plotted for each treatment. SPSS was also used to perform univariate analysis of variance (ANOVA) and Tukey’s HSD test. Tukey’s HSD test examines all pair wise comparisons among means. ANOVA was performed to analyze treatment means and Tukey’s HSD test was done to compare the treatment means.
Toxicity of the samples before and after treatment was determined using Microtox assay at ALS Labs (Saskatoon, SK). Microtox Analyzer (Model #500, Strategic Diagnostics Inc., Newark, DE) with test organism Vibrio fischeri was used following the reference method proposed by Environment Canada (ERS1/RM/24). IC50 value (max 100%), the half maximal (50%) inhibitory concentration (IC) of a substance, was measured at residence times of 5, 15 and 30 mins. for each of the sample before and after treatment.
3. Results and Discussion
The NA standards were analyzed at room temperature
 (a)
(a)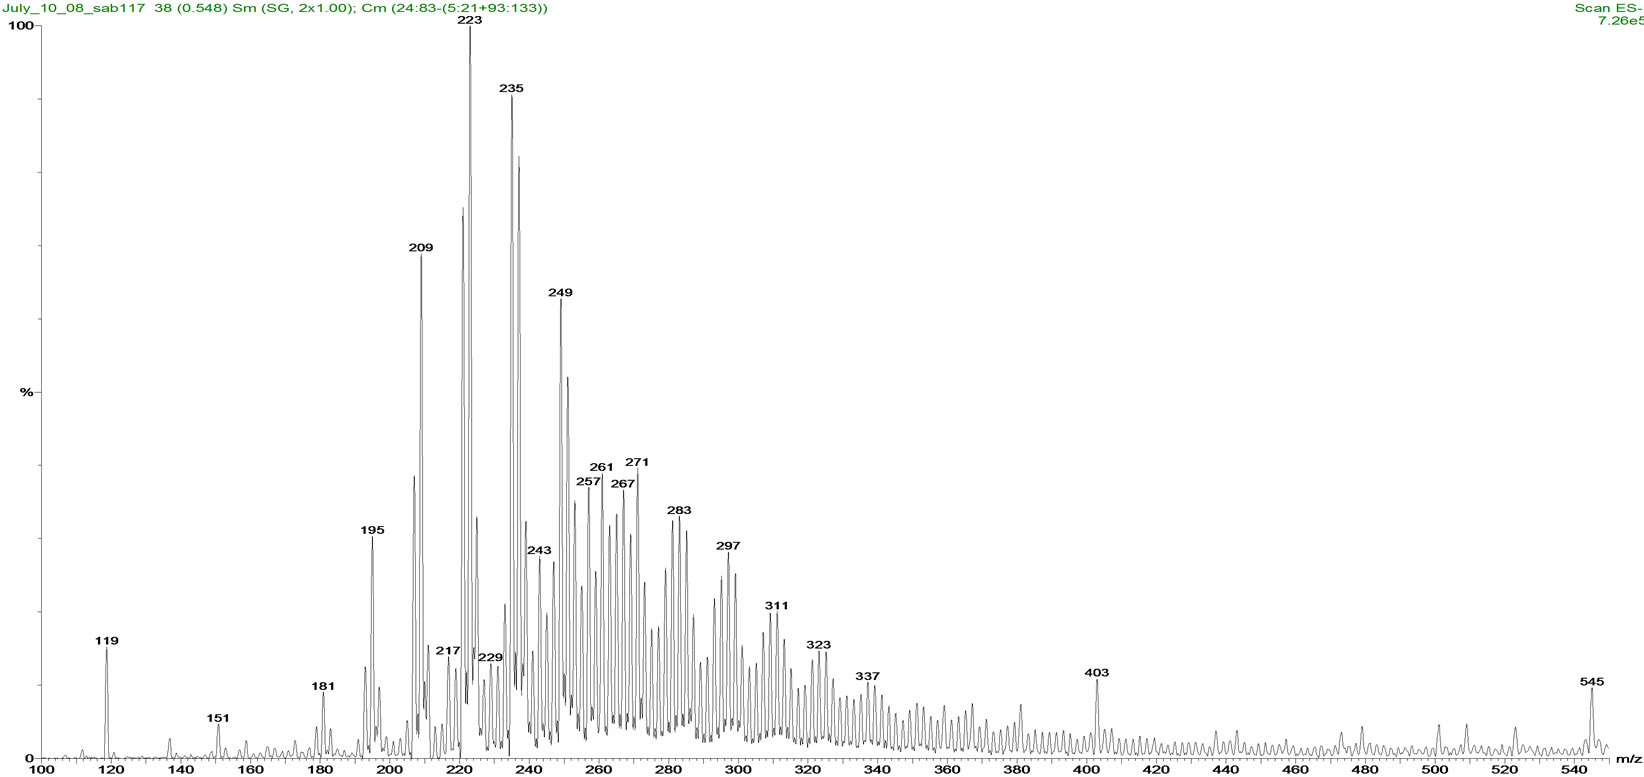 (b)
(b)
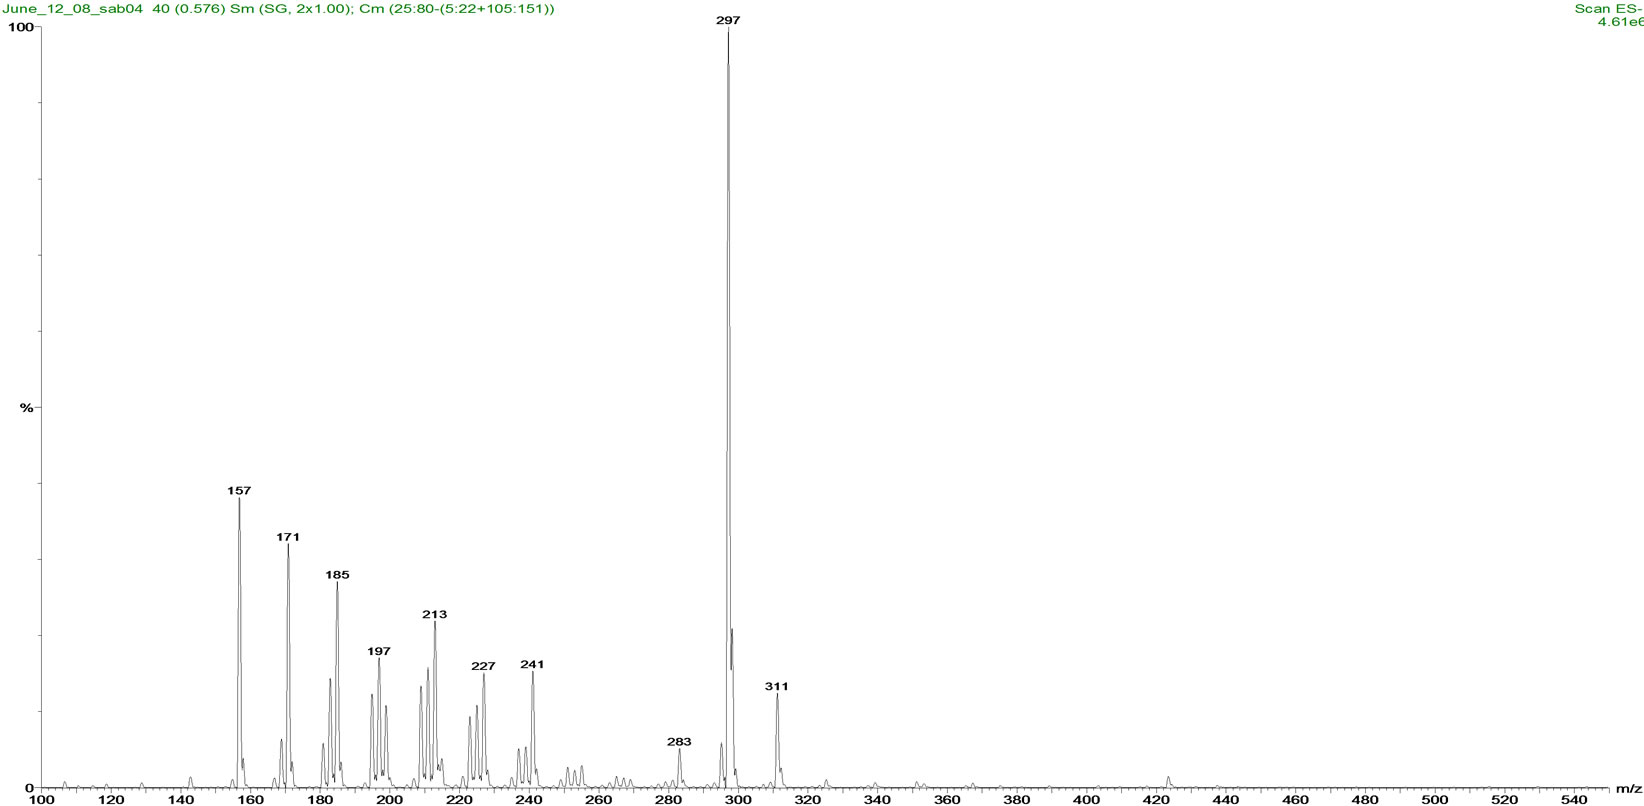
Figure 2. Mass spectra of (a) Fluka NAs and (b) OSPW NAs standards.
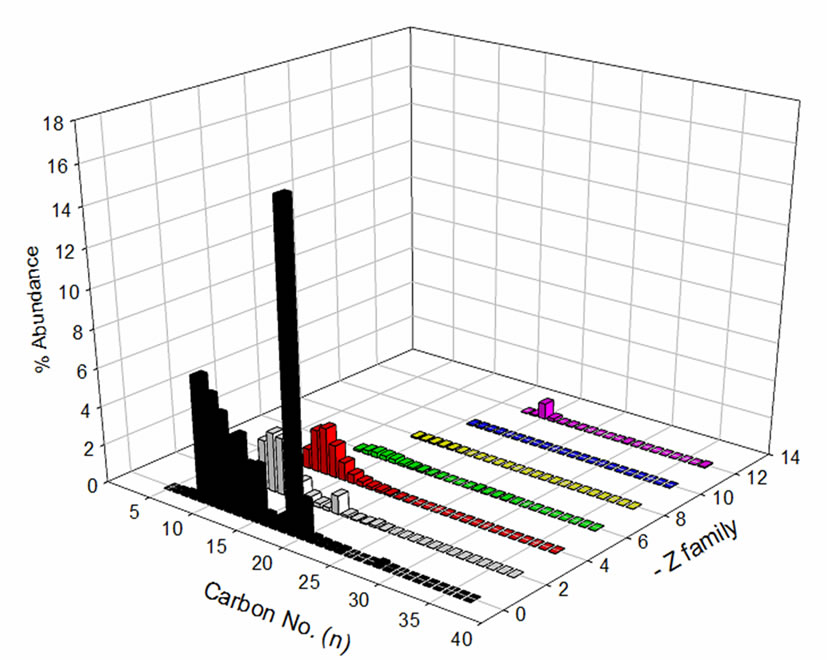
(22 ± 2)˚C. The percentage relative abundance of individual species of NAs is shown in Figure 2. Comparison of carbon number and z-family distribution are given in Figure 3. Components with lower mass to charge (m/z) ratio (157-297 m/z) are predominant in Fluka NAs. OSPW NAs constituents have comparatively higher m/z ratios (195-325 m/z). This composition difference affects the photodegradation and toxicity of NAs mixtures.
Rate constant values for each of the treatments can be seen in Figure 4. Results (R2 = 0.944) indicate that initial concentration of the sample has no effect on the reaction kinetics of the NA degradation. Keeping other variables, such as type of water and TiO2, constant; the system took less time to degrade OSPW NAs than Fluka NAs. This difference in degradation rates may be due to the presence of NA-like compounds present in OSPW NAs.
Frank et al. [19] suggested that OSPW NAs extracts contain multi-carboxylic groups in their structures. Such dicarboxylic acids are susceptible to photo-oxidation on the surface of TiO2. Presence of other components containing aromatic functional groups, sulphur, nitrogen, and unsaturated groups likely contribute to the difference in rates observed [20]. Thus, photocatalysis degraded OSPW NAs more rapidly than the commercial NAs. The use of TiO2 increased the reaction rate and made the de gradation process faster with shorter half-life period because of the catalytic effect of TiO2. Similarly, the type of water has significant effect on the degradation process of NAs.
The use of river water made the degradation process slower as compared to deionized water for both Fluka and OSPW NAs extract. This can be attributed to the matrix effect of others salts and materials present in the river water [21]. For applied photocatalysis, NAs degradation was more rapid for the combination of OSPW NAs in deionized water and with TiO2 compared to river water. Comparative chromatograms of the results before treatment and after 5 h of treatment are also provided (Figure 5). The chromatograms suggest that the lower molecular weight NAs are more readily degraded compared to higher molecular weight NAs.
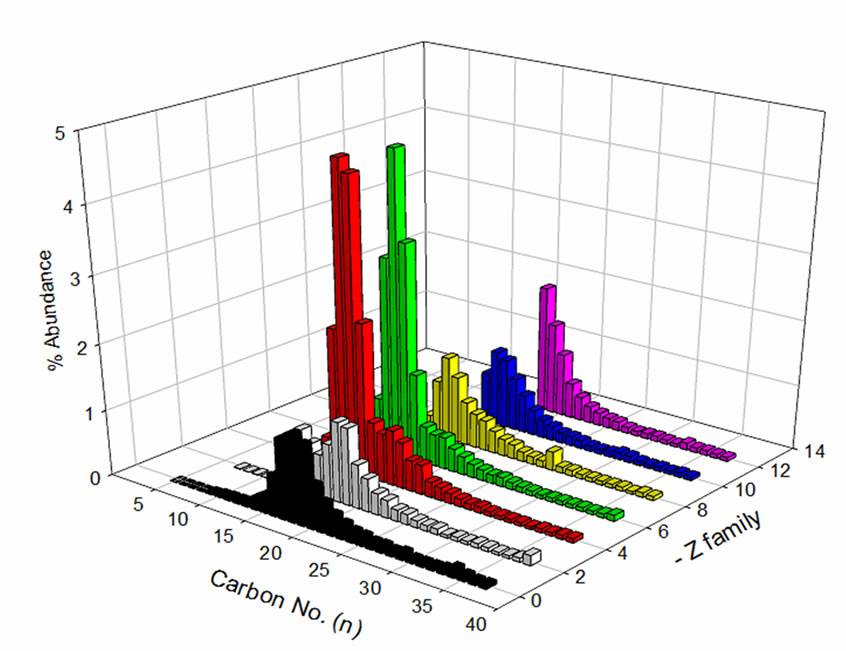
The distribution of carbon number and z-family data of the NAs sample prior to and after treatment indicates selective degradation of lower molecular weight NAs (Figure 6). NAs in the z = –4 and –6 (two and three-ring NAs) families with carbon numbers ranging from 12 to 15 displayed the greatest concentration reduction after treatment. Similar results were observed for NAs with higher z values (z = –12, six ring NAs). This might be due to the presence of NA-like compounds with multicarboxylic groups in their structures, which degrade faster as compared to classical NAs. This contributes to the higher overall degradation rate of NAs. Further investigation, using ultra high resolution MS, is necessary to study the influence of these NA co-extracts on the degradation kinetics.
 (a)
(a)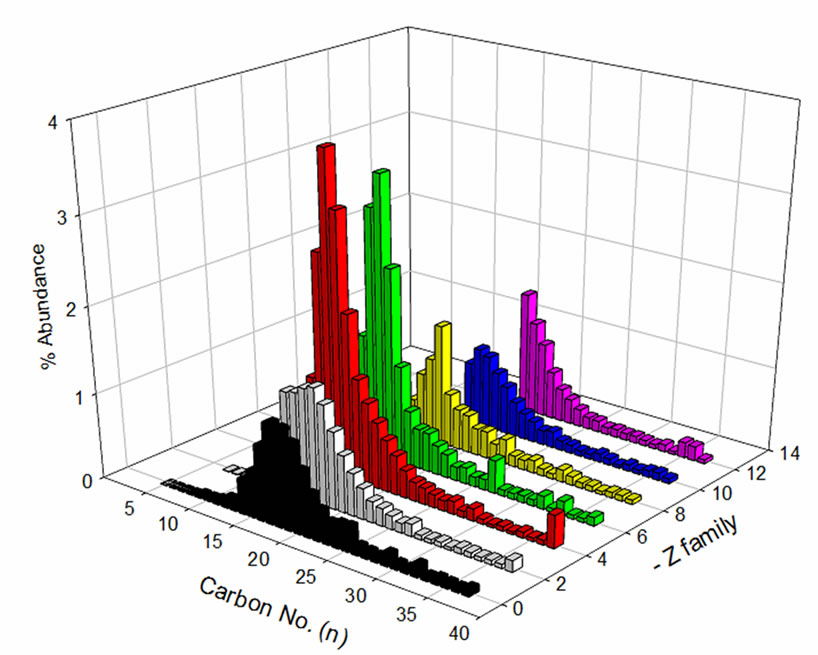 (b)
(b)
Figure 3. Comparison of carbon no. and z-family distribution for (a) Fluka NAs; (b) OSPW NAs.
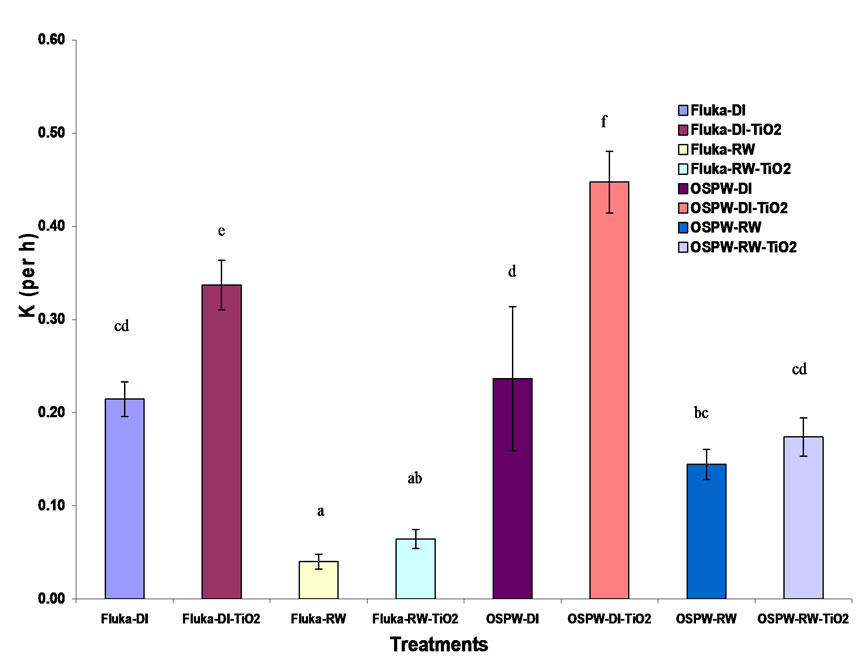
Figure 4. Rate constants (k) for different treatment combinations (R2 = 0.944); means with the same letter designation are not different (P = 0.05) by Tukey’s HSD test.
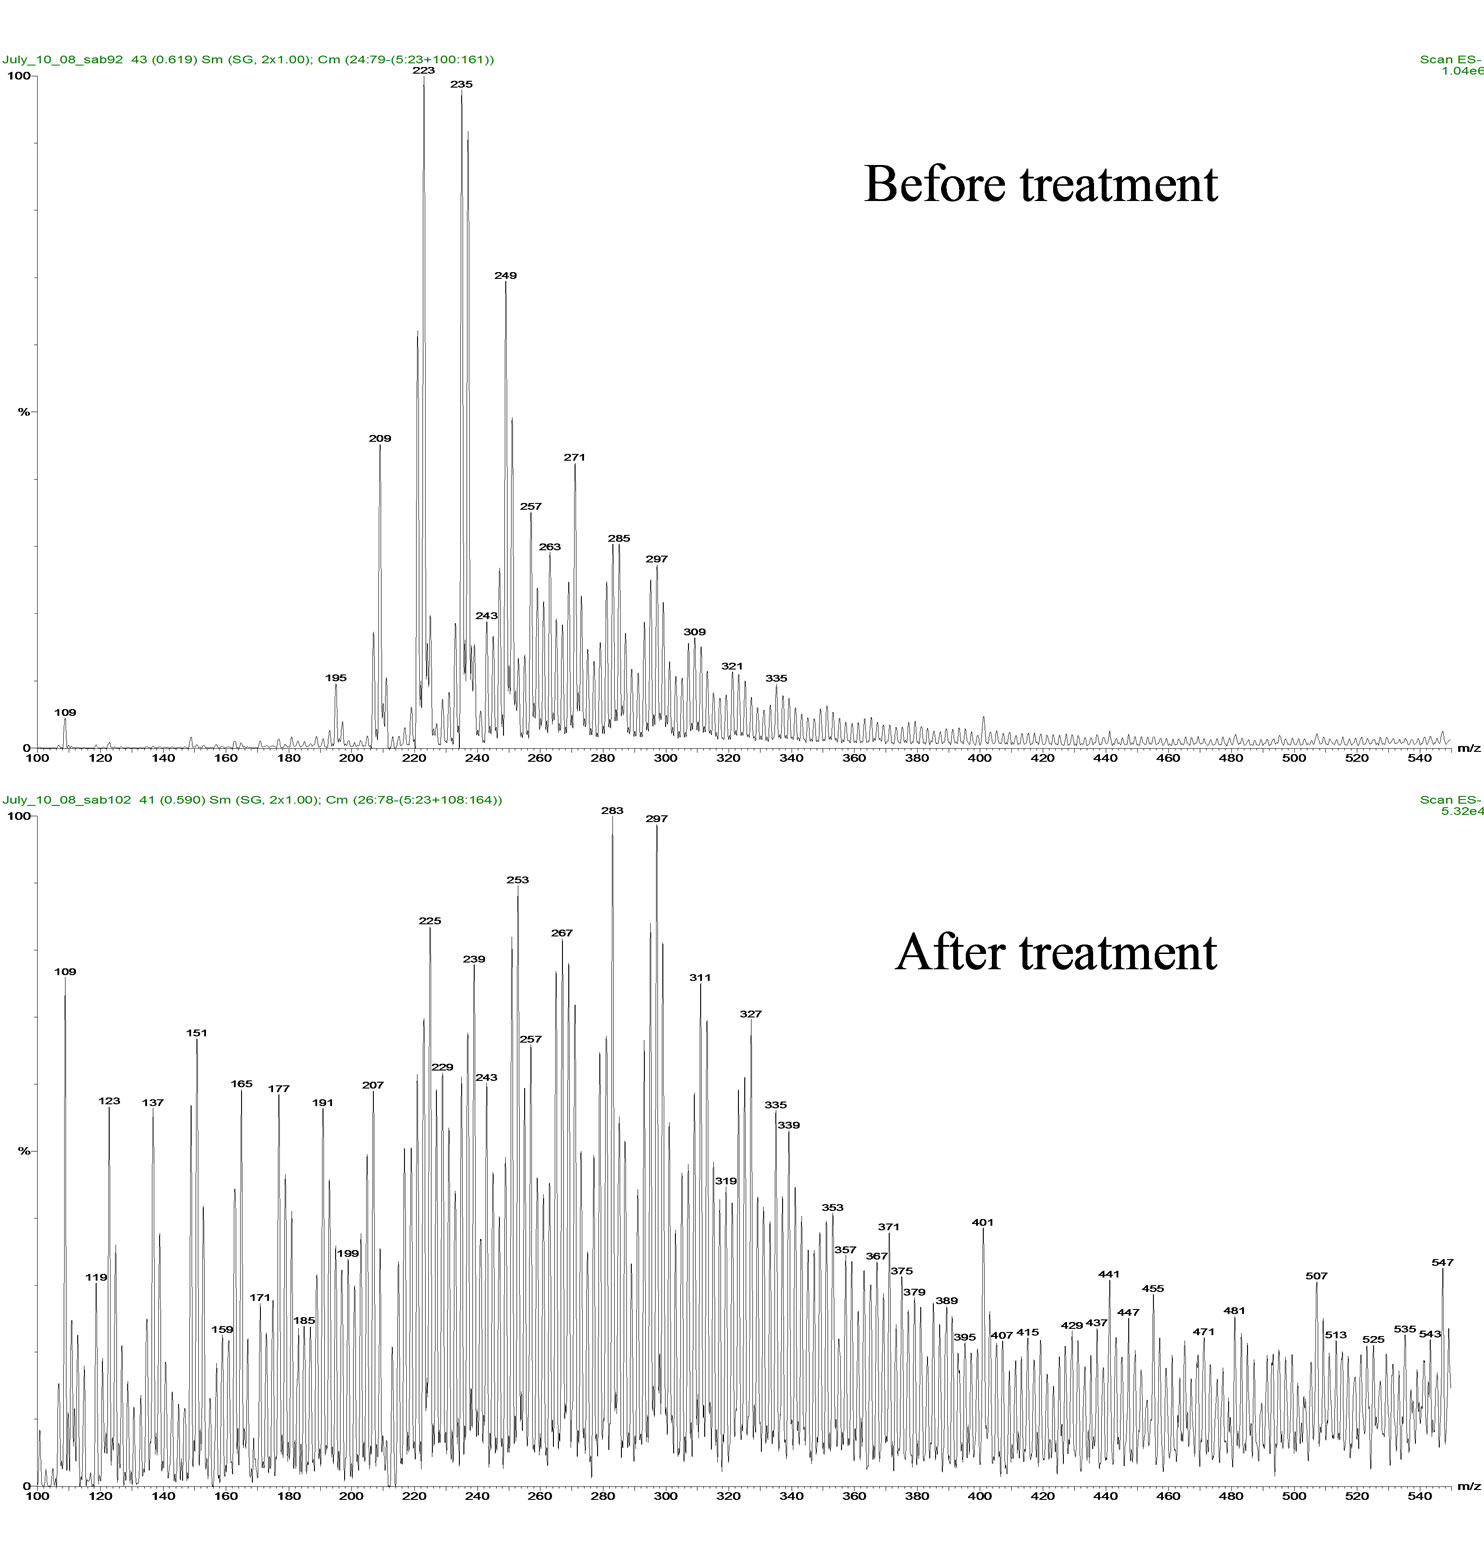
Figure 5. Mass spectral comparison of the OSPW NA extract before and after treatment for 5 h at 24oC.
The results from univariate analysis of variance, clearly show that the source of NAs, type of water, and presence of TiO2, all have contributed significantly to rate constant of the degradation process (at P = 0.05). Also, the interaction between the type of water and use of TiO2 had significant effect on the rate constant. The optimal pseudo-first order rate constant (k) and half-life value under the conditions investigated were 0.447 (h-1) and 1.55 h, respectively.
Apparent distribution of concentrations of individual NAs according to z value was determined after further data mining. Corresponding degradation rate constants for individual z series were calculated (Figure 7). The results show that NAs with z = –4 and –6 were more rapidly degraded than rest of the z-series. Furthermore, NAs with higher z values degraded faster than linear and single ring NAs. This may be due to the presence of unsaturated NA-like compounds [4,19] with higher cyclization, which both degrade faster and contribute to faster degradation reaction kinetics of NAs with higher z. It is also possible that the results are due to the use of low resolution ESI-MS for NAs analysis, which has been reported to indicate substantial false-positive detections and misclassification of OSPW NAs [20], thereby overestimating the NA concentration in the sample. There is a valid need of further data mining using high and ultra high resolution MS to support these findings.
Microtox toxicity tests were completed using the preand post-treatment samples exhibiting the highest rate of degradation reaction (OSPW NAs in deionized water with TiO2). The Mictrotox results are provided in Table 3. High toxicity of the sample with 30 min. IC50 v/v (%) as 15.65% could be treated and detoxified completely with final 30 min. IC50 v/v (%) as more than 90%. Similar results were found for the OSPW NAs in river water with TiO2 (Table 4). Moderate to high toxicity of the sample with 30 min. IC50 v/v (%) as 20.11% could be treated and detoxified completely with final 30 min. IC50 v/v (%) value as more than 90 %. This decrease in toxicity can be attributed to the selective degradation of lower molecular weight NAs (with z = –4 and –6), which are generally considered responsible for the majority of NAs toxicity.
4. Conclusions
The developed system is effective in degrading both commercial NAs and OSPW NA extracts rapidly, with half life values ranging between 1.55 and 17.37 h for the various treatments investigated. The apparent rate constants of degradation of NAs according to their z values were also determined. The photocatalytic system was also shown effective for completely removing toxicity of NAs as confirmed using Microtox tests. Since the results are based on ESI-MS analysis that is not optimal for distinguishing between classical NAs and other NA-like
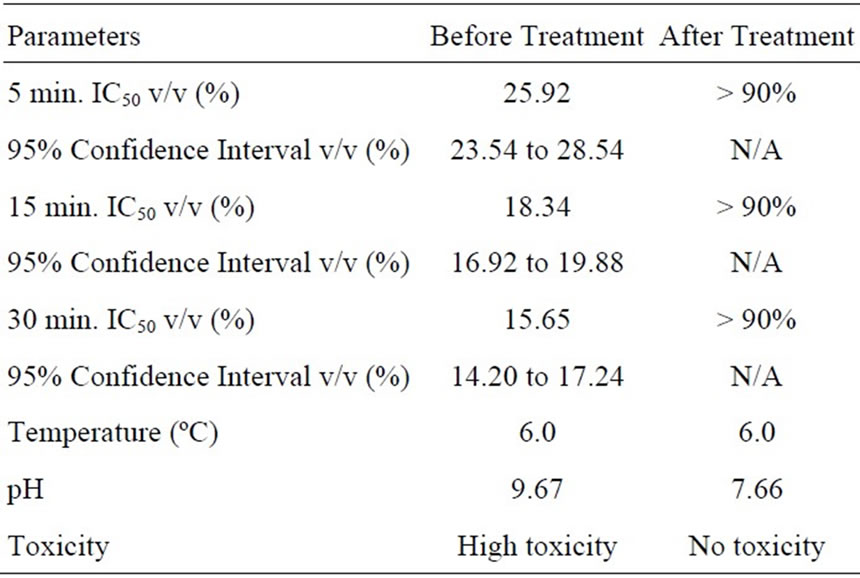
Table 3. Microtox toxicity results for OSPW NA extract in deionized water with TiO2.
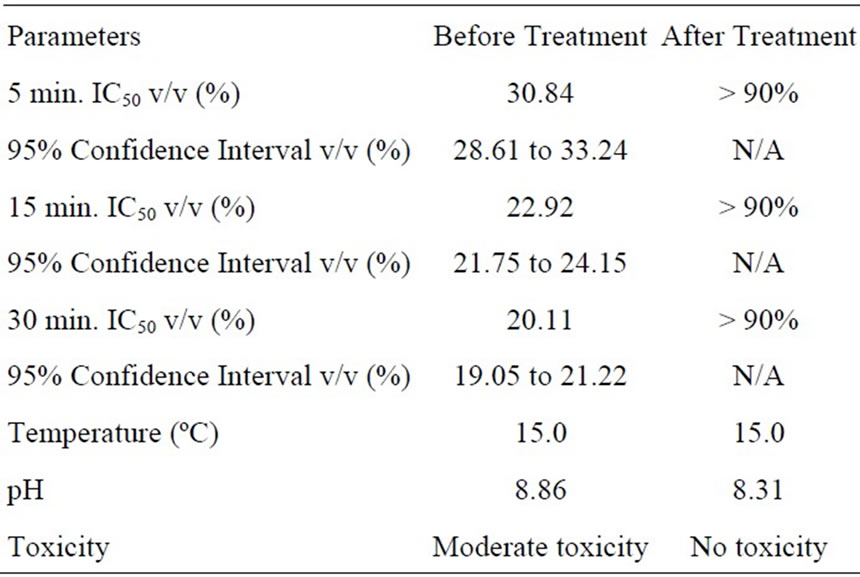
Table 4. Microtox toxicity results for OSPW NA extract in river water with TiO2.
compounds in the sample, further investigation using high and ultra high resolution MS is recommended.
 (a)
(a)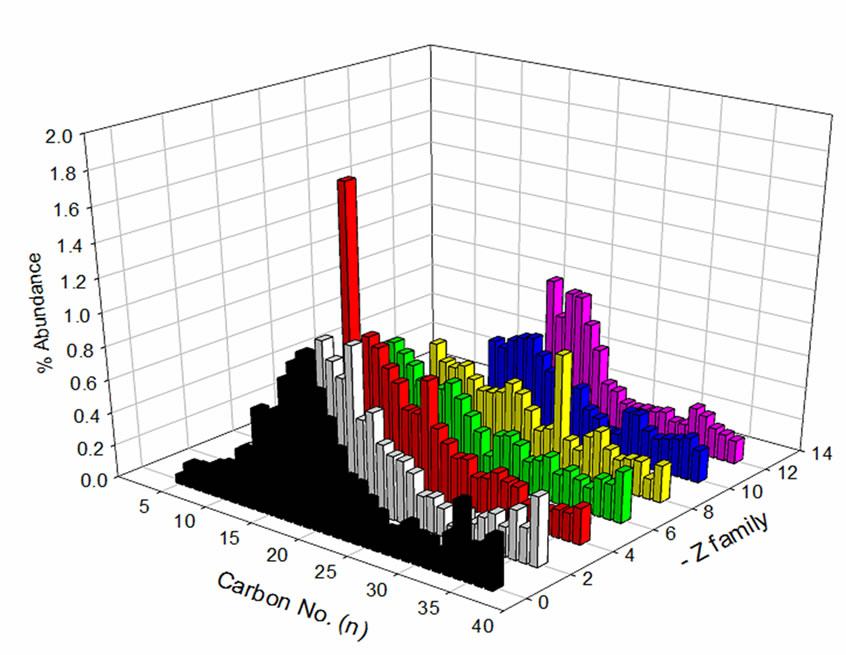 (b)
(b)
Figure 6. OSPW NA extract (a) before and (b) after treament with respect to carbon No. and z-family.
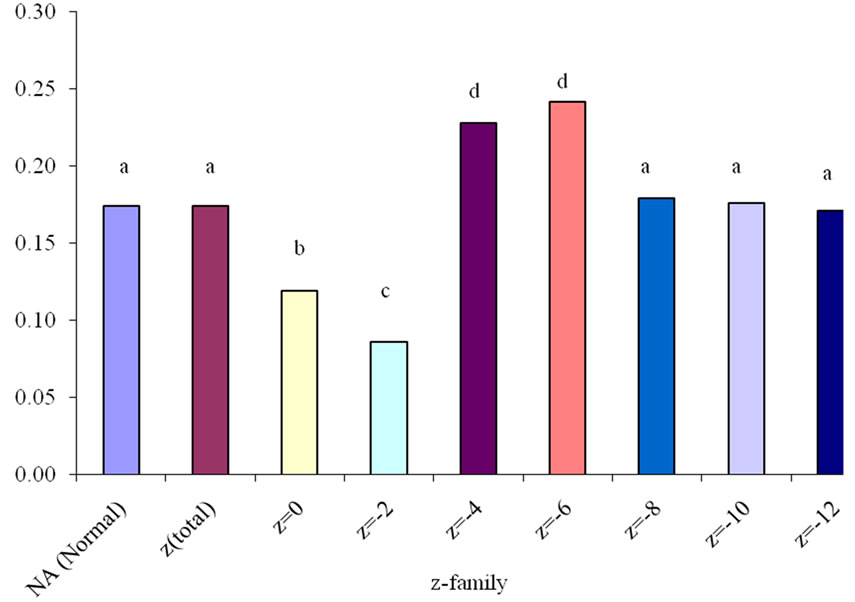
Figure 7. Variation of rate constant “k” with z-family of OSPW NAs in river water due to photocatalysis for 5 h.
5. Acknowledgements
The authors thank Communities of Tomorrow (CT), Natural Science and Engineering Research Council (NSERC) and Science Horizons Youth Award for funding this work and, Central Agricultural University, India for providing facilities to prepare the manuscript.
REFERENCES
- J. V. Headley and D. W. McMartin, “A Review of the Occurrence and Fate of Naphthenic Acids in Aquatic Environments,” Journal of Environmental Science and Health, Part A, Vol. 39, No. 8, 2004, pp. 1989-2010.
- J. S. Clemente and P. M. Fedorak, “A Review of the Occurrence, Analyses, Toxicity and Biodegradation of Naphthenic Acids,” Chemosphere, Vol. 60, No. 5, 2005, pp. 585-600.
- L. E. J. Lee, K. Haberstroh, D. G. Dixon and N. C. Bols, “Salinity Effects on the Toxicity of Naphthenic Acids to Rainbow Trout Cell Lines,” Proceedings of the 27th Aquatic Toxicity Workshop, Halifax, October 2000.
- R. A. Frank, K. Fischer, R. Kavanagh, B. K. Burnison, G. Arsenault, J. V. Headley, K. M. Peru, G. V. D. Kraak and K. R. Solomon, “Effect of Carboxylic Acid Content on the Acute Toxicity of Oil Sands Naphthenic Acids,” Environmental Science and Technology, Vol. 43, No. 2, 2009, pp. 266-271.
- M. D. MacKinnon and H. Boerger, “Description of Two Treatment Methods for Detoxifying Oil Sands Tailings Pond Water,” Water Pollution Research Journal of Canada, Vol. 21, No. 4, 1986, pp. 496-512.
- A. C. Scott, W. Zubot, M. D. MacKinnon, D. W. Smith and P. M. Fedorak, “Ozonation of Oil Sands Process Water Removes Naphthenic Acids and Toxicity-Technical Note,” Chemosphere, Vol. 71, No. 1, 2008, pp. 156-160.
- E. K. Quagraine, H. G. Peterson and J. V. Headley, “In Situ Bioremediation of Naphthenic Acids Contaminated Tailing Pond Waters in the Athabasca Oil Sands Region-Demonstrated Field Studies and Plausible Options: A Review,” Journal of Environmental Science and Health, Part A, Vol. 40, No. 3, 2005, pp. 685-722.
- A. C. Scott, M. D. MacKinnon and P. M. Fedorak, “Naphthenic Acids in Athabasca Oil Sands Tailings Waters are Less Biodegradable Than Commercial Naphthenic Acids,” Environmental Science and Technology, Vol. 39, 2005, pp. 8388-8394.
- O. V. Biryukova, P. M. Fedorak and A. Q. Sylvie, “Biodegradation of Naphthenic Acids by Rhizosphere Microorganisms,” Chemosphere, Vol. 67, No. 10, 2007, pp. 2058-2064.
- S. A. Armstrong, “Dissipation and Phytotoxicity of Oil Sands Naphthenic Acids in Wetland Plants,” Ph.D. Dis-
- sertation, University of Saskatchewan, Saskatoon, 2008.
- X. Han, A. C. Scott, P. M. Fedorak, M. Bataineh and J. W. Martin, “Influence of Molecular Structure on the Biodegradability of Naphthenic Acids,” Environmental Science and Technology, Vol. 42, No. 4, 2008, pp. 1290- 1295.
- D. W. McMartin, “Persistence and Fate of Acidic Hydrocarbons in Aquatic Environments: Naphthenic Acids and Resin Acids,” Ph.D. Dissertation, University of Saskatchewan, Saskatoon, 2003.
- D. W. McMartin, J. V. Headley, D. A. Friesen, K. M. Peru and J. A. Gillies, “Photolysis of Naphthenic Acids in Natural Surface Water,” Journal of Environmental Science and Health, Part A, Vol. 39, No. 6, 2004, pp. 1361- 1383.
- J. V. Headley, J. Du, K. M. Peru, D. W. McMartin, “Electrospray Ionization Mass Spectrometry of the Photodegradation of Naphthenic Acids Mixtures Irradiated with Titanium Dioxide,” Journal of Environmental Science and Health, Part A, Vol. 44, No. 6, 2009, pp. 591-597.
- A. Janfada, J. V. Headley, K. M. Peru and S. L. Barbour, “A Laboratory Evaluation of The Sorption of Oil Sands Naphthenic Acids on Organic Rich Soils,” Journal of Environmental Science and Health, Part A, Vol. 41, No. 6, 2006, pp. 985-997.
- V. V. Rogers, K. Liber and M. D. MacKinnon, “Isolation and Characterization of Naphthenic Acids from Athabasca Oil Sands Tailings Pond Water,” Chemosphere, Vol. 48, No. 5, 2002, pp. 519-527.
- J. V. Headley, K. M. Peru, D. W. McMartin and M. Winkler, “Determination of Dissolved Naphthenic Acids in Natural Waters Using Negative-Ion Electrospray Mass Spectrometry,” Journal of the AOAC International, Vol. 85, No. 1, 2002, pp. 182-187.
- J. V. Headley, K. M. Peru, M. P. Barrow and P. J. Derrik, “Characterization of Naphthenic Acids from Athabasca Oil Sands Using Electrospray Ionization: The Significant Influence of Solvents,” Analytical Chemistry, Vol. 79, No. 16, 2007, pp. 6222-6229.
- R. A. Frank, R. Kavanagh, B. K. Burnison, G. Arsenault, J. V. Headley, K. M. Peru, G. V. D. Kraak and K. R. Solomon, “Toxicity Assessment of Collected Fractions from an Extracted Naphthenic Acid Mixture,” Chemospere, Vol. 72, No. 9, 2008, pp. 1309-1314.
- J. W. Martin, X. Han, K. M. Peru and J. V. Headley, “Comparison of Highand Low-Resolution Electrospray Ionization Mass Spectrometry for the Analysis of Naphthenic Acid Mixtures in Oil Sands Process Water,” Rapid Communication in Mass Spectrometry, Vol. 22, No. 12, 2008, pp. 1919-1924.
- S. Mishra, “Microwave Assisted Photocatalytic Treatment of Naphthenic Acids in Water,” Ph.D. Dissertation, University of Saskatchewan, Saskatoon, 2009.