Journal of Software Engineering and Applications
Vol.6 No.4(2013), Article ID:30462,12 pages DOI:10.4236/jsea.2013.64024
An Approach to Developing a Performance Test Based on the Tradeoffs from SW Architectures
![]()
Department of Computer Science and Engineering, Ewha Womans University, Seoul, South Korea.
Email: *bjchoi@ewha.ac.kr, misoyoon@ewhain.net, heejinkim@ewhain.net
Copyright © 2013 Byoungju Choi et al. This is an open access article distributed under the Creative Commons Attribution License, which permits unrestricted use, distribution, and reproduction in any medium, provided the original work is properly cited.
Received February 26th, 2013; revised March 27th, 2013; accepted April 3rd, 2013
Keywords: Performance Test; Performance Tradeoff; Tuning Point; Performance Test Coverage
ABSTRACT
In a performance test, the standards for assessing its test results are not sufficiently determined due to the lack of a well-structured test developing methods which are found in a functionality test. By extending the established workflow structure, this approach will concentrate on tradeoffs within T-workflow and further develop tests based on T-workflow. The monitoring and tuning point have also been investigated to understand the validity and performance of software. Finally through a case study, it has been shown that better assessment of software performance can be obtained with the suggested tests developed based on T-workflow and by locating its monitoring point and tuning point.
1. Introduction
A quality of software (SW) is directly related to its performance testing, in which the system’s efficiency and reliability are assessed. Performance test measures the speed under certain loading conditions and discovers bottlenecks within the functions of a system. A performance test is conducted primarily for verifying a system’s satisfaction of the performance objectives [1]. Performance of a system is affected by many complex factors; one of the performance attributes can affect another.
A SW performance is validated with a performance evaluation before SW development. It is also validated by performance test completed after SW development. Performance models are used to build the performance evaluations, and the most frequently used models are based on the software architecture (SA) [2,3]. Most performance evaluations are built with performance models that only assess the performance of SA, not the SW. Therefore, there is an inevitable gap between the performance results analyzed with performance models and the realized SW performance. In other words, there are limitations in a performance evaluation designed only with performance models.
On the other hand, a performance test is built with performance requirements and workload models. Many studies have been asserting the importance of clarification of performance requirements in developing dependable performance tests due to the fact that most of the tests are conducted by framing test scenarios based on the performance requirements. Other performance tests are built with more realistic workload models developed through analyzing user behavior patterns. Whether the test cases were developed based on performance requirements or workload models, only achievement of performance requirements can be verified for test items. Therefore the complex relationships between performance attributes are not reflected despite of their importance. In this paper, a performance test’s coverage is defined for analyzing performance attributes’ side-effects and the test cases satisfying the suggested coverage is developed.
It is generally believed that the performance of SW is determined at the SA development stage. Before the development of SW, SAs are mostly used for performance assessment [4]. Architecture tradeoff analysis method, ATAM [5], is one of many assessment methods using SA, in which the compatibility of architecture is evaluated by analyzing achievement of the initially intended quality objectives and detecting risky components through analyzing the tradeoffs of architectural decisions. In this paper, a performance test coverage is defined using abovementioned tradeoffs of architectural decisions. Also, a new approach to develop more systemic performance test cases is proposed using the analysis of the causality of performance attributes’ side-effects.
Following this introduction, existing architecture-based performance evaluations, performance analyses and performance tests are examined in Section 2. In Section 3, suggested methods and processes of developing such test cases are explained. In Section 4, case study for NAND flash memory file system applying the suggested methods is explained. Finally in Section 5, this study is concluded with future plans.
2. Related Works
2.1. Performance Test
Performance is one of the features of a whole system, reflecting its overall functionalities. A performance test is usually conducted at the system test level after completion of system development. The scenario-based blackbox technique is used for commonly employed performance test methods and tools. The technique develops test scenarios based on performance requirements [4,6] or measuring workloads by analyzing the existing usage data [7]. However, specification-based performance testing at the system level focuses on measuring performance only within certain loading conditions. Therefore it is difficult to detect the cause of performance problems. Moreover, because the system development is already completed, there are limitations when solving the identified problems.
Studies on the existing model-based performance testings are mostly aimed at constructing more realistic workloads [8] and their System Under Test, SUT, is focused on web-applications [9,10]. There are two commonlyused methods for constructing workloads; the recently developed method, using analysis of the existing log files for web-applications and the method deriving from user behavior patterns obtained from existing similar applications. These two methods, however, require time and resources for collecting and analyzing the existing log files and user behavior patterns.
2.2. Software Architecture Based on Performance Test and Analysis
Software architecture is a set of important decisions made on the structure of SW. SA illustrates structures of SW at a high level of abstraction [2]. Because the realization of SW is established based on its architecture, SW performance is greatly affected by SA.
There are various studies on SW performance analysis, using SAs at the early SW development stage through performance prediction and evaluation. By analyzing the SW performance in SW development stage, weaknesses of SW can be discovered as early as to be supplemented or adjusted, leading to the improvement of SW quality. In Software Performance Engineering, SPE [11], the use of mathematical performance models is proposed to assess the performance at every stage from the beginning of the SW development.
Recently, a performance model using the SA regular requirement models has been suggested for analysis of the SW performance. Such a model can help select the SA with optimum performance [2,3]. However, these methods are basically used for selecting the optimal architecture at the development stage due to the inevitable gap between the SAs and the realized SWs. Therefore, additional performance tests are required after SW development.
In this paper, utilization of analyzed results of architectural decisions’ tradeoffs is suggested for developing performance test cases. Architecture decisions are major SA solutions, directly influencing on the establishment of performance attributes and their tradeoff-relationships. They can influence over more than one quality attributes. Through analysis of the tradeoffs within architecture decisions, four methods have been suggested for performance testing: 1) setting performance evaluation indices; 2) developing test cases applying the tradeoff-based workflow design as a test coverage; 3) identifying a monitoring point and using the performance-affecting data, monitored for interpreting the performance test results; and 4) identifying a tuning point. Several terms, such as tradebased workflow, a monitoring point, and a tuning point, are more clearly defined and explained in detail in following Section 3.2. Besides four methods proposed in this paper, the study also aims at analysis of the sideeffects of the performance attributes through a performance test, in which performance indices are set and test cases are built based on the tradeoffs.
3. A New Method for Developing Performance Tests
To build performance test cases more effectively, the study addresses the two major test issues. First is “what should be tested in the performance test”, which uses SA tradeoffs in building performance tests. In the existing test methods, only one performance index has been evaluated. However, if a performance attribute in a tradeoff-relationship with another is selected to be tested as a performance index, its tradeoffs belonged to another quality attribute are also selected as performance indices. By evaluating the two or more performance indices simultaneously, the test results can be focused on the analysis of side-effects of performance attributes.
Second test issue is “what should be selected as input variables for each test case”. Problems in performance are usually caused by complex functions with various factors, and therefore, it is difficult to discover the causes. However, if a test case is built with selected key variables in SW performance, the cause of the performance problems can be more easily understood and analyzing the actual values of input variables can become easier to handle. In this paper, a workflow which illustrates the tradeoff-relationships between performance attributes, called T-workflow, has been drawn and test cases have been built in a way to cover this T-workflow to select appropriate input variables. Furthermore, new methods for locating a monitoring point and a tuning point is introduced. A monitoring point is a performance affecting point with which analysis of the causes of performance degradation can be better understood. A tuning point is a point at which performance adjustment can be made to find the optimal performance state.
Figure 1 illustrates the flow of inputs and outputs in developing test cases. T-workflow is drawn based on performance requirements, SA decisions which satisfies the requirements, and the SA itself. Then, test cases are developed with the T-workflow. In this section, as a running example, the suggested method is explained by building a performance test case for YAFFS2, the NAND flash memory file system [12].
3.1. Running Example: YAFFS2
YAFFS2 is a file system based on the Linux, a major file system for Android OS and NAND flash memory. It supports page write in 2 KB units as well as other major attributes such as fast write speed, mount speed and wear-leveling. In Table 1, YAFFS2’s major quality attributes are classified, and its major performance attributes are file write speed, file read speed, and mount speed.
YAFFS2, based on log-structure, solves over-writing problems of a flash memory, secures empty blocks for file writing by using garbage collection, and enhances the mount speed through the checkpoint. Major architectural decisions for performance enhancement and the related SW structures for YAFFS2 are shown in Table 2.
3.2. T-Workflow
The T-workflow in this study is designed to illustrate the flow of events caused by architecture decisions tradeoff-relationship and include the monitoring and tuning points.
3.2.1. Tradeoff
Tradeoffs is a relationship between two or more quality attributes in which satisfying one attribute results in another’s sacrifice. For example, when a bit-encryption number is increased in a virtual private network which enhances its coding level, reliability can be improved, but its time responsiveness is declined because more processing time is required. So, in this case, reliability and time responsiveness are in the tradeoff-relationship.
In Table 3, tradeoffs of file write speed for YAFFS2 are shown. Here, the greedy garbage collection is selected among YAFFS2 architectural decisions to illustrate the tradeoff-relationship in more detail. YAFFS2 employs a greedy technique. It searches over the whole NAND memory in an aggressive mode when there are less than 10 empty blocks and otherwise it is in a passive mode searching only fractions of the NAND memory and thus, selecting the garbage collection blocks.
In other words, with less than 10 empty blocks, the
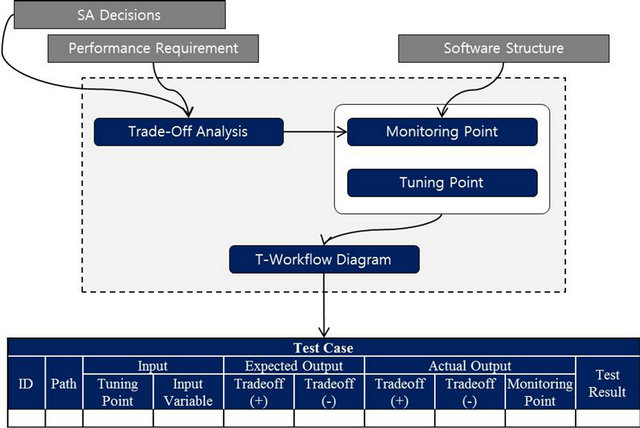
Figure 1. Developing process of tradeoffs-based performance tests.
Table 1. Quality atrributes and performance requirements for YAFFS2.
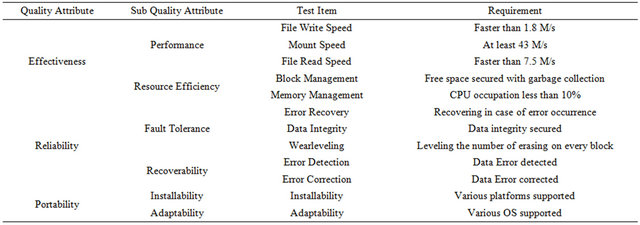
Table 2. Architectural decisions and software architectures related to file write speed of YAFFS2.
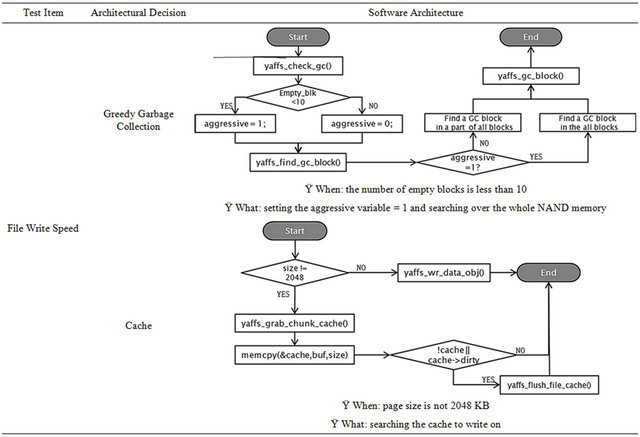
Table 3. Tradeoffs, monitoring points, and tuning points of file write speed for YAFFS2.

architectural decision, greedy garbage collection, retains free chunks of NAND memory by finding a block that can hold most of the free chunks. That is, its positive tradeoff, resource efficiency, is enhanced. However, at the same time, to find that block, the whole NAND memory needs to be searched over, and thus file write speed, its negative tradeoff, is decreased.
3.2.2. Monitoring Point
A monitoring point is data which affects the performance measurements, giving clues when analyzing the cause of performance degradation. A decision making point in an architectural decision is also often referred as a monitoring point. Measuring the values of a monitoring point leads to discover which factor has affected on the performance and thereby, helps interpreting the performance testing result. A monitoring point also helps locate “what” architectural decisions triggers to happen with two or more performance attributes in the tradeoff-relationship and “what” in this case is a monitoring point.
For example, as shown in the SA of greedy garbage collection in Table 2, when the aggressive variable value is set to 1, its positive tradeoff is enhanced by searching the whole NAND memory and consequently its negative tradeoff, file write speed, is decreased. In other words, as the number of setting the aggressive variable to 1 is increased, its negative tradeoff, file write speed, is more degraded. Therefore, in this case, the monitoring point is the number of setting aggressive variable to 1. According to this monitoring point, changes in file write speed and securing free chunks of NAND can be analyzed.
3.2.3. Tuning Point
A tuning point is an adjustment-required variable which needs tuning to find the optimum performance state when the performance requirements are unsatisfied. Like the monitoring point, a tuning point can be found using tradeoff-relationship. When a tradeoff-relationship is suspected to cause performance degradation, by controlling the situation or conditions causing the tradeoff-relationship, performance degradation can be prevented. In other words, by analyzing the tradeoffs results influenced by a variable, appropriate tuning of the variable can be made to prevent the performance degradation.
For example, as shown for greedy garbage collection in Table 2, the negative tradeoff, file write speed decrease, is induced at the point “when the number of empty blocks is less than 10”. This means that the bifurcation condition of causing or not-causing the tradeoffs is “the number of empty blocks”. Therefore, the tuning point of the greedy garbage collection is the number of empty blocks, which determines setting of aggressive variable to 1.
3.2.4. T-Workflow
Workflow diagram is a flow chart which clarifies flows of tasks and actions from a person, composed of set of arrows connecting actions to show its flow [13]. At the system test stage, black box technique is used mostly based on requirements and the flow of user commands can be used as workflow, illustrating test scenarios.
For example, to test the performance of file write of YAFFS2, a workflow can be drawn as shown on the top of Figure 2. It is because YAFFS2 which is located inside the kernel can be accessed through system calls such as open or write triggered by a person.
However, there is a limitation in developing test cases for performance testing of file write of YAFFS2 only with the workflow of system calls. If a test case is developed regarding only system calls, it is difficult to predict the internal status of YAFFS2 because there are only system calls to be used for analyzing the cause of performance problems. Therefore, extension of workflow chart is needed to describe internal state of the test subject in more detail. However, it is too broad to illustrate every process handled by YAFFS2 through system calls and limiting the extension range is also necessary.
In this paper, the extension range of the workflow is focused on the tradeoffs for analysis of side-effects. To show the location of the tradeoffs of the tested source codes, extended T-workflow is suggested. By extending the workflow composed of the existing user triggered calls, T-workflow illustrates that what kinds of tradeoff-relationship is induced by which user commands inside the test subject. Also, the tuning and monitoring points related to this are illustrated. An additional component for T-workflow is shown in Figure 3.
In Figure 2, T-workflow diagram about the performance of file writing is illustrated with basic workflow of applications extended with the components shown in Figure 3. Because the architecture decision, greedy garbage collection, with tradeoffs of file writing performance is executed when writing system is called, T-workflow can be drawn by extending SW structure of greedy garbage collection in the tradeoff-related area based to writing system call. At the bottom of Figure 2, it is illustrated that in the “tradeoff-related area”, the tuning point is set as a reference point for division mark between tradeoff-occurring and tradeoff-not-occurring paths. The monitoring point, which is affected by occurrence of tradeoffs, is also shown in Figure 2.
3.3. Test Coverage and Test Cases
A test case is generally composed of inputs, expected outputs and actual outputs. As shown in Figure 1, our performance test cases include the estimation of performance tradeoffs in the expected outputs and the moni-
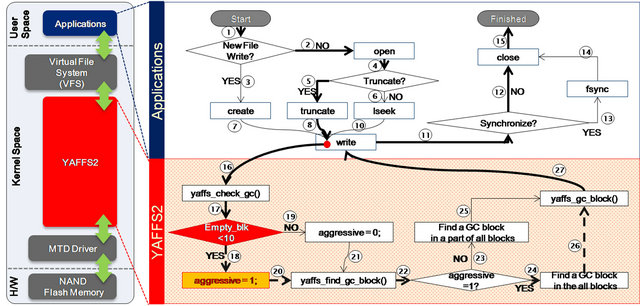
Figure 2. T-workflow diagram for greedy garbage collection of file write speed for YAFFS2.

Figure 3. The components of T-workflow.
toring point value in actual outputs.
T-workflow diagram can be used as performance testing coverage. In this paper, the all-edge is applied among the existing white-box test criteria. For example, if edge coverage is applied on the basic workflow shown on the diagram at the top of Figure 2, the paths shown with thick lines are “WP1: “1→2→4→5→8→11→12→15”, covered in a set of test cases shown in Table 4. When the edge coverage is applied to the T-workflow suggested in this paper, not only the basic workflow but also the extended diagram shown at the bottom of Figure 2 must be covered. When extended to T-workflow, the tuning point value is also included in inputs because there is a bifurcation at the tuning point. Table 5 shows a set of test cases for TWP1 and TWP2, obtained from WP1 added with extended paths from tradeoff points in our T-workflow. In Figure 2, NAND memory usage, which reflects the number of empty blocks, is the variable to cover the tradeoff used as a tuning point. Therefore, tests covering TWP2 is for those with less than 99% NAND memory usage.
4. Case Study
4.1. Test Subject and Purpose
Through a performance testing, it is commonly verified whether performance requirements are satisfied or not. Also, important objectives of performance testing are to find when the performance is declined and to identify the tuning point of the performance by analyzing the cause. Generally the black-box tests based on performance requirements are conducted to confirm the achievement of each performance requirements through selecting test data among the mostly used data range by the user-based workflow.
In this paper, through the case study, the superiority of our T-workflow-covering test is shown, compared to the existing workflow-covering test in two aspects: 1) the effectiveness in evaluating the performance and 2) the advantage of the tuning point. Firstly, through the performance testing covering T-workflow, it is shown that how tradeoffs analysis contributes to the performance evaluation. If a key variable can be identified among
Table 4. Workflow based tests and results.

Table 5. T-Workflow based Tests and Results.

many complex factors which affects on the performance, adjusting the variable can be very effective for optimizing the performance. Secondly, it is shown that how much and what kind of changes can be made on performance after adjusting the tuning point.
The subject of a case study in this paper is YAFFS2. The performance test items are file write speed, mount speed, and file read speed. However, as NAND flash memory basically supports fast file reading, there was no tradeoff of file reading in YAFFS2. Therefore, in this study, performance tests are conducted on two performance test items of YAFFS2, file write speed and mount speed, using the previously suggested methods in this paper, and greedy garbage collection result of file write speed is analyzed.
The tests carried out in this study are shown in Table 6. For example, for greedy garbage collection of file write speed, there are 6 test paths, and 100 tests are formed to
Table 6. Some of test sets.
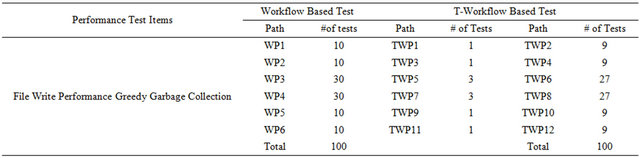
cover them all when edge coverage is applied only to the workflow shown on top of Figure 2. When it is extended to T-workflow and edge coverage is applied, there will be 12 test paths in total due to the bifurcation at the tuning point dividing into two different paths. To cover the 12 test paths, 100 test cases are selected.
4.2. Test Results and Analysis
4.2.1. Effectiveness in Evaluating the Performance
Good performance test evaluates the performance properly through its results and also enables the analysis of the causes of performance degradation. For file write speed, the results of workflow tests and T-workflow tests are shown in Figures 4 and 5, respectively. The tests which are developed based on the simple workflow measure values of the performance index of a test item. As shown in Figure 4, x-axis represents test cases and y-axis represents performance index of the test item. As shown in Table 1, performance requirements states with more than 1.8 M/s for file write speed and 7.5 M/s for file read speed are needed. In cases of TC_1_10, TC_1_60, and TC_1_100, the file write speed is shown to be decreased as in Figure 4.
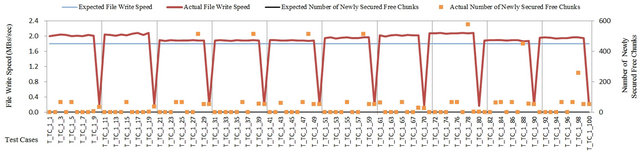
In Figure 5, T-workflow based tests results are shown with test cases on x-axis and tradeoff measurements on y-axis. On the file write speed graph (a), the right side of the y-axis is for the number of newly secured free chunks as the positive tradeoff and the left side is for the measurement of file write speed as the negative tradeoff. In graph (b), the measurement of the monitoring point is shown. As mentioned in Section 3.2, the monitoring point for file write speed is the number of setting “agrgressive = 1”.
In graph (a), it is shown that file write speed is decreased in 10 test cases such as T_TC_1_10, T_TC_1_20 and etc. while its tradeoff, the number of newly secured free chunks, is increased. T_TC_1_10 is examined more closely. The file write speed is 0.18 M/s, not satisfying the performance requirements, but the number of newly secured free chunks is more than 400, showing enhanced resource efficiency. Those cases shown in graph (a) correspond to graph (b), showing that, for such cases, the number of setting “aggressive = 1” is more than 60 times. As shown in the SA of greedy garbage collection in Table 2, if 1 is set for aggressive variable, whole NAND memory is searched to find garbage collection subject blocks so that the most number of free chunks can be retained. In the monitoring point graph of Figure 5(b), for test cases with more than 60 settings of “aggressive = 1”, it can be deduced that many of free chunks can be secured with the cost of decreased file write speed due to the frequent calculations, searching the whole NAND memory during the file writing.
Therefore, despite of the unsatisfied performance objective, file write speed, for the enhanced resource effectiveness and its tradeoff, the 10 test results including T_TC1_10 are not counted as failed but passed cases. In contrast to this result, previously in the workflow based tests, T_TC1_10 and TC_1_10 with the same test input values are regarded as failed cases.
As shown in the test results illustrated in graph 5, performance testing is not sufficient only with final performance indices. However, the performance testing can be improved by analyzing the test items side-effects, using the tests covering the tradeoff area. It is because, as shown in our example, other performance attribute might be enhanced even though the test item did not satisfy the performance requirements, resulting in passed test cases in overall. Also, it is shown that the monitoring point, the variable and the point changing with tradeoff-occurring and not-occurring paths, help analyzing the test results since they are the factors influencing on performance measurement values.
4.2.2. The Advantage of Tuning Point
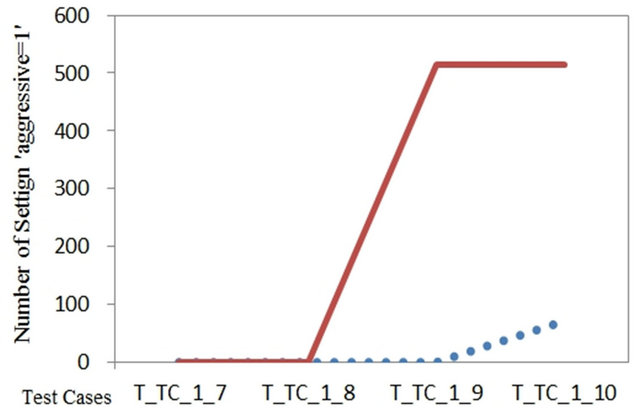
A tuning point is the point with the bifurcation condition determining between the tradeoff-occurring and not-occurring paths, which can be used to adjust the SW performance. Through adjustment of the suggested tuning point values, it can be helped to determine the optimum performance state. In Figure 6, results of adjusting file write speed tuning point are shown. The dotted-line is for before tuning and the solid line is for after tuning.
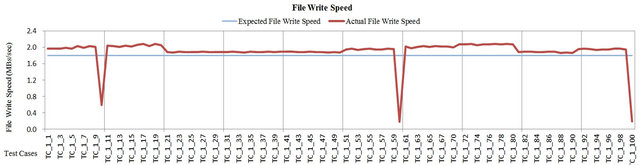
Figure 4. Workflow based test.
 (a) File Write Speed
 (b) Monitoring Point of File Write Speed
For representing the measurements of the negative tradeoff, square is used for before tuning and star for after.
If the Figure 5(a) is regarded as before tuning, the dotted-lines and squares in Figure 6(a) represent the cases when the number of empty blocks is less than 1% of NAND capacity. The solid line and stars in Figure 6(a) represent the cases when it is less than 25% of NAND capacity.
In Figure 6(b), only test results from T_TC_1_7 to T_TC_1_10 are illustrated. In (b), T_TC_9 is shown to satisfy its expectation in file write speed of 2.0 MBs/sec before tuning, but the speed is decreased to 1.5 MBs/sec after tuning. The number of newly recurred free chunks has increased to 4 from 0 after tuning. In Figure 6(d), it is shown that the monitoring point of T_TC_1_9, number of setting “aggressive = 1”, was measured more than 500 times after tuning. T_TC_9 has failed because the number of setting “aggressive = 1” is measured too many times, scanning the whole NAND too frequently, decreasing file write speed but not securing enough number of free chunks. It passed before tuning but failed after.
In T_TC_10, before tuning, the test result was regarded as passed because of the increased number of newly secured free chunks despite of unsatisfied expected output in file write speed of 018 MBs/sec. After tuning, file write speed was enhanced to 0.6 MBs/sec but still fails to satisfy the performance expectation. The number of newly secured free chunks was 520 resulting in enhanced resource effectiveness before tuning, but decreased to 33 after tuning, which, with the unsatisfactory file write speed, eventually led to failed test result.
As shown in Table 7, after tuning, 14 tests, which were determined as passed, are determined as failed.

(a) File Write Speed (Number of Empty Blocks, Before Tuning: 1% → After Tuning: 25%)

(b) File Write Speed (T_TC_1_7 ~ T_TC_1_10)

(c) Monitoring Point of File Write Speed (Number of Empty Blocks, Before Tuning: 1% → After Tuning: 25%)
(d) Monitoring Point of File Write Speed (T_TC_1_7~T_TC_1_10)
Figure 6. Before vs. after tuning.
For adjusting tuning point values for the source code of YAFFS2, the number of empty blocks setting 1 to the aggressive variable was tuned to 25%, 50%, and 75% of NAND memory capacity. As shown in Table 7, it was concluded that the file write speed was best optimized before tuning. It is because the subject test, YAFFS2
Table 7. Failed tests.
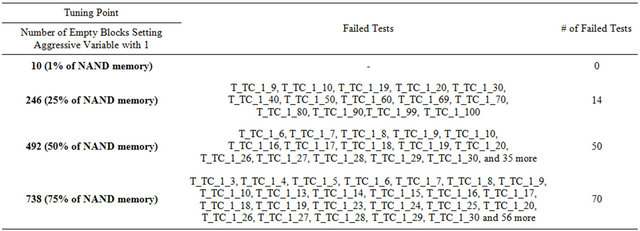
was an optimized distribution version.
4.2.3. Threats of Validity
In this case study, not only performance testing but also the analysis of tradeoff of YAFFS2 were performed. Although it was endeavored to draw out tradeoffs based on the existing studies and data on performance of YAFFS2, the analysis of tradeoffs on more professional basis with SW architects is still desired. Also, for there are comparatively less performance testing items on YAFFS2, more various test subjects are needed to be tested and analyzed to strengthen the external validity.
5. Conclusions and Future Work
In this paper, methods for developing a performance test were suggested using T-workflow diagram, monitoring point, and tuning point based on tradeoffs. The key to the suggested methods was verifying test items as well as their side-effects to improve the degree of completion of a performance test. For this, performance attributes in tradeoff-relationships are included as performance indices by analyzing tradeoffs of the architectural decisions. Also, T-workflow is developed to apply the existing white-box test coverage criteria so that performance tests can be developed better. Through these methods, the evaluation of performance test results can be improved and the cause of performance degradation can be analyzed.
The suggested plan was applied to YAFFS2, a NAND flash memory file system, to illustrate a case study. The results show that some test data, previously determined as failed, was actually not too quickly to be judged as a failure. When tested by T-workflow, the failed data improves the validity of other performance attributes. Also, for test cases with performance degradation, the measured values of monitoring point can be used to help the analysis of the cause of the degradation. The values showed that performance degradation was due to the tradeoffs.
To improve a SW’s performance, generally the number of threads was increased or the hardware operating the SW was adjusted. However, in this paper, it was shown that the SW performance can be optimized by adjusting the tuning point under various conditions.
At present, we are performing the suggested T-workdflow based tests on other different SWs beside YAFFS2. SA tradeoffs were used as criteria of building test cases of a performance test. However, as there are also tradeoffs on technical side of SWs, T-workflow can also be used for technical tests. In the future, effectiveness of identifying problems and weaknesses and analyzing their cause through T-workflow covering tests will be shown for technical tests as well.
6. Acknowledgements
This research was supported in part by the Samsung Electronics Co., Ltd., 2010-2011.
REFERENCES
- F. Mattiello-Francisco, E. Martins, A. R. Cavalli and E. T. Yano, “InRob: An Approach for Testing Interoperability and Robustness of Real-Time Embedded Softwarem,” Journal of Systems and Software, Vol. 85, No. 1, 2011, pp. 3-15.
- S. Balsamo, P. Inverardi and C. Mangano, “An Approach to Performance Evaluation of Software Architectures,” Proceedings of the 1st International Workshop on Software and Performance, Sata Fe, 12-16 October 1998, pp. 178-190. doi:10.1145/287318.287354
- F. Aquilani, S. Balsamo and P. Inverardi, “Performance Analysis at the Software Architectural Design Level, Performance Evaluation,” Vol. 45, No. 4, 2001, pp. 147-178.
- E. J. Weyuker and F. I. Vokolos, “Experience with Performance Testing of Software Systems: Issues, an Approach, and Case Study, Software Engineering,” IEEE Transactions on Software Engineering, Vol. 26, No. 12, 2000, pp. 1147-1156.
- R. Kazman, M. Klein, M. Barbacci, T. Longstaff, H. Lipson and J. Carriere, “The Architecture Tradeoff Analysis Method,” Proceedings of the 4th International Conference on Engineering of Complex Computer Systems (ICECCS ’98), Monterey, 10-14 August 1998, pp. 68-78.
- C. W. Ho and L. Williams, “Deriving Performance Requirements and Test Cases with the Performance Refinement and Evolution Model (PREM),” North Carolina State University, Raleigh, 2006, Technical Report No. TR-2006-30.
- F. I. Vokolos and E. J. Weyuker, “Performance Testing of Software Systems,” Proceedings of the 1st International Workshop on Software and Performance, Sata Fe, 12-16 October 1998, pp. 80-87. doi:10.1145/287318.287337
- D. Draheim, J. Grundy, J. Hosking, C. Lutteroth and G. Weber, “Realistic Load Testing of Web Applications,” Proceedings of the 10th European Conference on Software Maintenance and Reengineering (CSMR ‘06), Bari, 22-24 March 2006, pp. 57-70.
- Y. Y. Gu and Y. J. Ge, “Search-Based Performance Testing of Applications with Composite Services,” International Conference on Web Information Systems and Mining, Shanghai, 7-8 November 2009, pp. 320-324. doi:10.1109/WISM.2009.73
- C. D. Grosso, G. Antoniol, M. Di Penta, P. Galinier and E. Merlo, “Improving Network Applications Security: A New Heuristic to Generate Stress Testing Data,” In: Proceedings of the 2005 Conference on Genetic and Evolutionary Computation (GECCO ‘05), Hans-Georg Beyer, Ed., ACM, New York, pp. 1037-1043.
- C. U. Smith, “Performance Engineering of Software Systems,” Addison-Wesley, Boston, 1990.
- http://www.yaffs.net/
- IEEE Standard Glossary of Software Engineering Terminology.
NOTES
*Corresponding author.