Journal of Software Engineering and Applications
Vol. 5 No. 8 (2012) , Article ID: 21948 , 6 pages DOI:10.4236/jsea.2012.58065
Regionalization of Rainfall Using RCDA Cluster Ensemble Algorithm in India
![]()
1IASRI (ICAR), New Delhi, India; 2Department of Civil Engineering, Indian Institute of Technology, New Delhi, India.
Email: reach2san@yahoo.com, dhanya@civil.iitd.ac.in
Received May 31st, 2012; revised July 3rd, 2012; accepted July 13th, 2012
Keywords: K-Means; Cluster Ensemble; Hydrology; Silhouette Coefficient; Runoff; Hydrometeorology; Precipitation; Rainfall
ABSTRACT
The magnitude and frequency of precipitation is of great significance in the field of hydrologic and hydraulic design and has wide applications in varied areas. However, the availability of precipitation data is limited to a few areas, where the rain gauges are successfully and efficiently installed. The magnitude and frequency of precipitation in ungauged sites can be assessed by grouping areas with similar characteristics. The procedure of grouping of areas having similar behaviour is termed as Regionalization. In this paper, RCDA cluster ensemble algorithm is employed to identify the homogeneous regions of rainfall in India. Cluster ensemble methods are commonly used to enhance the quality of clustering by combining multiple clustering schemes to produce a more robust scheme delivering similar homogeneous regions. The goal is to identify, analyse and describe hydrologically similar regions using RCDA cluster ensemble algorithm. RCDA cluster ensemble algorithm, which is based on discriminant analysis. The algorithm takes H base clustering schemes each with K clusters, obtained by any clustering method, as input and constructs discriminant function for each one of them. Subsequently, all the data tuples are predicted using H discriminant functions for cluster membership. Tuples with consistent predictions are assigned to the clusters, while tuples with inconsistent predictions are analyzed further and either assigned to clusters or declared as noise. RCDA algorithm has been compared with Best of K-means and Clue cluster ensemble of R software using traditional clustering quality measures. Further, domain knowledge based comparison has also been performed. All the results are encouraging and indicate better regionalization of the rainfall in different parts of India.
1. Introduction
Identification and analysis of magnitude and frequency of rainfall of any country plays significant contribution in Agriculture and Hydrometeorology.
The magnitude and frequency of precipitation in ungauged sites can be assessed by grouping areas with similar characteristics. Regionalization is defined as the procedure of grouping of areas having similar hydrological behaviour. Regionalization of rainfall in different parts of the country is very challenging task. Scarcity and abundance of rainfall (precipitation) should be monitored to avoid conditions such as drought, cyclones etc. Statistical evidence is needed to identify the homogeneous regions of rainfall in India.
All the atmospheric and environmental factors are not under human control, by utilization of strong statistical evidences through analysing the rainfall with slightly human interventions if we can protect the water resources, it will be very beneficial.
2. Background and Related Work
We present the related work with respect to two aspects i.e. the techniques used for regionalization in hydrology studies and the techniques of cluster ensemble. Subsequently we describe the discriminant based cluster ensemble.
2.1. Regionalization
Regionalization of precipitation has been done by using the traditional method of non-hierarchical clustering i.e. K-means clustering. Validation indices are utilized for finding the optimum number of clusters. Heterogeneous regions are extracting after the K-means clustering by homogeneity test [1].
Authors in paper [2] give the interpolation method proposed by Shepard (1968) for rainfall analysis based upon the distance between the station and the grid point and also observed the directional effects. Standard quality controls were performed before carrying out the interpolation analysis.
Regionalization of precipitation is done by linkage analysis [3,4]. Spatial correlation analysis has been utilized for identification of homogeneous regions [5]. The concept of empirical orthogonal function analysis has been used for computation of regionalization [6]. The principal component analysis (PCA) and cluster analysis has been utilized for identification of the regions [7,8].
2.2. Cluster Ensemble Approach
Motivation of Cluster Ensemble technique arises because of different clustering schemes that are obtained by application of different clustering algorithms, or by varying the parameters of the same clustering algorithm. For example, in k-means algorithm, which is one of the most used clustering algorithms, variations in results arise because of the inherent randomization.
Further, each algorithm performs differently depending upon the biases and assumptions associated with it.
Under such circumstances, it is very difficult to ascertain suitability of an algorithm for an application. Cluster ensemble techniques aims to improve the clustering scheme by intelligently combining multiple schemes. This technique has caught attention of researchers in computer science community as it has found to substantially improve the robustness, stability, accuracy and quality of resulting clustering scheme [9-13]. An informative survey of various cluster ensemble techniques can be found in [9]. The problem of cluster ensemble is formally defined below.
Let D denote a data set of N, d-dimensional vectors  where i = 1, N, each representing an object. D is subjected to a clustering algorithm which delivers a partition (i.e. a clustering scheme) π′ consisting of K clusters, i.e. (
 ). Let λ′ be the function of π; (
 ) that yields labeling for each of the N objects in D.
Let  be H partitions of D obtained by applying either same clustering algorithm on D or by applying H different clustering algorithms.
Before combining the schemes, it is necessary to establish the correspondence between the clusters of different schemes and relabel the corresponding clusters. Let  be the set of corresponding labeling of H clustering schemes on D. The problem of cluster ensemble is to derive a consensus function Γ, which combines H partitions and delivers a clustering πf with a promise that πf is more robust than any of constituent H partitions and best captures the natural structures in D. Figure 1 shows the process of construction of cluster ensemble. It is the design of Γ that distinguishes different cluster ensemble algorithms to a large extent. Hypergraph partitioning. voting approach [14], mutual information [9,15], coassociations [16-18] are some of the well-established approaches for building consensus functions.
2.3. RCDA (Robust Clustering Using Discriminant Analysis)
RCDA [19] is a recent algorithm for generating a robust clustering scheme using discriminant analysis. Robust Clustering Using Discriminant Analysis (RCDA) algorithm takes H partitions as input with K clusters in each partition and delivers a robust partition with same number of clusters, and noise, if any. It operates in three phases.
In the first phase clusters in each partition are relabeled to establish correspondence in H partitions. In the second phase the algorithm constructs a discriminant function for each partition, thereby resulting in H discriminant functions. Cluster label of each tuple in dataset D is predicted by each of the H discriminant functions resulting in N × H label matrix (L). This is a compute intensive phase of the algorithm and needs no user parameter. Finally, in the third phase tuples with consistent labels are assigned to clusters in the final partition. Tuples with low consistency are refined and the leftover tuples are reported as noise.
Different phases of RCDA algorithm is shown pictorially in Figure 2.
3. Regionalization Using RCDA
In this study the hydrological similarity of the rainfall regions have been investigated with respect to their response behavior by using RCDA Cluster Ensemble Algorithm. The goal is to identify, analyse and describe hydrometerologically similar regions.
Since the optimum numbers of regions (clusters) are not known, it has been identified and computed by utilization of Silhouette Coefficient as described in the next section.
4. Optimality of Clusters
Since, the H clustering schemes achieved by original
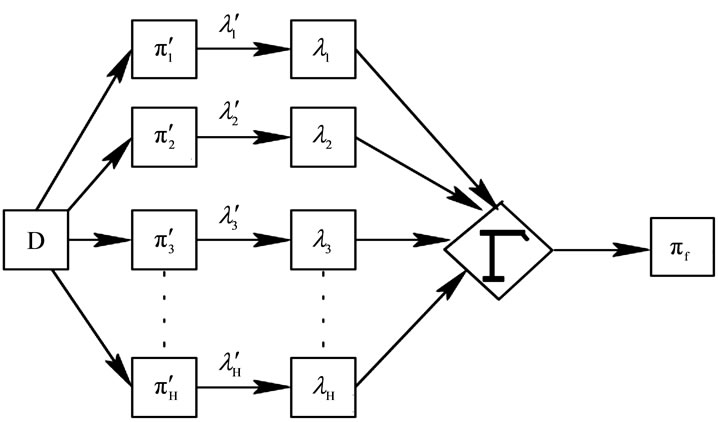
Figure 1. The process of cluster ensemble.
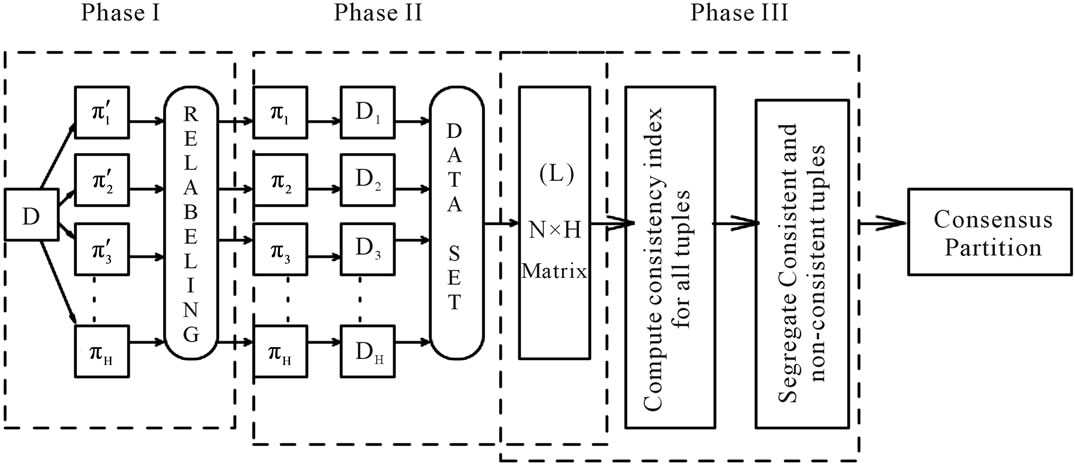
Figure 2. Three phases of RCDA algorithm.
clustering schemes of RCDA algorithm can have different number of clusters. For determining the optimum number of clusters the concept of Silhouette Coefficient has been utilized as described in the section below.
Silhouette Coefficient (SC)
Silhouette coefficient combines both Cohesion and Separation [20].
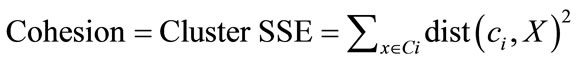
Cohesion measures the closely related objects in a cluster [21]. It is also defined as the similarity of the data points in a cluster to the cluster centroid or average pairwise distance between the data points in a cluster [20].
The average pairwise distance between the data points in cluster is equivalent to the SSE of the cluster.
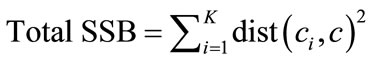
Separation measures how distinct or well separated a cluster from other clusters [21]. The traditional measure of separation between clusters is the between group sum of squares (SSB) which is the sum of the squared distance of a cluster centroid, ci to the overall mean, c, of all the data points.
By summing the SSB over all the clusters, we obtain the total SSB, which is given in Equation (2) where ci is the mean of the ith cluster and c is the overall mean. The higher the total SSB of a clustering, the more separated the clusters are from one another [20].
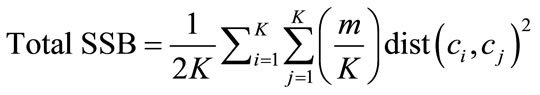
The total SSB is directly related to the pairwise distances between the centroids. If the cluster sizes are equal i.e. mi = m/k and total SSB becomes
A cluster that has a high value of cohesion may be considered best and is an indication of an improvement in the quality of a clustering. We evaluate the objects with in a cluster in terms of their contribution to the overall cohesion or separation of the cluster.
The steps for computing the silhouette coefficient for an individual point are as follows. .
1) For the ith object, calculate the average distance to all other objects in its cluster. Call this value ai.
2) For the ith object and a cluster not containing the object, calculate the object’s average distance to all the objects in the given cluster. Find the minimum such value with respect to all clusters; call this value bi.
3) For the ith object, the silhouette coefficient is
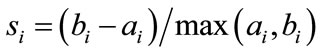 .
.
Silhouette coefficient for the clustering scheme is aggregation of the coefficients of individual points.
5. Experimental Section
RCDA (Robust Clustering Using Discriminant Analysis) algorithm was implemented in Windows environment as multi-threaded C++ program. R package (V 2.13.0) was used for statistical functions. Dual core Intel(R) machine (2.20 GHz, 4 GB RAM) was used for executing prgrams. In this section we describe the goals and methodology of experiments.
We have used the 1 × 1 daily gridded data developed by Indian Meteorological Department (IMD) for the period 1951-2003 (53 years). Daily rainfall data is aggregated into annual data for each grid.
The homogeneous regions identified by Indian Meteorological Department (IMD), using the monsoon rainfall for the period 1871 to 2010 is shown in Figure 3.
However, studies have shown that the regions identified by IMD are heterogeneous (Satyanarayana and Srinivas, 2008).
In this study, RCDA Cluster Ensemble algorithm is employed to identify the homogeneous regions in India.
Analysis is done by RCDA Cluster Ensemble algorithm and the whole Indian region is covered by 355 grids. Optimum number of cluster are determined by using the
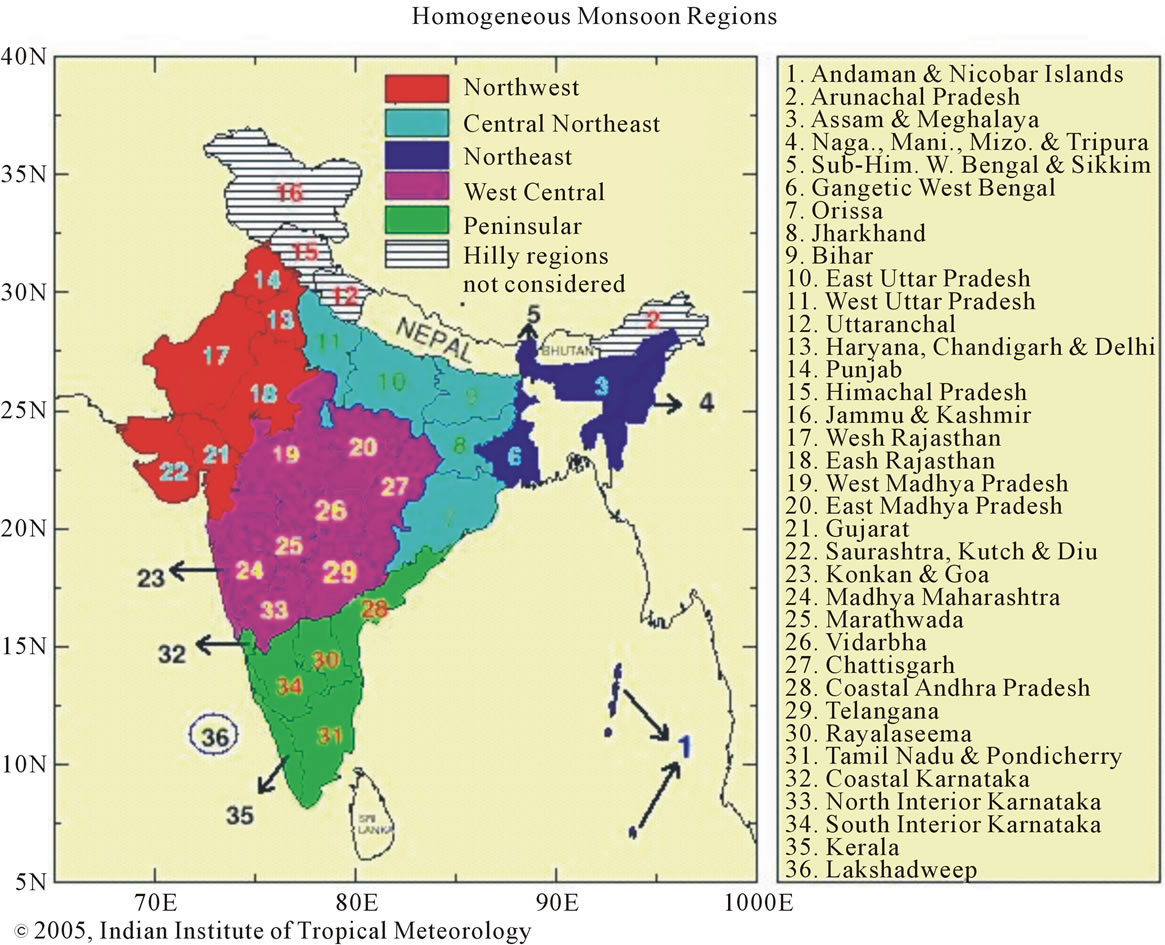
Figure 3. Three homogeneous regions identified by Indian meteorological department using monthly rainfall data for the period 1871 to 2010 (Source: www.tropmet.res.in).
Silhouette coefficient and achieved as 9. The homogeneous regions identified by the RCDA Cluster Ensemble algorithm is shown in Figure 4.
The homogeneous regions achieved in Figure 4 by RCDA Cluster Ensemble algorithm using the 53 years of data.
Cluster ID is shown in color bar. The characteristics of different clusters are shown in Table 1.
The high intensity rainfall regions in North-eastern part is coming under cluster ID 1 and those in Western Ghat regions are assigned a cluster ID 9. Low rainfall areas in Rajasthan region falls under cluster ID 8. Rainfall magnitude gradually increases from eastern part towards western part of India. The results provide strong evidence towards the homogeneity of the rainfall regions and also provide strong evidence towards the heterogeneity of the IMD homogeneous regions.
The optimum number of clusters obtained by RCDA algorithm as 9. The optimum partition from H input partitions is determined as H = 4. The optimum number of clusters and the quality is determined by the Silhouette coefficient (Cohesion and Separation). The Optimum partition is the partition at which we achieved the maximum/best value of quality. The maximum is the quality, the better is the clustering scheme. Comparisons of RCDA Cluster Ensemble algorithm have been done with the Clue
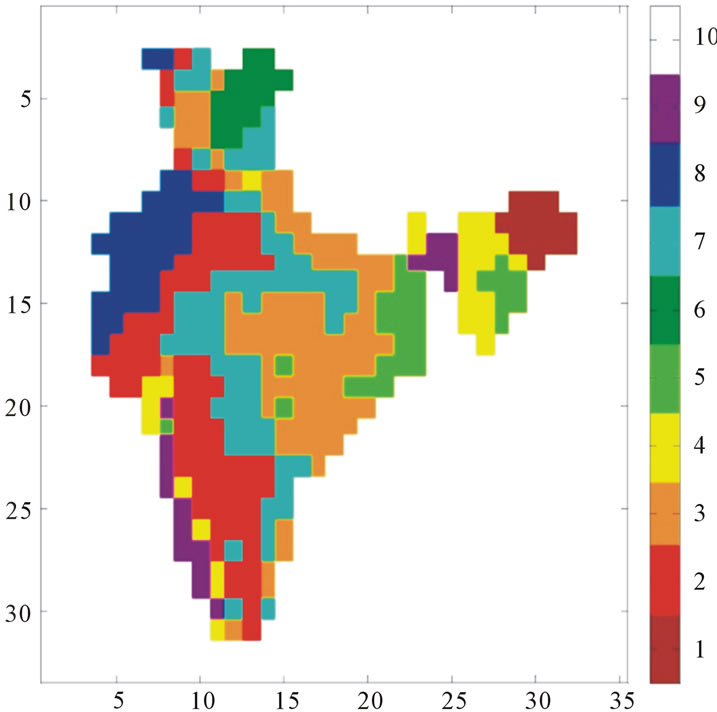
Figure 4. Homogeneous regions identified by RCDA cluster ensemble algorithm.
Cluster Ensemble [22] delivered by R software and Best of K-means algorithm as shown in Figure 5.
Results clearly show improved value of quality as compared to the Clue Cluster Ensemble and Best of
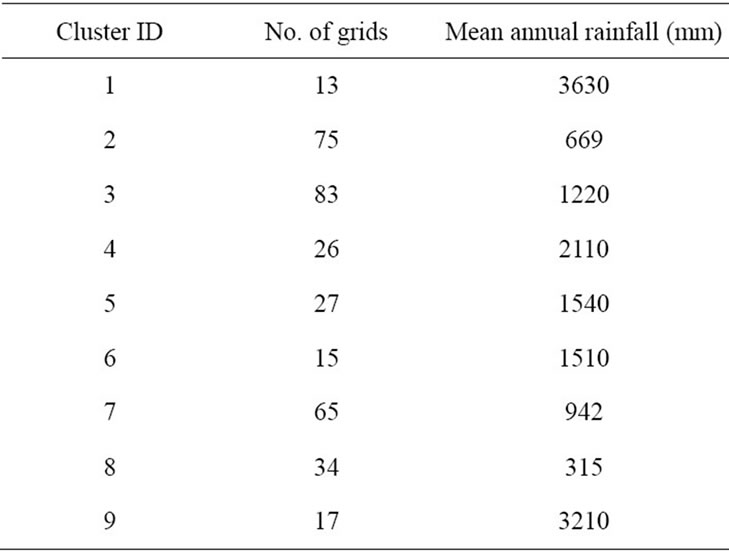
Table 1. Identified cluster ID and mean rainfall.
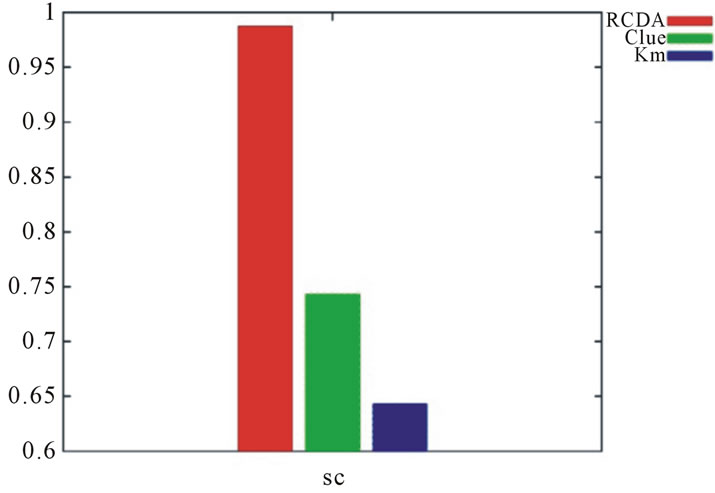
Figure 5. Comparison of silhouette coefficient of RCDA algorithm with clueand best of K-means (Km).
K-means algorithm. Hence best homogeneous regions of rainfall have been identified by RCDA Cluster Ensemble algorithm.
6. Discussion of Results
We observed from the Figure 5 improved value of quality as compared to the Clue Cluster Ensemble and Best of K-means algorithm. Since the basis of any clustering algorithm is judged by its quality and hence best homogeneous regions of rainfall has been achieved by RCDA Cluster Ensemble algorithm.
Figure 4 clearly shows that Rainfall magnitude gradually increases from eastern part towards western part of India. The results provide strong evidence towards the homogeneity of the rainfall regions by RCDA Cluster Ensemble algorithm.
REFERENCES
- P. Satyanarayana and V. V. Srinivas, “Regional Frequency Analysis of Precipitation Using Large-Scale Atmospheric Variables,” Journal of Geophysical Research, Vol. 113, No. D24, 2008, 16 p. doi:10.1029/2008JD010412
- M. Rajeevan, J. Bhate and J. D. Kale, “A High Resolution Daily Gridded Rainfall Data for the Indian Region: Analysis of Break and Active Monsoon Spells,” Current Science, Vol. 91, No. 3, 2006, pp. 296-306.
- I. J. Jackson, “Inter-Station Rainfall Correlation under Tropical Conditions,” Catena 1, Elsevier, University of New England, Armidale, 1973, pp. 235-256.
- M. Bonell and G. Sumner, “Autumn and Winter Daily Precipitation Areas in Wales, 1982-1983 to 1986-1987,” International Journal of Climatology, Vol. 12, No. 1, 1992, pp. 77-102. doi:10.1002/joc.3370120108
- D. Sharon, “The Distribution in Space of Local Rainfall in the Namib Desert,” International Journal of Climatology, Vol. 1, No. 1, 1981, pp. 69-75. doi:10.1002/joc.3370010108
- H. S. Bedi and M. M. S. Bindra, “Principal Components of Monsoon Rainfall,” Tellus, Vol. 1, No. 32, 1980, pp. 296-298.
- K. K. Singh and S. V. Singh, “Space Time Variation and Regionalization of Seasonal and Monthly Summer Monsoon Rainfall of the Sub-Himalayan Region and Gangetic Plains of India,” Inter-Research Climate-Research, Vol. 6, 1996, pp. 251-262. doi:10.3354/cr006251
- D. R. Easterling, “Regionalization of Thunderstorm Rainfall in the Contiguous United States,” International Journal of Climatology, Vol. 9, No. 6, 1989, pp. 567-579. doi:10.1002/joc.3370090603
- Md. R. Ghaemi, H. I. N. Sulaiman and N. Mustapha, “A survey: Clustering Ensembles Techniques,” Proceedings of World Academy of Science, Engineering and Technology, Vol. 38, No. 2, 2002, pp. 2070-3740.
- X. Hu and I. Yoo, “Cluster Ensemble and Its Applications in Gene Expression Analysis,” Proceedings of 2nd AsiaPacific Bioinformatics Conference, Dunedin, 18-22 January 2004, pp. 297-302.
- A. Topchy, A. B. Minaei-Bidgoli and W. F. Punch, “Adaptive Clustering Ensembles,” Proceedings of the 17th International Conference on Pattern Recognition, Vol. 1, 2004, pp. 272-275. doi:10.1109/ICPR.2004.1334105
- A. Topchy and W. Punch, “A Mixture Model for Clustering Ensembles,” Proceedings SIAM Conference on Data Mining, Nashville, 13-16 June 2004, pp. 379-390.
- M. D. Frossyniotis and A. Stafylopatis, “A Multi-Clustering Fusion Algorithm,” Methods and Applications of Artificial Intelligence, Springer, Berlin, Vol. 2, No. 2, 2002.
- B. Fischer and J. M. Buhmann, “Path-Based Clustering for Grouping of Smooth Curves and Texture Segmentation,” IEEE Transaction on Pattern Analysis and Machine Intelligence, Vol. 25, No. 4, 2003, pp. 513-518. doi:10.1109/TPAMI.2003.1190577
- A. Strehl and J. Ghosh, “Cluster Ensembles—A Knowledge Reuse Framework for Combining Multiple Partitions,” Journal of Machine Learning Research, Vol. 3, 2002, pp. 583-617.
- A. L. N. Fred, “Finding Consistent Cluster in Data Partitions,” Proceedings of 2nd International Workshop on Multiple Classifier Systems, Vol. 19, No. 9, 2001, pp. 309-318.
- A. L. N. Fred and A. K. Jain, “Data Clustering Using Evidence Accumulation,” Proceedings of International Conference on Pattern Recognition, Vol. 4, 2002, pp. 276- 280.
- A. Topchy, A. K. Jain and W. Punch, “Combining Multiple Weak Clusterings,” Proceedings of the 3rd IEEE International Conference on Data Mining, Melbourne, 19- 22 November 2003, pp. 331-338. doi:10.1109/ICDM.2003.1250937
- V. Bhatnagar and S. Ahuja, “Robust Clustering Using Discriminant Analysis,” Proceedings of International Industrial Conference on Data Mining. Lecture Notes in Computer Science, Springer, Berlin, 2010, pp. 143-157.
- P. N. Tan, V. Kumar and M. Steinbach, “Introduction to Data Mining,” Pearson, Boston, 2006.
- L. Kaufman and P. Rousseeuw, “Finding Groups in Data an Introduction to Cluster Analysis,” Wiley Interscience, New York, 1990. doi:10.1002/9780470316801
- K. Hornik, 2012. http://cran.rproject.org/web/packages/clue/clue.pdf