Journal of Biomedical Science and Engineering
Vol.6 No.3A(2013), Article ID:29501,9 pages DOI:10.4236/jbise.2013.63A043
Reliability and sensitivity to change of IW-TSE versus DESS magnetic resonance imaging sequences in the assessment of bone marrow lesions in knee osteoarthritis patients: Longitudinal data from the Osteoarthritis Initiative (OAI) cohort*
![]()
1Osteoarthritis Research Unit, University of Montreal Hospital Research Center (CRCHUM), Montreal, Canada
2Department of Rheumatology, University Hospital of Zürich, Zürich, Switzerland
3Imaging Research & Development, ArthroLab Inc., Montreal, Canada
4Department of Radiology, University of Montreal Hospital Centre (CHUM), Montreal, Canada
Email: jp.raynauld@videotron.ca, lukas.wildi@gmx.com, fabram@arthrovision.biz, thomas.moser@umontreal.ca, dr@jppelletier.ca, #jm@martelpelletier.ca
Received 16 January 2013; revised 24 February 2013; accepted 5 March 2013
Keywords: Osteoarthritis; Magnetic Resonance Imaging; Bone Marrow Lesions
ABSTRACT
Background: Bone marrow lesions (BMLs) are associated with osteoarthritis (OA). We assessed the performance of two commonly used MRI sequences, IW-TSE and DESS, for reliability in the detection of BMLs and sensitivity to estimate change over time. We suggested that the IW-TSE would demonstrate higher sensitivity to change than DESS in the assessment of BML prevalence and change over time. This study was performed using a subset of the Osteoarthritis Initiative (OAI) cohort. Methods: A subgroup of 144 patients was selected from the OAI progression cohort who all had IW-TSE and DESS MRI acquisitions at baseline and 24 months. BMLs were assessed using a semi-quantitative scale in the global knee, medial and lateral compartments, and subregions. Intra-reader reliability was assessed on a subset of 51 patients. Results: Intra-reader reliability was substantial for the global knee ≥ 0.64, medial ≥ 0.70, and lateral ≥ 0.63 compartments for IW-TSE and DESS. The prevalence of BML detected at baseline was only slightly greater for IW-TSE compared to DESS. The mean BML score at baseline was significantly higher (p ≤ 0.006) for the IW-TSE than the DESS. However, mean change at 24 months was similar for both sequences for all regions except the medial compartment (p = 0.034) and medial femur (p = 0.015) where they were significantly higher for DESS than IW-TSE. Moreover, the prevalence of BML change at 24 months was similar in all regions except the global knee (p = 0.047) and the lateral tibial plateau (p = 0.031). Conclusion: This study does not suggest superior sensitivity to change of one sequence over the other for almost all the regions. The only difference is a higher BML mean change over time detected by the DESS sequence in the medial compartment and femur. These data bring into perspective that both sequences seem equivalent regarding their use for the assessment of BML in clinical trials.
1. INTRODUCTION
In magnetic resonance imaging (MRI) assessment of knee osteoarthritis (OA), subchondral bone has frequently been found to be the site of signal alterations reflecting the presence of lesions. These lesions were first thought to be only bone marrow edema, as they showed hypersignal in water-sensitive-weighted sequences [1]. Notably, the same lesions could also be identified using a number of other sequences including T1-weighted sequences reflecting a more structural than edematous process [2-5]. Therefore, the original terminology “bone marrow edema” was over time replaced by the more descriptive term “bone marrow lesion” or BML [6,7]. These OA lesions may decrease in size, persist, increase in size, or be converted into cysts over time [5].
BMLs were found to be associated with the progression of knee OA structural changes [3,4,8-10], knee pain [4,7,9-14], cartilage loss [3,4,8,9,15], and appear to increase the risk for total knee replacement [16,17]. Whether these lesions are causative for cartilage loss or merely a consequence is not yet known.
Conflicting opinions remain about BMLs and their significance. This may reflect the lack of complete knowledge regarding the nature of the lesions observed with different MR sequences. A recent study in hip OA correlating MRI with histopathology findings revealed a number of changes such as true bone edema, fibrosis, necrosis, subchondral fractures and cysts, all of which appear relatively similar in MR images [18]. Several patterns were differentiated by subtle variations in signal intensity at 1.5 Tesla spin echo including T1-weighted, fat saturated (FS) T2-weighted, and post contrast T1- weighted without FS spin echo sequences. Some reports [10,19-21] suggest that for a better contrast definition of BMLs, specific MR acquisition sequences, especially water-sensitive sequences should be used preferentially while the use of T1-weighted sequences is advocated to better delineate bone cysts [5]. However, ideally both T1- and water-sensitive sequences should be performed to completely appreciate the global joint structure. Yet, in the context of clinical trials this would increase the examination time, which has proven to decrease patient compliance as it results in increased incidence of failed examinations and dropout rate due to significant knee pain impeding prolonged joint immobilization. One might therefore question whether steady state gradient echo sequences with mixed T1/T2* weighting might be a reliable and practical compromise for gathering information on both cartilage and BMLs at the same time.
A recent publication on cross-sectional findings in knee OA patients using the same MRI protocol as the Osteoarthritis Initiative (OAI) showed that BMLs appear larger in the water-sensitive intermediate-weighted turbo spin echo (IW-TSE) sequence compared to the findings obtained by using the dual echo steady state (DESS) [5]. However, to date, there has been no head-to-head comparative study done in a sufficiently large OA patient population assessing BMLs with different MR sequences acquired during the same exam. The performance of a steady state gradient echo sequence vs. a water-sensitive intermediate-weighted sequence for their reliability in the detection of BMLs and their sensitivity to estimate change over time is still in debate. Our hypothesis suggests that the IW-TSE sequence had a higher sensitivity to change in the assessment of BMLs. To this end, we compared the BML prevalence and their change over time using the IW-TSE and DESS MRI sequences from a subset of patients from the Osteoarthritis Initiative (OAI) cohort (public data sets).
2. PATIENTS AND METHODS
Data used for this study were obtained from the OAI database, which is publicly available at http://www.oai.ucsf.edu/. Specific image data sets consist of a sample of participants extracted from the initial “progression” OAI sub-cohort, which consists of individuals with symptomatic and radiologic knee OA at the beginning of the study. The Group B, 3.B.1 (Variable V03, IMAGESB = 3), was chosen for the experiment. From this cohort (n = 160), the left knees of (n = 148) patients were selected as they had both IW-TSE and DESS sets of MRI acquisitions at baseline and 24 months follow-up. Of note, the left knee was systematically analyzed whether or not it was the index knee for the OAI study. Four subjects were excluded due to poor quality of at least one image in the IW-TSE and DESS at baseline and at 24 months. Therefore, 144 patients were studied. All had symptomatic knee OA [22] and structural pathology (definite tibiofemoral osteophyte, grade 1 - 3, from baseline radiographic image clinic reading) in one or both knees at enrolment. These 144 patients had mean age 61.3 ± 9.8 (SD), mean BMI 30.0 ± 4.3 (SD), and 51.4% were female. The Kellgren-Lawrence (KL) score, as on the OAI website, ranged from 0 - 4.
2.1. MRI Acquisitions
All knee MRI acquisitions were performed as described per the OAI protocol [23] using 3.0 T apparatus (Magnetom Trio, Siemens, Erlangen, Germany) at four (of note, two centers were further merged) separate centres. The acquisition protocol began with a three-plane localizer, followed by a sagittal IW-TSE (TR/TE, 3200/30 ms; flip angle, 180 degrees; slice thickness/gap, 3/0 mm; excitation number, 1; matrix size, 448 × 313; field of view, 160 mm; resolution, 0.357/0.511 mm; receiver bandwidth, 248 Hz/pixel; phase direction, S/I). MR images were also acquired using a DESS imaging protocol with sagittal slices (TR/TE, 16.3/4.7 ms; flip angle, 25 degrees; slice thickness/gap, 0.7/0 mm; excitation number, 1; matrix size, 384 × 307; field of view, 140 mm; resolution, 0.365/0.456 mm; receiver bandwidth, 248 Hz/pixel; phase direction, S/I). The DESS sequence, like the commonly used T1-weighted fast low angle shot (FLASH) and spoiled gradient recalled echo (SPGR) sequences, has been shown to provide accurate and precise analysis of cartilage morphology in the tibiofemoral joint at 3.0 T, yet it also shows a superior fluid/tissue contrast owing to its mixed T1/T2* weighting.
2.2. BML Scoring
BMLs were assessed as previously described [4,24]. When the BML was visualized in several MR slices, such lesion was then evaluated where it appeared the largest. The widest size of each lesion was taken along the bone articular surface and compared to the corresponding size of the bone for the region of interest. In the case of several lesions, the sum of each size was used. A scale from 0 to 3 was used, where 0 = absence, 1 ≤ 25%, 2 = 25% to 50%, and 3 ≥ 50%, based on the extent of regional involvement. The regions were chosen as for the WORMS scoring system described by Peterfy et al. [24] with minor modifications being that the subspinal section between the two tibial plateaus was not included, nor were the tibial plateaus subdivided. The subdivision of the tibial plateau is dependent on the position of the menisci which could vary over time, resulting in imprecision of measurement, hence lower accuracy of the reading. The anterior, central, and posterior femoral subregions and the tibial plateau were added and combined according to their medial aspect and summed up to yield the medial compartment. For the lateral compartment, as the posterior femoral subregions exhibited no BML for all patients, this subregion was discarded. The compartments were also combined to yield a global knee value. The maximum possible scores were 6 for the global tibia, 9 for the medial femur, 6 for the lateral femur, 12 for the medial compartment, 9 for the lateral compartment, and 15 for the global femur. The maximum global knee score was 21.
Intra-reader reliability was assessed from randomly selected patients and read at an interval of two to four weeks. Fifty-one patients were selected for the reliability phase of the study. We selected the first 25 subjects within the progression cohort in a complete random fashion from such dataset (with or without presence of BML at baseline). However, more than 75% of these had no BML, making this intra-reading phase of our study somewhat biased toward greater reproducibility. Then, 26 additional subjects were further selected from the cohort who had presence of BML at baseline with diverse scores to better assess reliability using a full spectrum of disease status. The reliability portion of the study was blinded to patient identification. All MRI acquisitions from the 144 patients from baseline and 24 months were scored by an expert reader who has over 10 years of experience in the field and was trained to assess BMLs from both IW-TSE and DESS MR images by a musculoskeletal radiologist with 25 years of training experience. BMLs were scored according to the different knee regions as described above. The score was also used to establish the presence or absence of a BML (0 = absence, >0 = presence) within a specific knee region. Change in a lesion over time was computed as the score difference between 24 month follow-up and baseline. A positive sign indicates progression of the lesion score.
2.3. Statistical Analyses
Intra-reader agreement statistical relevance was assessed using Cohen’s weighted kappa, where <0 indicates no agreement and 0 - 0.20 slight, 0.21 - 0.40 fair, 0.41 - 0.60 moderate, 0.61 - 0.80 substantial, and 0.81 - 1 almost perfect agreement [25]. An intra-correlation coefficient for the greater value ranges such as the global knee was not performed since the data were not normally distributed and skewed toward small values. Differences in the BML prevalence (presence or absence) in IW-TSE vs. DESS sequences were assessed by Fisher’s exact test, a test similar to the Chi square test for categorical data, and the prevalence of change by the Chi square test. BML scores at baseline and 24 months, as well as the change at 24 months between the two MR sequences, were assessed using the Wilcoxon signed rank test, a non-parametric test. Prevalence of BMLs according to the KL score at baseline was assessed using a Chi square test for such contingency for both sequences. The sensitivity to change was expressed as standard response mean (SRM) [26], the advantage of which lies in its independence of sample sizes and the direct comparability of the values obtained through different tools. All tests were two-sided, and a p ≤ 0.05 was considered statistically significant. All statistical analyses were done using SPSS Statistics software, version 19 (IBM Corporation, Somers, NY, USA).
3. RESULTS
3.1. Intra-Reader Reliability of BML Scores
Intra-reader reliability for both IW-TSE and DESS was substantial for the IW-TSE sequence for the global knee and values were 0.64, for the medial compartment 0.73, and for the lateral compartment 0.63; for the DESS sequence values of 0.67, 0.70, and 0.66 were obtained, respectively. The intra-reader reliability was also substantial to moderate for the regions/subregions of the knee, ranging for the IW-TSE from 0.74 to 0.53 and for the DESS from 0.78 to 0.58.
3.2. Prevalence of BMLs at Baseline
The prevalence of BMLs detected at baseline in the global knee was almost identical for the IW-TSE and DESS (80.6% vs. 79.2%) (Figure 1). Likewise, the same similarities were seen for the medial compartment (70.1% vs. 68.1%) and the lateral compartment (53.5% vs. 48.6%). The prevalence of BMLs was similar in all the other knee subregions, but a slightly higher prevalence was seen in the medial plateau with the DESS than with the IW-TSE: 34.7% and 30.6% respectively. However, there was no statistically significant difference between the DESS and IW-TSE as assessed by the Fisher’s exact test.
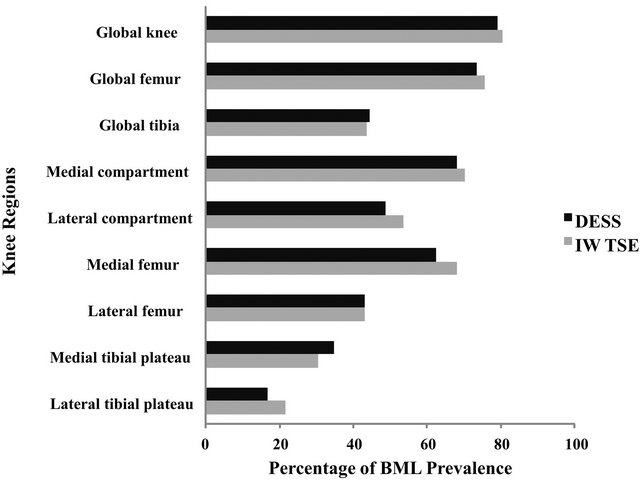
Figure 1. Histogram of the prevalence of BMLs at baseline for the global knee and regions/subregions. All knee region and subregion % comparisons between DESS and IW-TSE were not statistically significant as evaluated with Fisher’s exact test.
3.3. BML Scores
In assessing the same BMLs in the two different MR sequences acquired at exactly the same position at baseline and 24 months (Figure 2), DESS yielded images in which the BML appeared smaller than in the IW-TSE. This specific lesion at baseline, for instance, was assigned a score of 2 (25% - 50% of the respective joint surface) using the DESS sequence and a score of 3 (>50%) using the IW-TSE. The 24 months follow-up revealed that the BML extent was clearly reduced in comparison to baseline in the IW-TSE. The appearance of cysts, which was clearer in the DESS sequence as reported but not specifically assessed during BML reading, demonstrated structural change in the subchondral bone. The mean BML score at baseline (Table 1) was systematically lower for the DESS than the IW-TSE sequence for the global knee, the compartments, and the subregions, with all being statistically significant (Wilcoxon signed rank test).
Interestingly, mean changes in BML score at 24 months were similar for most regions (Table 1), but statistically significant higher score differences were seen for the DESS in the medial compartment (p = 0.034) and medial femur (p = 0.015) (Wilcoxon signed rank test), with a trend toward a higher score in the IW-TSE in the lateral tibial plateau (p = 0.069).
The median value score changes were virtually identical for all knee subregions regardless of the MR sequence analyzed (Table 1). When assessing the median score change, a change of a full score of 1 was only seen
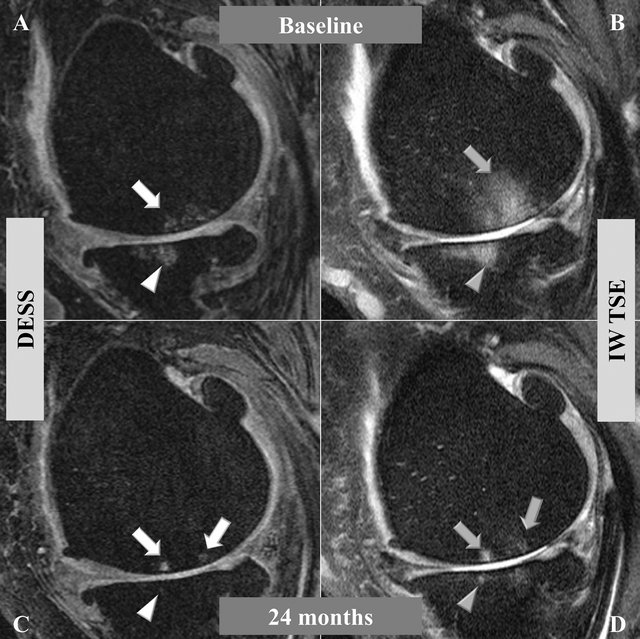
Figure 2. Bone marrow lesions (BML) comparing two MRI sequences in which images were obtained at the exact same position in the medial central condyle of the left knee at baseline (A) and (B) and 24 months (C) and (D). (A) and (C) were acquired with a dual echo steady state sequence (DESS), and (B) and (D) with an intermediate weighted turbo spin echo sequence (IW-TSE). In the DESS ((A), white arrow) the extent of BML is smaller than in the IW-TSE ((B), grey arrow). In both (C) and (D) the BML area is reduced in comparison to the baseline, while the centers of the lesions increased in intensity reflecting subchondral cysts and a remnant of a BML in both sequences. The evolution of BMLs into cysts can also be observed in the tibial plateau (arrow heads).
Table 1. Comparison of bone marrow lesion scores at baseline and 24 months.
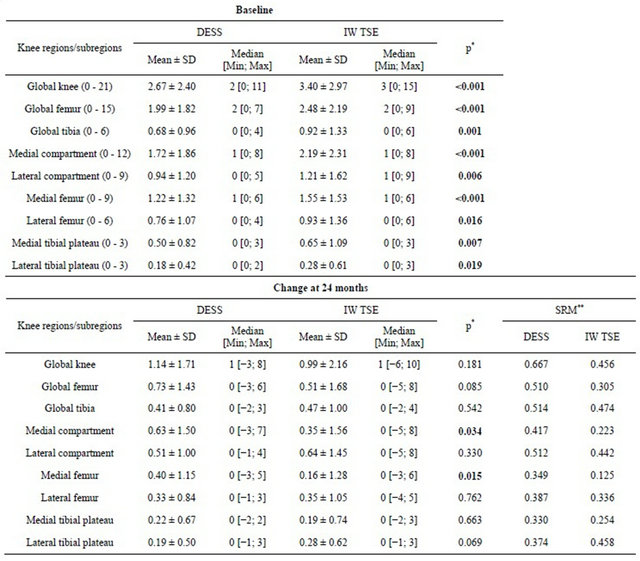
*Wilcoxon signed rank test, **SRM: Standardized Response Mean.
for the global knee in both the IW-TSE and DESS.
All knee regions/subregions yielded better SRM for BML scores in the DESS sequence vs. IW-TSE except for the lateral tibial plateau (Table 1; 0.374 DESS vs. 0.458 IW-TSE). Interestingly, as seen in Table 2, a significant trend toward greater prevalence of BML with a greater KL score at baseline was found.
3.4. Prevalence of Increase, Stability, or Decrease in Change in BMLs over Time
In addition, we also evaluated the prevalence of change in BML score over 24 months (increase, stable, or decrease) (Figure 3 and Table 3). For the global knee, femur and tibia as well as medial compartment, medial femur, and lateral tibial plateau, the BML prevalence
Table 2. Correlation between the Kellgren-Lawrence radiological score at baseline and the prevalence of BML for the global knee.
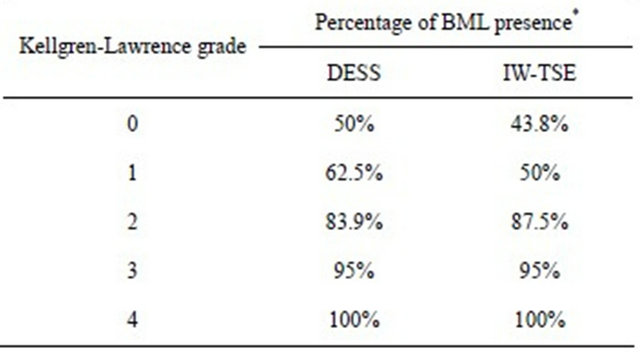
*Chi square of 35.0, p < 0.001 for the DESS sequence and Chi square of 22.2, p = 0.002 for the IW-TSE sequence.
Table 3. Prevalence of bone marrow lesion score change from baseline to 24 months.
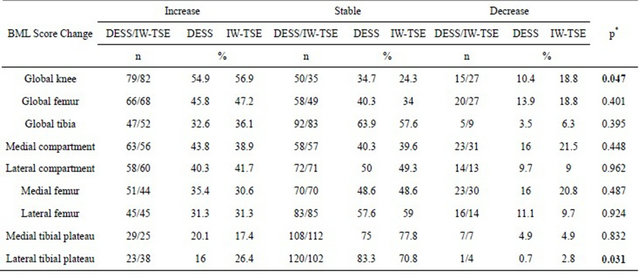
*Chi square.
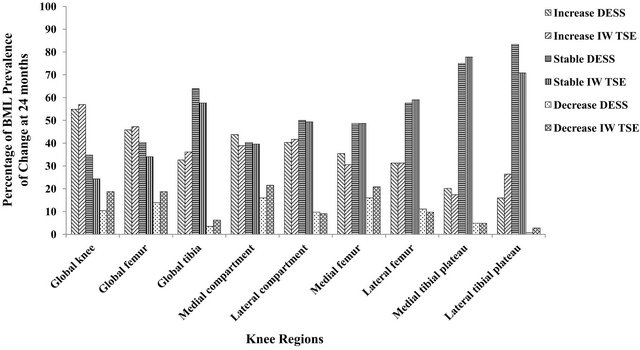
Figure 3. Histogram of the BML score prevalence of increase, absence, and decrease of change at 24 months.
detected with the DESS images was less inclined to decrease over time compared to the IW-TSE. For the global knee, IW-TSE showed a higher number and percentage of decrease in the prevalence of BMLs than the DESS (p = 0.047, Chi square test). This was also seen for the other regions/subregions except for the lateral compartment, femur, and medial tibial plateau. The prevalence of increase in BML was slightly higher for the DESS in the medial compartment, femur and tibia and for the IWTSE in the lateral tibia, the latter being the only subregion other than the global knee that revealed overall statistical significance (p = 0.031, Chi square test).
4. DISCUSSION
This head-to-head study in knee OA patients compared the reliability, prevalence, and sensitivity to change of a BML scoring system contrasting two different types of commonly used MRI sequences, the water-sensitive IWTSE and the DESS. A recent study has reported such a comparison; however, this was done only cross-sectionally and change in BML size over time, which is a most relevant question, was not addressed [5]. Data from this study are in agreement with the previous one in which the IW-TSE sequence had a stronger signal toward BML and hence higher scores could be seen at any given time. The two sequences were systematically used per protocol and design since the inception of this OA initiative. The DESS sequence reflects more structural changes within the knee structure while the IW-TSE reflects more of the inflammatory/edematous process. Indeed, the IW-TSE sequence yields a darker bone where “edema” shows lesser brightness than DESS. As such, discrimination between bone edema vs. a bone cyst is more difficult with IW-TSE than DESS. The complementary nature of these two sequences may eventually provide for a better understanding of these lesions from information obtained from clinical trials in which BML is a predictor or an outcome variable.
However, the question remained, particularly in the context of clinical trials, as to the sensitivity to change of each of these sequences to assess changes in BMLs over time. The present study further revealed that neither of these two MRI sequences demonstrated statistically significant differences in the assessment of BML overall prevalence or, even more importantly, their change over time. Moreover, comparison between these sequences demonstrated that for BML assessment, the use of a steady state gradient sequence such as DESS, which has superior spatial resolution and signal to noise ratio results in better delineation of cystic and edema subchondral lesions as represented by lower standard deviation and hence higher SRMs (Table 1).
By using a water-sensitive sequence, the BMLs, which have increased water content, will be perceived as brighter and larger. However, it should also be expected that such fuzzy lesion brightness from an IW-TSE sequence would be subject to greater change if compared to the regional bone surface of the respective slice and therefore could be a less reliable marker to follow over time. The results of the present study indicate that compared to the DESS sequence, the greatest change seen with the IW-TSE was an increase in the lateral tibial plateau but, surprisingly, a decrease in most other regions/ subregions (Table 3), which in turn could impact the capability to detect a treatment effect on BMLs over time in the context of a DMOAD clinical trial.
Such data contrast with the belief based on findings from observational studies that water-sensitive sequences are superior to T1-weighted sequences for BML scoring over time [20,27]. Therefore, it has been suggested that both MRI acquisitions should be performed to fully evaluate the cartilage and the bone and surrounding tissues. However, this approach has limitations as it would increase the acquisition time. Such long acquisition periods would be inconvenient for many patients enrolled in clinical trials, as it could increase the risk of patient movement leading to poor image quality and to the need for repeated MR acquisitions, which in turn would add up to the cost of longitudinal trials not to mention the impact on the dropout rate. The present findings thus have practical and economic implications for future OA clinical trials. A T1/T2*-weighted steady state gradient echo sequence such as the DESS may suffice to effectively assess BML presence and score change over time if a sequence such as the IW-TSE is not available.
Changes in BML prevalence were seen in many knee regions/subregions but most were non-statistically significant probably due to a lack of statistical power among patients. Of note, no a priori calculation of power analysis was done as this is a post-hoc analysis of the OAI data. Nonetheless, these results revealed the importance of selecting the knee regions/subregions if one wishes to evaluate the impact of a DMOAD. Progression of structural changes is very heterogeneous throughout the knee joint and may in fact preclude the use of BMLs as an outright outcome to assess treatments. Accordingly, designing a study where BML presence or score progression would be used as the only primary outcome for a DMOAD trial would seem very hazardous.
The present study, as with any other, has limitations. First, in order to have both sequence acquisitions from baseline and 24 month follow-up for the same patients, a fairly small portion of the large OAI cohort had to be used for this comparative study. According to the power calculation, the number of patients needed to claim non-inferiority for the global knee at a level of 5% and the prevalence at 80% for the IW-TSE is 1584 patients. Presently, the number of patients that have an MRI at baseline and 24 months for the two sequences for the progression cohort is 1025 patients. Of note, at the time of this study inception only 160 were available. However, even using the entire cohort and assuming that all the MRI are acceptable for the BML determination, we would still not reach the number of patients needed. Such work may be repeated in the future with a larger patient cohort.
Secondly, the patient selection for the OAI had less stringent criteria compared to clinical trials. Previous work clearly demonstrated that the progression cohort from the OAI included younger patients with less knee pain at entry and, more importantly, had less cartilage volume loss, almost half (−1.9% loss of cartilage at 1 year in the medial compartment) [28] of what is seen in clinical trials [3,29]. It is therefore logical to assume that the BMLs observed in these OAI patients may be less prevalent and of smaller size than those seen in patients in clinical trials [3,29]. Moreover, in this study, we did not include the symptom information, and thus cannot extrapolate for BML presence/change over time and knee symptoms. Our data showing greater prevalence of BMLs in patients with a higher KL score at baseline clearly reflect this issue. However, this would not change the overall conclusion of this study that there is no superior sensitivity of one sequence over the other in the assessment of BML prevalence and mean change over time in almost all regions/subregions and BMLs can be evaluated with the same reliability regardless of which of the two MR sequences (IW-TSE or DESS) is used.
Thirdly, when assessing the progression of the BMLs over time, we did not consider the impact of patient demographics or other structural knee tissue damage such as cartilage damage and meniscal extrusion that could potentially affect the presence of the BMLs and their change over time. Another limitation was that only one experienced reader assessed the MR images as another reader was simply not available at the time of our study. Finally, the large standard deviations in all the BML scores at baseline and longitudinal follow-up for both MR sequences are probably related to the heterogeneity among patients’ disease progression and the relative imprecision of a semi-quantitative scoring.
5. CONCLUSION
This is the first report of a direct longitudinal comparison of the assessment of BML changes between IW-TSE and DESS MRI sequences in knee OA patients. This study did not suggest a superior sensitivity to change of one sequence over the other in the assessment of BML prevalence and their changes over time. It is therefore possible to speculate that with a T1/T2*-weighted sequence that shows a fluid/tissue contrast superior to the commonly used FLASH or SPGR sequences could help to more reliably detect treatment response according to a more homogeneous signal progression. This finding is of obvious importance, particularly in the context of clinical DMOAD trials.
6. ACKNOWLEDGEMENTS
The authors thank André Pelletier (AP) for the MRI reading and Dr. Marie-Josée Berthiaume (MJB), a musculoskeletal radiologist with 25 years of experience, for the training of AP in reading the BML in the MRI images from both DESS and IW-TSE sequences. The authors are also grateful to Virginia Wallis for her assistance with the manuscript preparation.
![]()
![]()
REFERENCES
- Wilson, A.J., Murphy, W.A., Hardy, D.C., et al. (1988) Transient osteoporosis: Transient bone marrow edema? Radiology, 167, 757-760.
- Carrino, J.A., Blum, J., Parellada, J.A., et al. (2006) MRI of bone marrow edema-like signal in the pathogenesis of subchondral cysts. Osteoarthritis and Cartilage, 14, 1081- 1085. doi:10.1016/j.joca.2006.05.011
- Raynauld, J.P., Martel-Pelletier, J., Berthiaume, M.J., et al. (2008) Correlation between bone lesion changes and cartilage volume loss in patients with osteoarthritis of the knee as assessed by quantitative magnetic resonance imaging over a 24-month period. Annals of the Rheumatic Diseases, 67, 683-688. doi:10.1136/ard.2007.073023
- Wildi, L.M., Raynauld, J.P., Martel-Pelletier, J., et al. (2010) Relationship between bone marrow lesions, cartilage loss, and pain in knee osteoarthritis: Results from a randomised controlled clinical trial using MRI. Annals of the Rheumatic Diseases, 69, 2118-2124. doi:10.1136/ard.2009.127993
- Hayashi, D., Guermazi, A., Kwoh, C.K., et al. (2011) Semiquantitative assessment of subchondral bone marrow edema-like lesions and subchondral cysts of the knee at 3T MRI: A comparison between intermediate-weighted fatsuppressed spin echo and Dual Echo Steady State sequences. BMC Musculoskeletal Disorders, 12, 198. doi:10.1186/1471-2474-12-198
- Beltran, J. and Shankman, S. (1994) Magnetic resonance imaging of bone marrow disorders of the knee. Magnetic Resonance Imaging Clinics of North America, 2, 463- 473.
- Felson, D.T., Chaisson, C.E., Hill, C.L., et al. (2001) The association of bone marrow lesions with pain in knee osteoarthritis. Annals of Internal Medicine, 134, 541-549.
- Felson, D.T., McLaughlin, S., Goggins, J., et al. (2003) Bone marrow edema and its relation to progression of knee osteoarthritis. Annals of Internal Medicine, 139, 330- 336.
- Hunter, D.J., Zhang, Y., Niu, J., et al. (2006) Increase in bone marrow lesions associated with cartilage loss: A longitudinal magnetic resonance imaging study of knee osteoarthritis. Arthritis and Rheumatism, 54, 1529-1535. doi:10.1002/art.21789
- Roemer, F.W., Guermazi, A., Javaid, M.K., et al. (2009) Change in MRI-detected subchondral bone marrow lesions is associated with cartilage loss: The MOST Study. A longitudinal multicentre study of knee osteoarthritis. Annals of the Rheumatic Diseases, 68, 1461-1465. doi:10.1136/ard.2008.096834
- Sowers, M.F., Hayes, C., Jamadar, D., et al. (2003) Magnetic resonance-detected subchondral bone marrow and cartilage defect characteristics associated with pain and X-ray-defined knee osteoarthritis. Osteoarthritis and Cartilage, 11, 387-393. doi:10.1016/S1063-4584(03)00080-3
- Kornaat, P.R., Kloppenburg, M., Sharma, R., et al. (2007) Bone marrow edema-like lesions change in volume in the majority of patients with osteoarthritis; associations with clinical features. European Radiology, 17, 3073-3078. doi:10.1007/s00330-007-0711-1
- Davies-Tuck, M.L., Wluka, A.E., Wang, Y., et al. (2009) The natural history of bone marrow lesions in community-based adults with no clinical knee osteoarthritis. Annals of the Rheumatic Diseases, 68, 904-908. doi:10.1136/ard.2008.092973
- Lo, G.H., McAlindon, T.E., Niu, J., et al. (2009) Bone marrow lesions and joint effusion are strongly and independently associated with weight-bearing pain in knee osteoarthritis: Data from the osteoarthritis initiative. Osteoarthritis and Cartilage, 17, 1562-1569. doi:10.1016/j.joca.2009.06.006
- Raynauld, J.P., Martel-Pelletier, J., Berthiaume, M.J., et al. (2006) Long term evaluation of disease progression through the quantitative magnetic resonance imaging of symptomatic knee osteoarthritis patients: Correlation with clinical symptoms and radiographic changes. Arthritis Research & Therapy, 8, R21. doi:10.1186/ar1875
- Scher, C., Craig, J. and Nelson, F. (2008) Bone marrow edema in the knee in osteoarthrosis and association with total knee arthroplasty within a three-year follow-up. Skeletal Radiology, 37, 609-617. doi:10.1007/s00256-008-0504-x
- Tanamas, S.K., Wluka, A.E., Pelletier, J.-P., et al. (2010) Bone marrow lesions in people with knee osteoarthritis predict progression of disease and joint replacement: A longitudinal study. Rheumatology (Oxford), 49, 2413-2419. doi:10.1093/rheumatology/keq286
- Leydet-Quilici, H., Le Corroller, T., Bouvier, C., et al. (2010) Advanced hip osteoarthritis: Magnetic resonance imaging aspects and histopathology correlations. Osteoarthritis and Cartilage, 18, 1429-1435. doi:10.1016/j.joca.2010.08.008
- Mirowitz, S.A., Apicella, P., Reinus, W.R., et al. (1994) MR imaging of bone marrow lesions: Relative conspicuousness on T1-weighted, fat-suppressed T2-weighted, and STIR images. American Journal of Roentgenology, 162, 215-221. doi:10.2214/ajr.162.1.8273669
- Eckstein, F., Burstein, D. and Link, T.M. (2006) Quantitative MRI of cartilage and bone: Degenerative changes in osteoarthritis. NMR in Biomedicine, 19, 822-854. doi:10.1002/nbm.1063
- Roemer, F.W., Frobell, R., Hunter, D.J., et al. (2009) MRI-detected subchondral bone marrow signal alterations of the knee joint: Terminology, imaging appearance, relevance and radiological differential diagnosis. Osteoarthritis and Cartilage, 17, 1115-1131. doi:10.1016/j.joca.2009.03.012
- Altman, R., Asch, E., Bloch, D., et al. (1986) Development of criteria for the classification and reporting of osteoarthritis. Classification of osteoarthritis of the knee. Diagnostic and Therapeutic Criteria Committee of the American Rheumatism Association. Arthritis and Rheumatism, 29, 1039-1049. doi:10.1002/art.1780290816
- Peterfy, C.G., Gold, G., Eckstein, F., et al. (2006) MRI protocols for whole-organ assessment of the knee in osteoarthritis. Osteoarthritis and Cartilage, 14, A95-A111. doi:10.1016/j.joca.2006.02.029
- Peterfy, C.G., Guermazi, A., Zaim, S., et al. (2004) Wholeorgan magnetic resonance imaging score (WORMS) of the knee in osteoarthritis. Osteoarthritis and Cartilage, 12, 177-190. doi:10.1016/j.joca.2003.11.003
- Landis, J.R. and Koch, G.G. (1977) The measurement of observer agreement for categorical data. Biometrics, 33, 159-174. doi:10.2307/2529310
- Stratford, P.W. and Riddle, D.L. (2005) Assessing sensitivity to change: Choosing the appropriate change coefficient. Health and Quality of Life Outcomes, 3, 23. doi:10.1186/1477-7525-3-23
- Roemer, F.W., Hunter, D.J. and Guermazi, A. (2009) MRI-based semiquantitative assessment of subchondral bone marrow lesions in osteoarthritis research. Osteoarthritis and Cartilage, 17, 414-415; author reply 416- 417. doi:10.1016/j.joca.2008.07.019
- Eckstein, F., Maschek, S., Wirth, W., et al. (2009) One year change of knee cartilage morphology in the first release of participants from the osteoarthritis initiative progression subcohort: Association with sex, body mass index, symptoms and radiographic osteoarthritis status. Annals of the Rheumatic Diseases, 68, 674-679. doi:10.1136/ard.2008.089904
- Raynauld, J.P., Martel-Pelletier, J., Bias, P., et al. (2009) Protective effects of licofelone, a 5-lipoxygenase and cyclo-oxygenase inhibitor, versus naproxen on cartilage loss in knee osteoarthritis: A first multicentre clinical trial using quantitative MRI. Annals of the Rheumatic Diseases, 68, 938-947. doi:10.1136/ard.2008.088732
LIST OF ABBREVIATIONS
MRI = Magnetic Resonance Imaging;
OA = Osteoarthritis;
BML = Bone Marrow Lesion;
DMOAD = Disease-Modifying Osteoarthritis Drug;
FS = Fat Saturated;
OAI = Osteoarthritis Initiative;
IW-TSE = Intermediate-Weighted Turbo Spin Echo;
DESS = Dual Echo Steady State;
BMI = Body Mass Index;
FLASH = Fast Low Angle Shot;
SPGR = Spoiled Gradient Recalled Echo;
NOTES
*Competing Interests: JPR and TM are consultants for ArthroLab Inc., JMP and JPP are owners of ArthroLab Inc., FA is an employee of ArthroLab Inc., LMW has no competing interest.
#Corresponding author.