Journal of Biomedical Science and Engineering
Vol.5 No.2(2012), Article ID:17633,12 pages DOI:10.4236/jbise.2012.52010
Is nonlinear model predictive control with fuzzy predictive model proper for managing the blood glucose level in typeI diabetes?
![]()
1Young Researcher Club, Central Tehran Branch, Islamic Azad University, Tehran, Iran
2Department of Biomedical Engineering, Tehran University, Tehran, Iran
Email: Mahmadi838@gmail.com, Amir_j73@yahoo.com
Received 24 July 2011; revised 1 September 2011; accepted 19 October 2011
Keywords: Diabetes; Delay of Insulin-Glucose Regulatory System; Blood Glucose Level; Nonlinear Model Predictive Control
ABSTRACT
In recent decades, due to the increasing risk of diabetes, the measurement and control of the blood sugar is of great importance. In typeI diabetes, because of the lack of insulin secretion, the cells cannot absorb glucose, and thus have a low level of glucose. To control blood glucose, the insulin must be injected to the body. In fact, the injection must be in a completely controlled environment. If the level of the insulin exceeds the physiological limits, it may cause death. This paper presents an online approach to control the blood glucose level using a nonlinear model predictive control. This method, maintains the level of blood glucose concentration within a normal range. Thus, the blood glucose level is measured in each minute and predicted for the next time interval. If that is not in the normal range, amount of the insulin which must be injected will be determined. The proposed control approach includes important features such as model uncertainties and prevents acute decrease in the blood glucose level, and instability. In order to assess performance of the proposed controller, computer simulations have been carried out in Matlab/Simulink. Simulation results will reveal the effectiveness of the proposed nonlinear model predictive controller in adjusting the blood glucose level by injecting required insulin. So if the nutrition of the person decreases instantly, the hypoglycemia does not happen.
1. INTRODUCTION
Diabetes is a group of metabolic diseases, which is known as hyperglycemia. It arises from defects in the insulin secretion, insulin action or both. Diabetes increases the blood glucose level in the fasting blood sugar test to an amount over the normal range (70 - 110 mg/dl). The insulin is produced by beta cells. In diabetics, beta cells are destroyed and the body can’t control the blood glucose level [1]. In this case, blood sugar must be adjusted by injecting the insulin.
Several methods have been proposed to control the blood glucose level. One method obtains a control rule from the input/output values such as insulin/glucose level [1].
In another method, the relationship between the insulin and glucose estimated with a sigmoid curve. In this method controlling rules acquired from the relationship between control variables then applies curve fitting and extracts practically the relationship between them [2].
Furler et al. proposed another method using look up table to find the relationship between inputs and outputs [3]. There are some other methods using PID controllers, which are among the classic controllers. These methods use either trial and error or Ziegler-Nichols algorithms to adjust the parameters. The Ziegler-Nichols method is the best fit for linear systems, but the diabetic model is a nonlinear one, so this method is not applicable, therefore the trial and error method can be chosen. The newest PID controller proposed by Cheng et al. is sensitive to sampling delays, controller malfunctions, and controller loop oscillations [4].
In this paper, a nonlinear model predictive controller has been employed. This controller provides real-time control which used nonlinear model with delays and stability. It presents a control system, which can continuously predict the blood glucose level and inject the insulin in a way that the blood glucose level remains in the normal range, permanently.
Several mathematical models have been proposed for the insulin-glucose regulatory system, additionally. Early models were simply structured and linear, which considered only the insulin and blood glucose. After that, Bergman et al. proposed the first class of minimal models [5]. In these models physiological parameters are used more. In recent years, some other models such as ODE with negative feedback, DDE with one time delay, DDE with periodic time delay, and DDE with two time delays have been introduced. These models not only show the interaction between the insulin and glucose in the body, but have better agreement with physiological data [6]. However, the first three models have some drawbacks, for example some of them they neither model the time delay between the incrementation in blood glucose and insulin secretion nor consider the time delay of liver glucose production. Furthermore, to obtain the periodic oscillation, insulin must be divided into two portions, the plasma insulin and intra-cellular insulin. In the forth model, these problems were resolved [6]. This model, which was proposed by Li and Kaung, models the insulin-glucose regulatory system considering two time delays simultaneously, which were ignored in previous models. The profiles of this model are in more agreement with physiological data [6].
In this article, nonlinear model predictive controller (NMPC) is introduced in Section 2. Nonlinear model predictive control is composed of two models. One model is called plant, which is diabetic model. The other one is called system model, which shows insulin-glucose regulatory system in a normal body. In Section 3 the model proposed by Li, Kaung [6] is modified to reach the diabetic model. Most models which introduce a biological system such as insulin-glucose regulatory system, has some uncertainties. These uncertainties might be due to inaccessibility to the organ, therefore model parameters cannot be defined precisely. To comprise these uncertainties, fuzzy predictive model is used as system model which is described in Section 4, implementation of NMPC is in Section 5 and the results are discussed in Sections 6 and 7. In the end, the paper is concluded in Section 8.
2. NONLINEAR MODEL PREDICTIVE CONTROL
Predictive controllers were first developed by engineers working in industries, in 1970s. Clerke introduced this method to control unstable, non minimum phase, and slow systems [7].
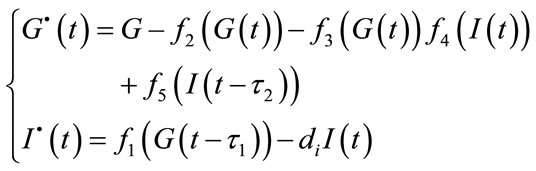
NMPC is formulated to solve on-line a finite horizon optimal control problem according to system dynamics, constraints involving states and controls. Figure 1 demonstrates the basic principle of model predictive control. Based on measurements obtained at time t, the controller predicts the future [7].
Dynamic manner of the system over a prediction horizon Tp and determines the input such that a predetermined performance objective functional is optimized. If there were no model-plant mismatch, and if the optimization problem could be solved for infinite horizons, then one could apply the input function at time t = 0 to the system for all times t ≥ 0. The manipulated input function obtained and it will be implemented only until the next measurement turns into available. The time difference between the recalculation/measurements can vary, however it is presumed to be fixed, the measurement will take place every δ sampling time-units. Using the new measurement at time t + δ, the entire process-prediction and optimization will be repeated to find a new input function with the control and prediction horizons moving forward. As it is shown in Figure 1, the input u is depicted as arbitrary function of time. The calculation of the applied input based on the predicted system behavior allows the inclusion of constraints on states and inputs as well as the optimization of a given cost function.The stabilization problem for a class of systems which introduced by the following nonlinear set of differential Equations [7]:
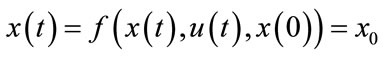 (1)
(1)
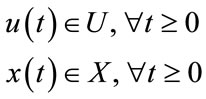
subject to input and state constraints of the form [7]:
 (2)
(2)
x(t) and u(t) represent the vector of states and inputs, respectively. U and X constraints are given in Eq.3 which umin, umax and xmin, xmax are constant vectors [7]:
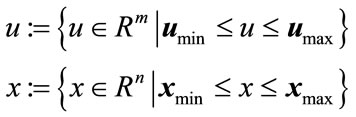 (3)
(3)
In order to make a distinction between the real system and the system model used to predict the future within
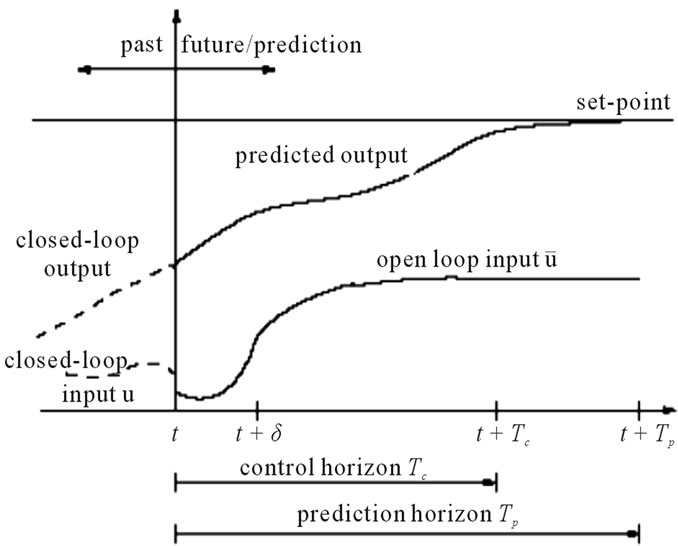
Figure 1. Principle of model predictive control.
the controller, the internal variables in the controller are shown by a bar (for example ). Usually, the finite horizon optimal control problem described above is mathematically formulated as follows [7]:
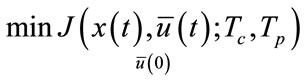 (4)
(4)
 (5)
(5)
The function F, in the following called cost function, specifies the preferred control performance that can arise. The standard quadratic form is the simplest and most often used one:
 (6)
(6)
ud and xd are the desired input and output, respectively. Q and R are symmetric, definite positive and weighting matrices. Tp is the horizon of the predicted output and Tc is the control horizon. In Eq.6 the error between the desired output and model predicted output is obtained. In this method, to obtain the output values in the next time interval, the optimal input values in time period Tc are used, then the value of the control variable, is held constant in the last calculated value [7].
The block diagram of nonlinear model predictive control is shown in Figure 2, which is composed of a system model and plant. In this research, the plant is the diabetic model which is introduced in Section 3 and the system model is the fuzzy model that represented in Section 4. Each of these parameters which are represented in NMPC in this part, will introduce in Sections 3, 4 and 5.
3. DIABETIC MODEL
Since Li, Kaung et al. model describes the insulin-glucose regulatory system in more details and is closer to physiological data [6], this model is chosen, thus, by using this model, typeI diabetes model is proposed.
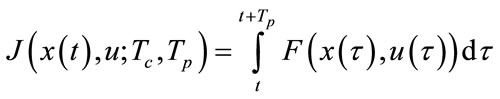
Applying the mass conservation law, Li and Kaung modeled the insulin-glucose regulatory system in Eq.7 [6]. In this model G(t) and I(t) are representatives of glucose and insulin concentration in t time domain (min) [6].
 (7)
(7)
Li and Kaung defined some functions for the process of (consumption) producing insulin and glucose. f1(G) used to stand for the insulin production which is stimulated by glucose concentration. f1(G) has sigmoid shape as follows [6]:
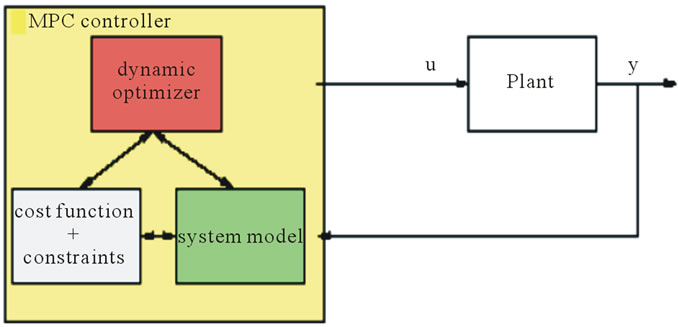
Figure 2. Nonlinear model predictive control block diagram.
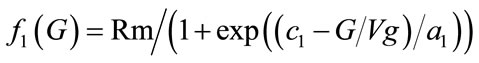 (8)
(8)
The insulin-independent glucose consumers are mainly the brain and nerve cells which is denoted by f2(G) indicating its dependency on the glucose concentration alone. f2(G) > 0 is in sigmoidal shape with f2(0) = 0, and  (x) > 0 is bounded for x > 0 [6].
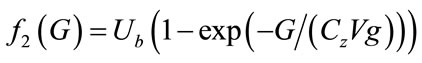 (9)
(9)
Insulin-dependent glucose uptake is denoted by f3(G) f4(I) [6].
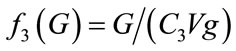 (10)
(10)
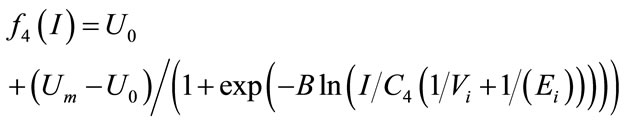 (11)
(11)
Glucose is denoted as f5(I) controlled by insulin concentration [6].
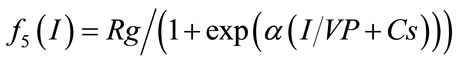 (12)
(12)
Insulin degradation is proportional to insulin concentration which is denoted by positive constant di, glucose infusion rate is a constant, denoted by Gin, τ1 is used to denote the time delay from the time that the glucose concentration level is elevated to the moment the insulin has been secreted and τ2 is measured from the time that insulin becomes remote insulin to the time that a signifycant change of hepatic glucose production take place [6]. After the introduction about the Eq.6, the features of this model and the simulation of it will be described. One of the most important features of this model is the oscillation of blood glucose level and two mentioned time delays. Increment of the first time delay is a sign of diabetes, because the abnormal increase of this time shows that the blood glucose level has increased, but there is no insulin secretion in response. Also accretion of this time delay compared with the natural time delay is a sign of different stages of the diabetes progress. For example a sign of the acute diabetes is the high growth of the time delay, which results in no insulin secretion. The second time delay is due to the delay of liver glucose production and reduction which can cause an increase in the blood glucose level. By considering these descriptions, the diabetic model is designed from the main model (Eq.7). For this reason, at first, by using MATLAB simulink toolbox the proposed model by Li, Kuang was simulated. The results are shown in Figures 4, 5.
The first time delay is of greater importance in the blood glucose level growth and insulin secretion reducetion (which are the diabetes symptoms). To enhance performance of the NMPC controller, the system model and plant should include the features of the insulin-glucose regulatory system and diabetic, in appropriate conformity with physiological data. For this purpose, in this research, the model proposed by Li and Kuang is modified to Eq.15 to achieve diabetes model. Because of that in typeI diabetes, insulin isn’t secreted or produces very slight and τ1 intensely will increase, so Eqs.11 and 12 will change to Eqs.13, 14.
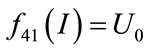 (13)
(13)
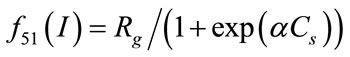 (14)
(14)
Eq.15 is obtained for typeI diabetes. The blood glucose level of a diabetic model (Eq.15) is shown in Figure 7.
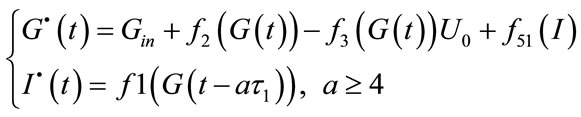 (15)
(15)
The Li, Kaung model is also used to design fuzzy predictive model which represents the system model that will be discussed in Section 4.
4. FUZZY PREDICTIVE MODEL
The fuzzy predictive model is used as the system model in the NMPC controller. The fuzzy system which applies the predictive model is employed for time series includeing a time delay. If this time delay increases, the glucose-insulin regulatory system behavior will be chaotic, which is illustrated in Figures 4, 5. This method (fuzzy predictive model) is used for constructing the fuzzy system. The fuzzy predictive model, f(x), is designed based on lookup table. So, inputs/output pairs must be defined. The inputs of f(x) are  for
for  and the output is
 . n defines the number of inputs. This inputs/output pairs are used to design f(x) with lookup table and then f(x) will be applied to predict
  All the samples of the glucose are divided into 2 parts. The first is assigned to training and the second to prediction.
In this step, the order of the predictive model (n) and the number of membership functions for any input must be determined [8].
The introduced models, however, have uncertainties in the parameter definition, and lacks sufficient knowledge about the insulin-glucose regulatory system. Since each model must show the features of a system in its best style, these uncertainties must be considered. The insulin-glucose system model proposed by Li and Kaung is appropriate, because it describes the insulin-glucose regulatory system more accurately and in a more robust manner, but in this model, uncertainties were not considered. In this paper based on the Li and Kaung model, the fuzzy predictive model of the insulin-glucose regulatory system is designed as well as modeling the characteristics of the system and considers the uncertainties which exist in the model.
The glucose is considered as input-output pairs in each time, by choosing n as 4. Therefore, input-output pairs are four input-one output packages. The singleton fuzzifier and center of averages defuzzifier are used. 1500 samples in the glucose profile exist, so the first 750 samples are used as training input-output pairs, and the remainder for predicting. The fuzzy predictive model is implemented in Matlab.9, 15 fuzzy sets are attributed to each input including 13 triangular membership functions and two trapezoidal as the first and last membership functions. Some of the rules conflict with each other, so they must be pruned. After pruning 113 rules remain.
The prediction accuracy is very important and can be reached by defining more fuzzy sets for each variable. In this section, by using four successive dynamics of glucose, the next dynamic is predicted. So, this model predictive is called as four-point model predictive.
5. IMPLEMENTATION OF NONLINEAR MODEL PREDICTIVE CONTROLLER
To use the NMPC as a blood glucose level controller, the steps which describe the structure of NMPC must be implemented. The input and output of the controller are the amount of the insulin injection and glucose level, respectively. In the insulin-glucose regulatory system, there are two state space; I(t) and G(t). I(t) represents insulin and G(t) indicates blood glucose level concentration. Hence, the state space matrix is a 2 by 1 matrix. Figure 3 shows the implementation of the NMPC controller in MATLAB/SIMULINK. In each run of the simulink, the function F is read and used as an input to the integrator function. The result is called J. The function J can be assumed as the ratio of error variations to injecttion of the insulin. In each run of the program, the injection amount of the insulin is subtracted from the previously injected one and the new injection amount is calculated. Time interval of the integrator is [t, t + Tp]. At the end of each implementation of the program, one unit is added to this interval and the prediction is continued. To control the blood glucose level of a diabetic person, diabetic model (plant) and a model of insulin-glucose interactions (system
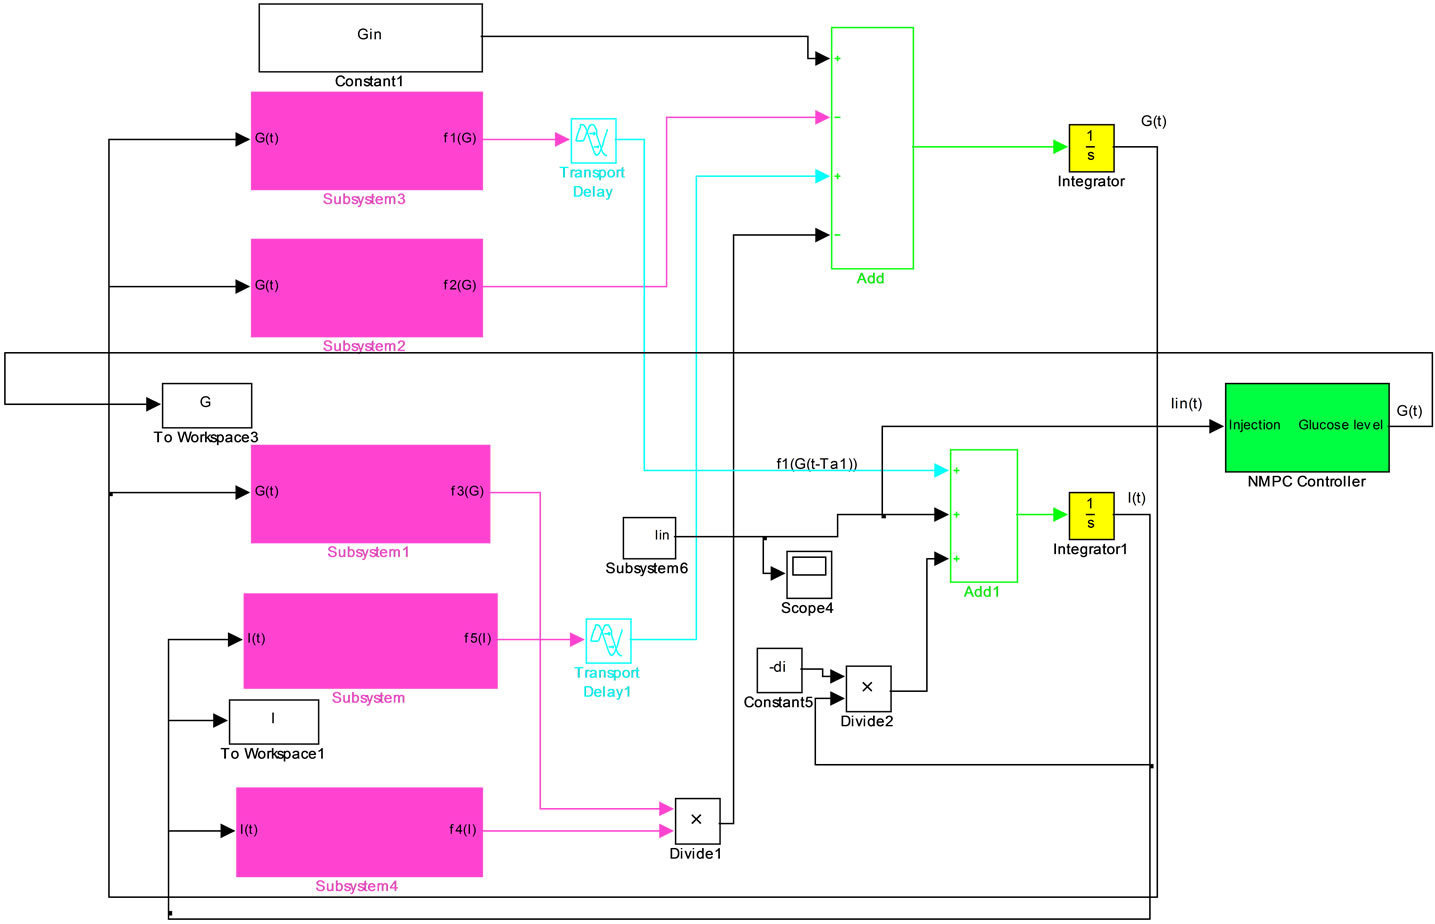
Figure 3. Nonlinear model predictive controller implementation in Matlab/Simulink.
model) is needed. In Section 3, typeI diabetes is modelled and in Section 4, design of the system model is studied.
6. RESULTS
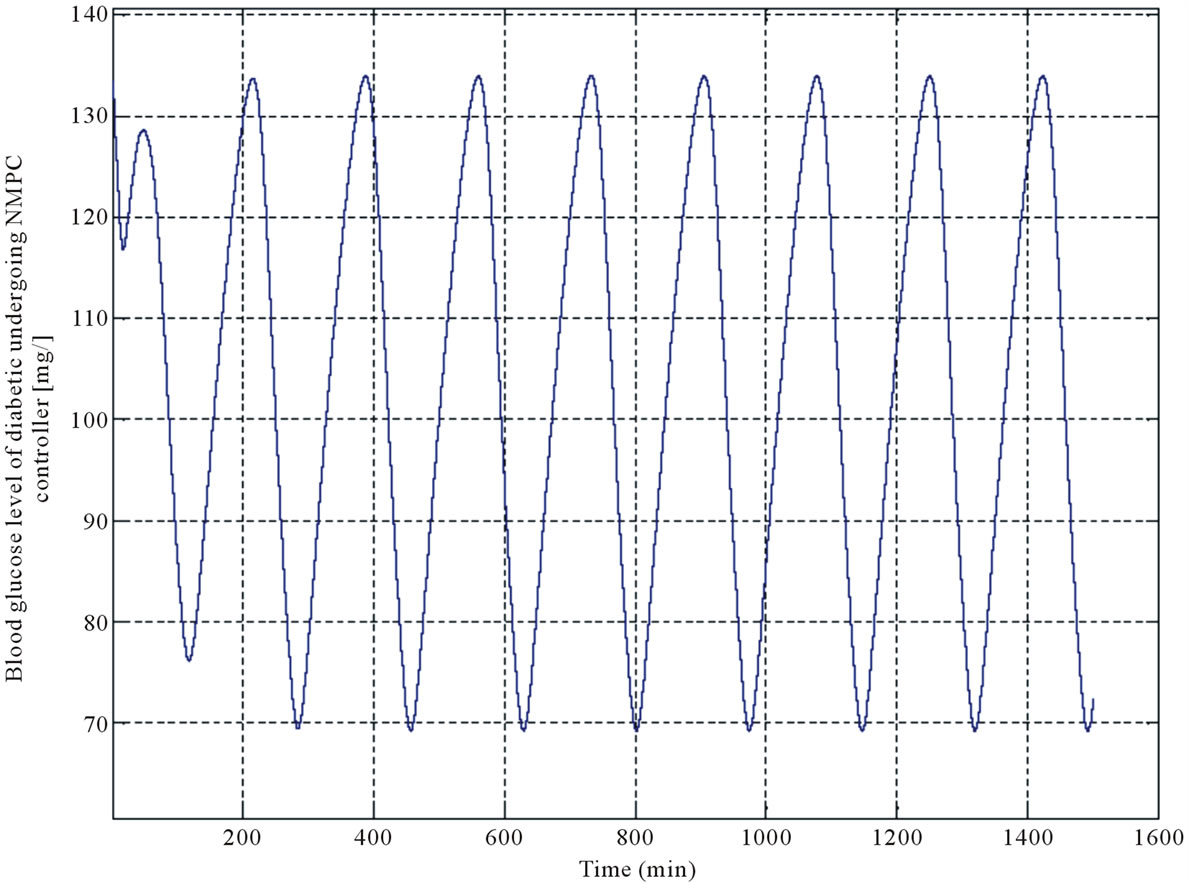
By considering the description in Section 2, the NMPC controller was designed to regulate the blood glucose level in typeI diabetes. As mentioned, the NMPC is composed of the plant and system model. Plant (diabetic model) and fuzzy predictive model (system model) are designed on the basis of the model proposed by Li and Kaung et al. First, the results of the Li and Kaung et al. model are studied. Model simulation which is shown in Figures 4, 5 are the profiles of the blood glucose level and insulin concentration versus variation of the first and second time delays. The results of fuzzy predictive model and diabetic model are shown in Figures 6, 7 respectively. In Figure 6 the red line represents output of designed fuzzy predictive model and the blue line is output of the model which proposed by Li and Kaung et al. Figures 6, 7 demonstrate the blood glucose concentration (mg\dl) versus time. Finally, the result of the NMPC implementation for diabetic model (Figure 7) is depicted in Figure 8(a). in the consequence of applying the proposed controller, the pattern of injecting the insulin is obtained, as in Figure 8(b) and the glucose level of the intended diabetic model (Figure 7) is approximately placed in the normal range, (Figure 8(a)).
As it is shown in Figure 8(b), the blood glucose has an oscillatory behavior. When the blood glucose level of the diabetic person (using NMPC) reaches the normal range (70 - 110), insulin injection must be stopped, and when the blood glucose level is in the descending edge, insulin injection must be decreased. Therefore, hypoglycemic does not happen to diabetic person.
In the next step, a diabetic person who has consumed three meals is regarded as a case to study. Since a diabetic person can just consume 250 - 300 mg/dl carbohydrates per day, each meal is considered to be a pulse with an amplitude of 100 (mg/dl) and a time interval of 45 minutes (Figure 9). The effect of consuming the meals on the same case, is shown in Figure 10. As it is seen, the blood glucose concentration level of the diabetic person is increased and it reaches 270 mg/dl, approximately.
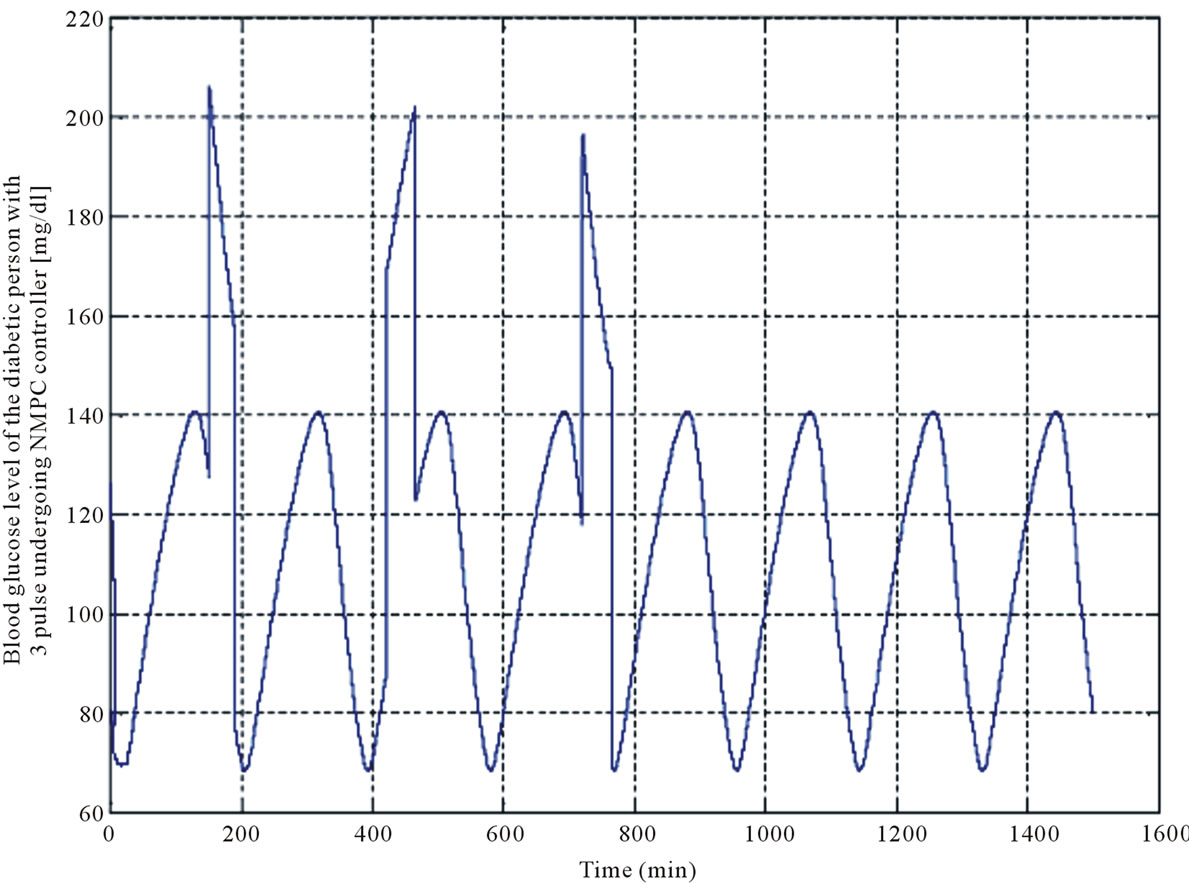
The blood glucose level of the diabetic person under NMPC is shown in Figure 11(a). As diagram shows, a short time after applying the glucose pulses, the insulin injection (Figure 11(b)), causes the blood glucose concentration level of the diabetic person to reach its normal range. In some controllers, decrease of the blood glucose

Figure 4. Bifurcation of glucose and insulin concentration versus τ2.
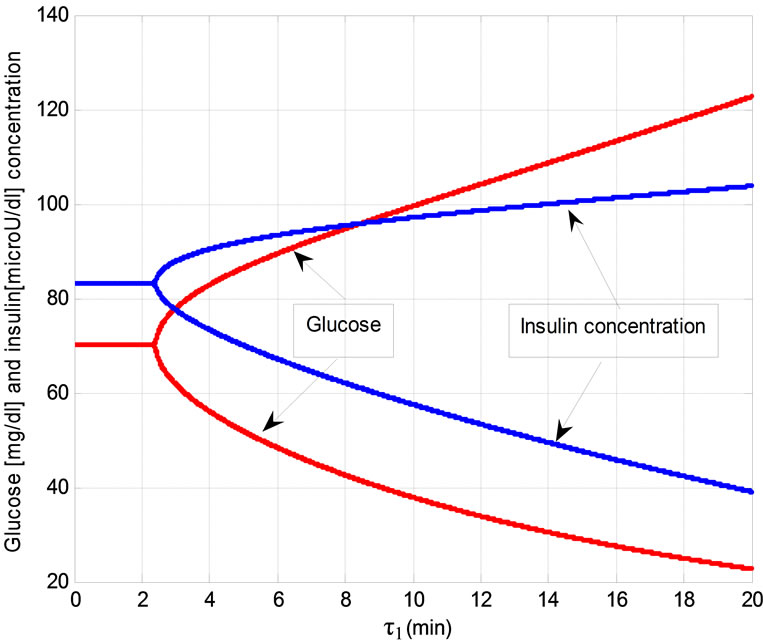
Figure 5. Bifurcation of glucose and insulin concentration versus τ1.
level leads to hypoglycaemia, but it does not happen in real life.
7. DISCUSSION
In this paper, based on the model proposed by Li and Kaung et al., the diabetic model and fuzzy predictive model were developed. First, the simulation results of the Li, Kaung et al. model were studied which were shown in Figures 4, 5 also the results of the fuzzy predictive model and diabetic model were depicted in Figures 6, 7 respectively.
As it is seen in Figure 7, the blood glucose level of a diabetic model is not in the normal range. After applying the NMPC controller, with respect to the measured blood glucose level, the insulin injection rate was defined, so that the blood glucose level of the diabetic person reached its normal range. Figures 4, 5 show the results of simulation of the model proposed by Li and Kaung. The blue and red lines are insulin and glucose concentration, respectively.
If the first and second time delays are 6 and 6.75 minutes, respectively, oscillation of glucose and insulin concentration will be in the normal range. In this system, if these time delays increase over 2.25 and 6.75, bifurcation will occur (Figures 4, 5). Insulin and glucose concentration do not have constant values and they oscillate after mentioned times. After bifurcation, the oscillations of the
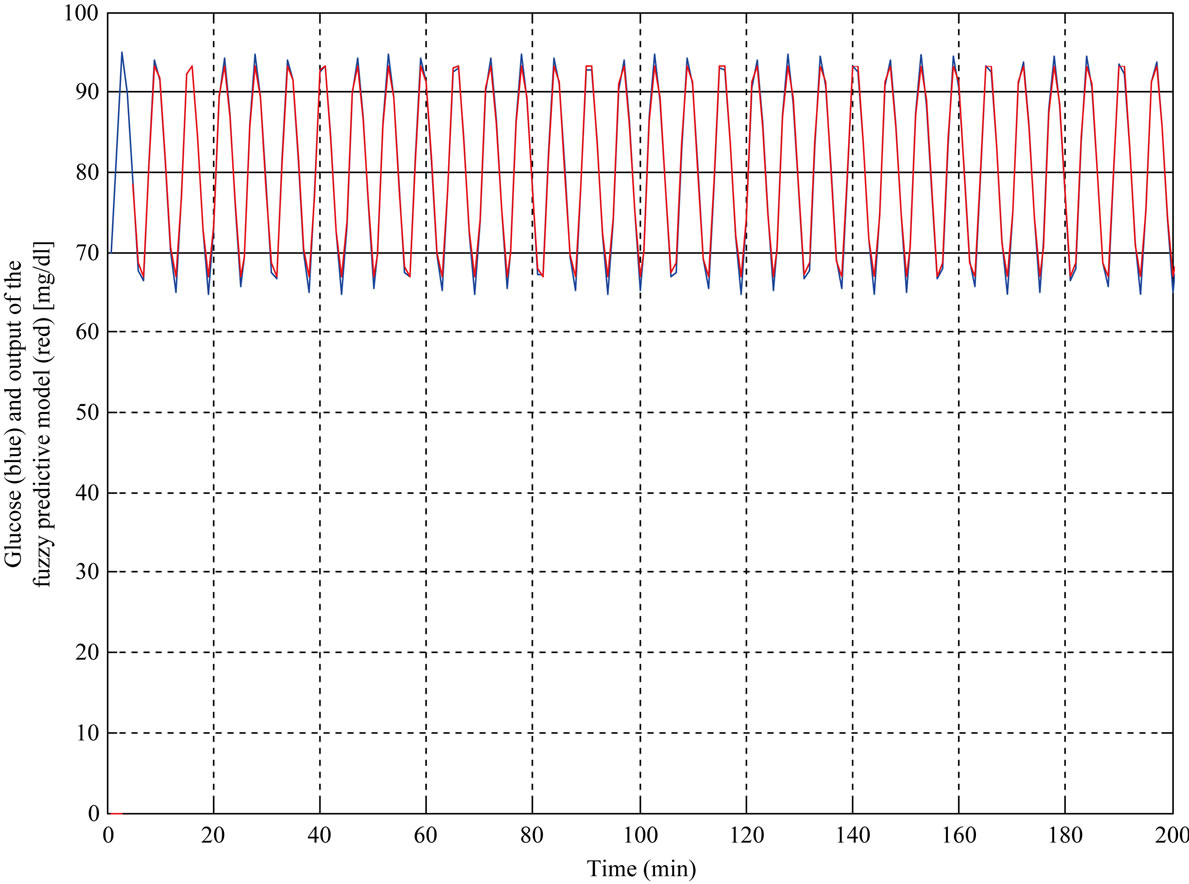
Figure 6. Output of the fuzzy predictive model with 4 points (red line) and blood glucose level of Li and Kaung et al. model (blue line).
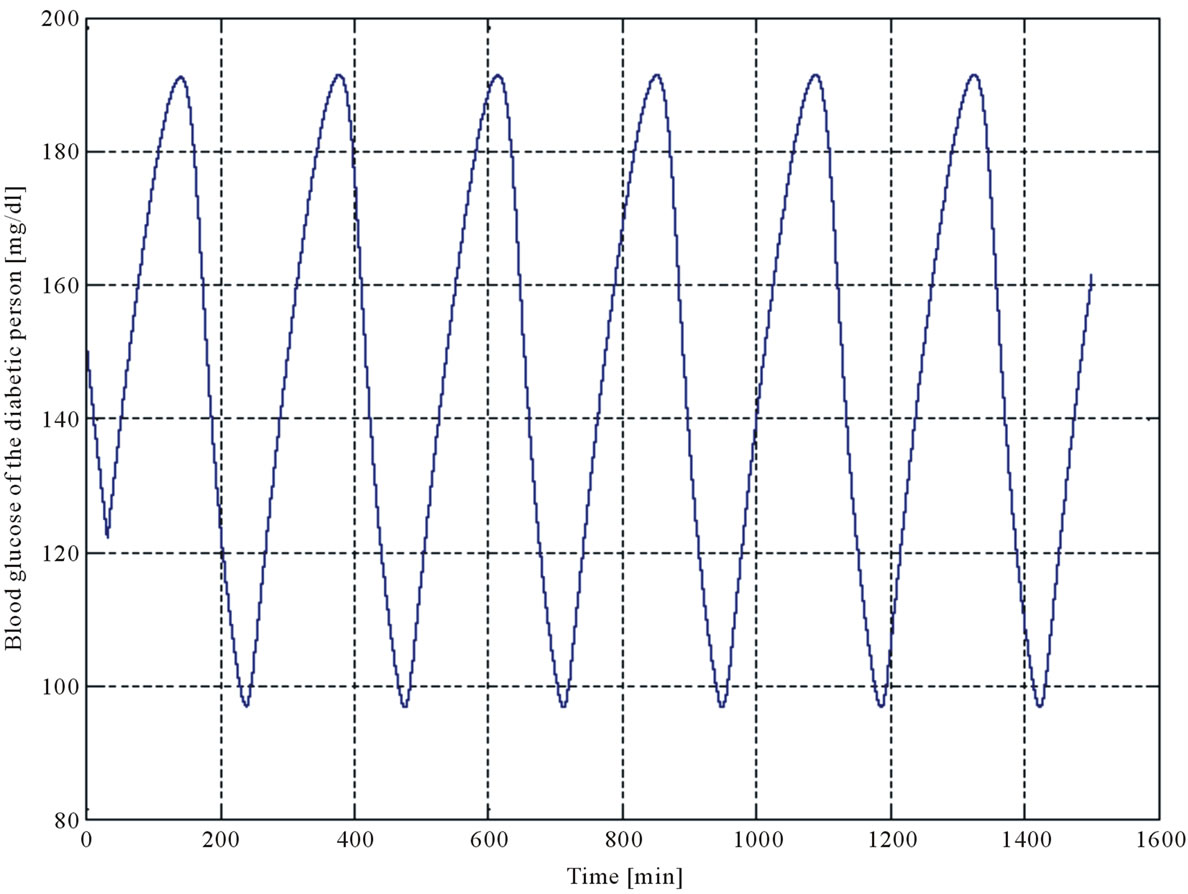
Figure 7. Blood glucose level of the diabetic person.
 (a)
(a)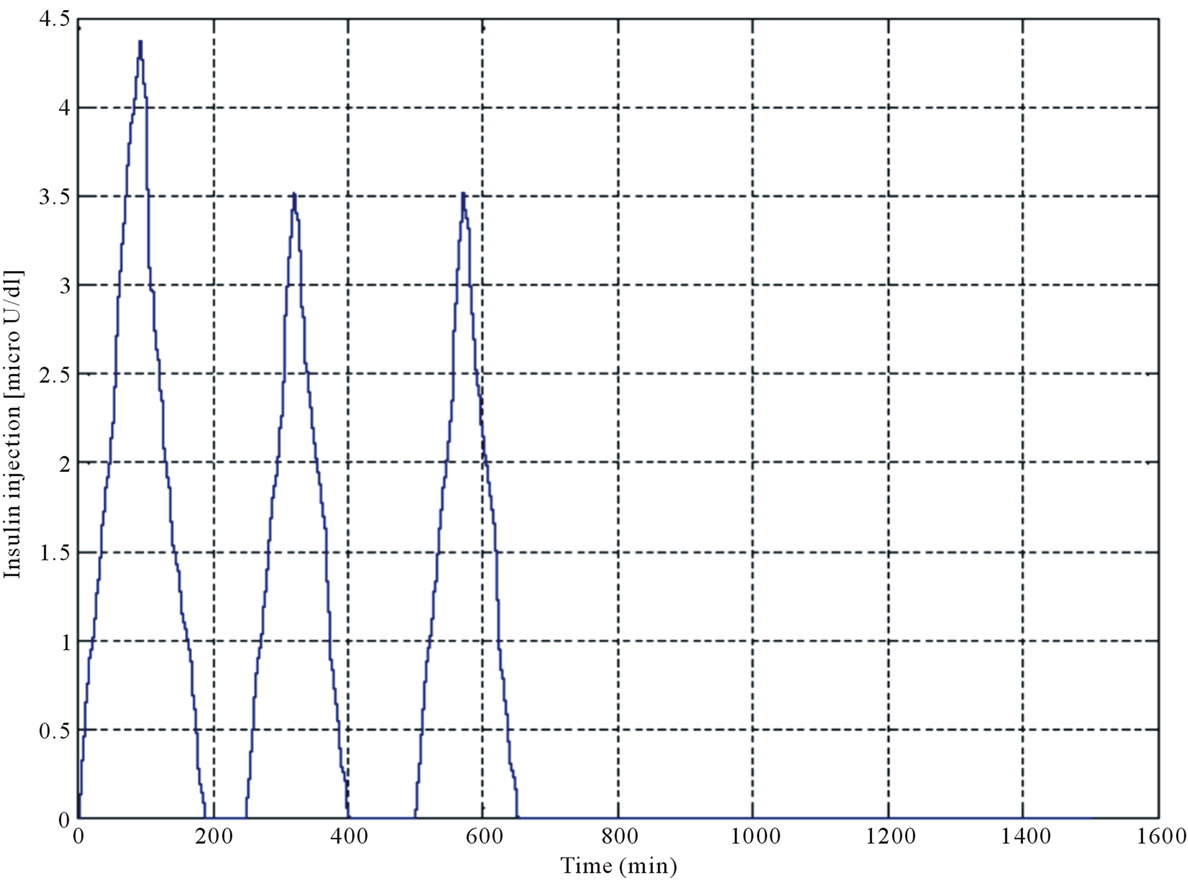 (b)
(b)
Figure 8. (a) Controlled Blood glucose of the diabetic person; (b) Insulin injection determined by NMPC controller.
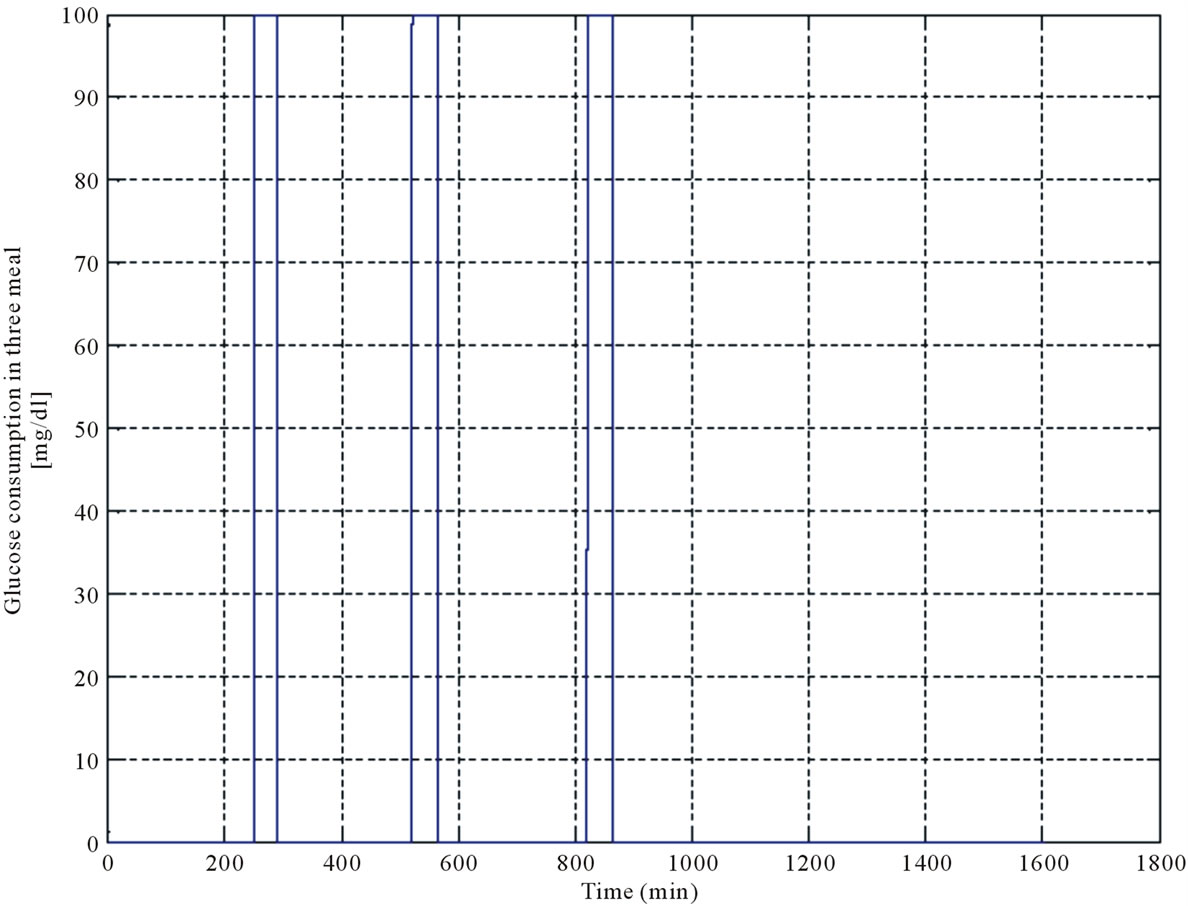
Figure 9. Three meal pulses.
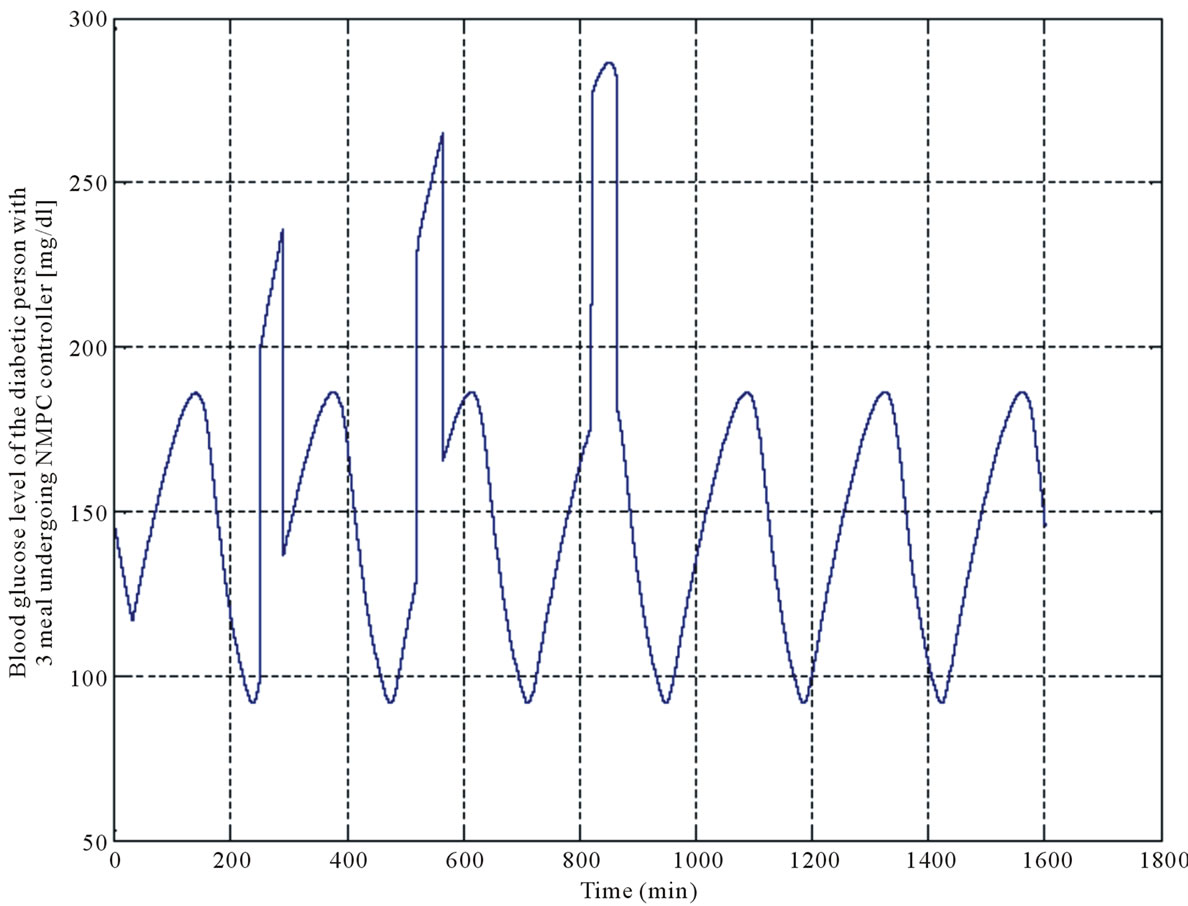
Figure 10. Diabetic’s blood glucose level by considering meal pulses.
 (a)
(a)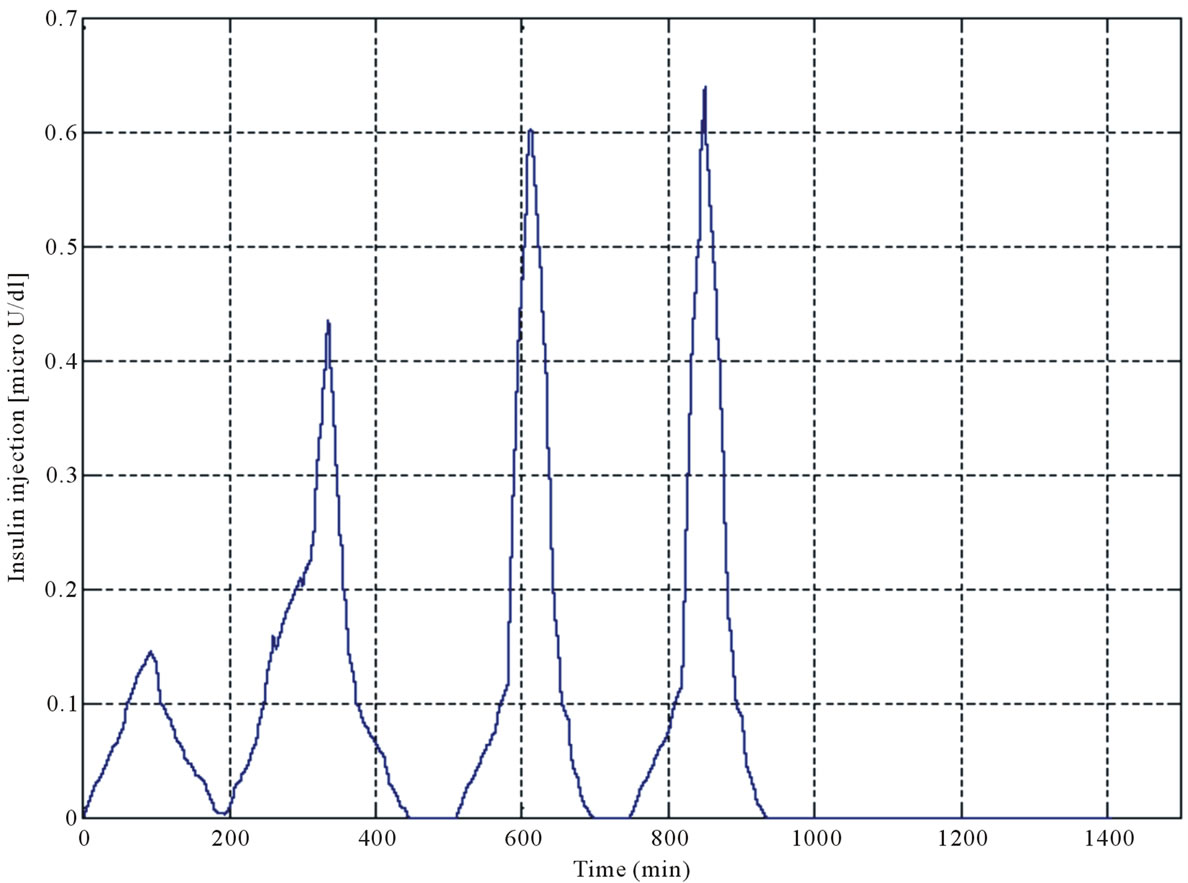 (b)
(b)
Figure 11. (a) Profile of blood glucose level controlled by NMPC controller; (b) Insulin injection defined by NMPC controller.
insulin and glucose will begin.
To design the fuzzy predictive model, half the samples were used as training data and 15 membership functions were allocated to 4 inputs. After pruning, the rules that conflicted with each other were eliminated, so 113 rules remained.
The similarity between the fuzzy predictive model and main model (Li and Kaung et al.), was shown in Figure 6. The data range in the main model is between 65 - 95, illustrated by the blue line and the results of fuzzy predictive model were shown by red line. As it was expected, the predicting data range is between 65 - 95. The amplitude and phase of the fuzzy predictive model and main model have a close correlation with each other. The beginning of the fuzzy predictive model output data were not seen on the main profile, because the fuzzy predicttive model must have been delayed by 4 sampling periods before producing the output. However, after passing this time, fuzzy predictive model behavior was almost similar to the main model.
In the NMPC controller, using the proposed fuzzy predictive model (natural insulin-glucose regulatory system) and the diabetic model, the difference between the concentrations of the blood glucose level in these models, has been obtained in each time. According to this dissimilarity, the rate of the insulin injection is defined in a way that the blood glucose level of the diabetic person reaches the normal range. The profile of the continuous insulin injection which could regulate the blood glucose level of the subject in last experiment like (Figure 7), was shown in Figure 8(b). As it was shown in Figure 8(a) the blood glucose level had a tolerance around the normal range. Investigating into Figure 8(b) shows that the blood glucose has an oscillatory behavior, if the blood glucose level of the diabetic person (using NMPC controller) reaches the normal range (70 - 110), insulin injection must be stopped. Decrease of the insulin injecttion must be happened when the blood glucose level is in the descending edge. To avoid hypoglycemia, Insulin injecttion must be decreased.
In the next stage, a study carried out on a diabetic person who consumed three meals. Since a typical diabetic person is medically restricted to consume 250 - 300 mg/dl carbohydrates per day, each meal was considered as a pulse with amplitude of 100 (mg/dl) which was applied to the diabetic model during 45 minutes (Figure 9). The blood glucose level of these three pulses was shown in Figure 10. As it was depicted, the blood glucose concentration level of the diabetic model was increased up to 270 mg/dl, approximately.
The blood glucose level of the diabetic person after applying the proposed NMPC controller was demonstrated in Figure 11(a). It is obvious that a short time after applying the glucose pulses to diabetic model, the blood glucose concentration level of the diabetic model reaches its normal range.
8. CONCLUSIONS
The glucose-insulin regulatory system considers important characteristics such as oscillatory manner and time delays. For this reasons, in this paper, it was used as the main model to obtain fuzzy predictive model and typeI diabetic model. Fuzzy predictive model is used to take into account the uncertainties.
The proposed NMPC controller is able to measure blood glucose level in an online method. In each time, regarding to the difference between blood glucose level in plant and system model, insulin injection is adjusted to keep the blood glucose level in the normal range. By injecting high amount of insulin, the blood glucose level decreases explicitly, and the person undergoes the hypoglycemic shock. In the consequence of insufficient insulin injection, the blood glucose cannot reach its normal range. So, by using the NMPC controller, the blood glucose level can be controlled in the normal range. The simulation result indicates that the proposed controller is more stable and can control the blood glucose level in an online method. Unlike offline controllers, online types can check the blood glucose level each time and prevent hypoglycemic shock due to the insulin hyper-injection. NMPC controller checks the blood glucose level continuously.
![]()
![]()
REFERENCES
- Ahrens, B. and Taborsky, Jr. (2002) B-cell function and insulin secretion. In: Baron, A., Porte, D. and Sherwin, R.S., Eds., Ellenberg and Rifkin’s Diabetes Mellitus, McGraw-Hill Professional, New York, 43-65.
- Albisser, A.M. (1982) Insulin delivery systems: Do they need a glucose sensor? Diabetes Care, 3, 166-173. doi:10.2337/diacare.5.3.166
- Furler, S.M., Kraegen, E.W., Smallwood, R.H. and Chisolm, A.J. (1985) Blood glucose control by intermittent loop closure in the basal mode: Computer simulation studies with diabetic model. Diabetes Care, 8, 553-561. doi:10.2337/diacare.8.6.553
- Lee, C.K., Cho, J.H. and Lee, I.B. (2002) PID control in typeI diabetic patient. Theories and Applications of Chemical Engineering, 3063-3067.
- Andersen, K.E. and Hejbjerre, M. (2002) A bayesian approach to Bergman minimal model. http://research.microsoft.com/en-us/um/cambridge/events/aistats2003/proceedings/183.pdf
- Li, J., Kaung, Y. and Mason, C. (2006) Modeling the glucose-insulin regulatory system and ultradian insulin secretory oscillations with two explicit time delays. Journal of Theoretical Biology, 242, 722-735. doi:10.1016/j.jtbi.2006.04.002
- Findeisen, R., et al., (2002) An introduction to nonlinear model predictive control. 21st Benelux Meeting on Systems and Control, Veidhoven.
- Wang, L. (1997) A course in fuzzy systems and control. Prentice-Hall, Inc., Upper Saddle River, 196-226.