Journal of Cancer Therapy
Vol.2 No.1(2011), Article ID:4197,14 pages DOI:10.4236/jct.2011.21005
Constitutively Active Soluble Form of Erythropoietin Receptor Suppresses Growth and Angiogenesis of Xenografts of Transfected Cancer Cell Lines
–—Blockade of Epo in Xenografts of Cancer Cell Lines
![]()
1Department of Obstetrics and Gynecology, Kinki University School of Medicine, Osaka, Japan;
2Department of Hematology, Kinki University School of Medicine, Osaka, Japan;
3Department of Surgery, Kinki University School of Medicine, Osaka, Japan;
4Department of Urology, Kinki University School of Medicine, Osaka, Japan;
5Laboratory of Molecular Biology of Bioresponse, Graduate School of Biostudies, Kyoto University, Kyoto, Japan;
6Life Science Research Institute, Kinki University School of Medicine, Osaka, Japan;
7Faculty of Rehabilitation, Shijonawate Gakuen University, Osaka, Japan.
Email: y1126yas@med.kindai.ac.jp
Received December 21st, 2010; revised February 23rd, 2011; accepted March 2nd, 2011.
Keywords: Erythropoietin, Erythropoietin Receptor, Soluble Form of Erythropoietin Receptor, ERK1/2/MAPK, Adrenoreceptor, Acetylcholine Receptor, Immunohistochemistry, Western Blot, Real-Time RT-PCR, Nude Mice
ABSTRACT
We examined the effect of blocking the erythropoietin (Epo) signaling using an anti-Epo antibody, soluble form of Epo receptor (sEpoR) capable of binding to Epo or EpoR antagonist, and proved to be effective against xenografts of female reproductive organ malignancies and of cancer cell lines in nude mice. We transfected seven cancer cell lines of various origins to express constitutively active sEpoR, and examined their tumorigenesis in nude mice. Suppression of the tumor growth, decrease in viable and proliferating cells and reduction of vascular density were seen individually in all xenografts of transfected cell lines compared with the controls. Quantitative RT-PCR analyses showed that expression levels of Epo, EpoR, a1A-adrenaline receptor (a1A-ADR) and muscalinic acetylcholine receptor subunit 3 mRNAs (m3-AchR) were higher in the majority of the wild-type xenografts than in the corresponding cell lines except for A549. In some of the transfected xenografts, EpoR, a1A-ADR and m3-AchR mRNAs were down-regulated. Western blot analyses revealed that the constitutively activated ERK1/2MAPK was discernible in the majority of non-transfected cell lines and was reduced in the transfected cell lines. However, it was regained after exposure to acetylcholine and/or noradrenaline. These findings suggest that constitutively active sEpoR can effectively destroy the xenografts but signals from the autonomic neurotransmitters of the host produced under stress may interfere with this antitumor activity.
1. Introduction
Erythropoietin (Epo), a principal cytokine involved in erythropoiesis, has been reported to promote the growth of malignant tumors by binding to its receptor (EpoR) through both autocrine stimulation of malignant cells themselves and paracrine route to the feeding microvessels due to the expression of both transcripts for Epo and EpoR mRNA in very many cancers [1-4] and for EpoR mRNA in the human endothelial cells of vein and artery [5]. However, there is controversy over the EpoR in cancer patients to be functional to develop their malignancies.
Preclinical studies clarified that blockade of the Epo signal in resected specimens [6], xenografts [2] or tumor chamber [7] using anti-Epo antibody, soluble form of EpoR (sEpoR) capable of binding to Epo, EpoR antagonists [6] or pharmacologic JAK2 inhibitor [7] led to their destruction. The involvement of Epo in malignancies has been shown by transfection of Epo agonist R103A-Epo [8] or constitutively active EpoR-R129 [9] into rat mammary carcinoma cells. The major signaling pathways involved in hematopoiesis are the JAK2 and STAT5 [10-12], the PI3K/AKT [13-16] and the ERK/MAPK [17] routes for survival and/or proliferation. The JAK2 and STAT5 route is detected in female reproductive organ malignancies [6], in xenografts of melanoma and stomach choriocarcinoma cell lines [2] and in a prostate cancer cell line [18]; and, the ERK/MAPK route is seen in mammary carcinoma [8,9] and astrocytoma [19]. Both the STAT5 and the AKT routes are in operation in neuroblastoma cells [20].
Recently chronic stress and other behavioral conditions have been reported to cause promotion and progression of cancers; catecholamines in ovarian cancers [21,22], muscarinic cholinergic receptors in prostate [23], colon [24], mammary carcinoma cells [25,26], and the receptors and ligands in small cell lung carcinoma [27,28] were shown to promote their growth and angiogenesis.
To develop more effective treatment [1,2,6], we transfected seven cancer cell lines, SCH, HepG2, A549, SBC3, HeLa, P39 and PC-3 to express constitutively active sEpoR and implanted them in nude mice. We report here that constitutive secretion of sEpoR suppressed the tumor size of all xenografts except for those of P39 and that the present device revealed the blockade of promotion pathways in all xenografts; less numerous viable and proliferating cells led to severe reduction of vascular densities in the transfected xenografts compared with those in controls. Moreover, at the time of extirpation of the tumors, the hematocrit volumes reflected the secretion amount of Epo in the cell lines before implantation and were comparable in both hosts implanted with transfected or wild-type cells. Furthermore, Epo and EpoR mRNAs and receptors for a1A-adrenaline (a1A- ADR) and m3-AchR mRNAs were expressed in all non-transfected cell lines and upregulated in all xenografts except for A549. The constitutive activation of ERK/MAPK was reduced in the transfected cell lines, but upregulated through noradrenaline and/or acetylcholine exposure. Taken together, the present Epo deprivation may be substantially effective to block autocrine and paracrine stimulation of Epo in cancers but the neurotransmitters produced in the host by stress may interfere with this antitumor activity.
2. Materials and Methods
2.1. Transfection of cDNA for sEpoR and Western Blotting
We prepared a cDNA coding for the Igκ signal sequence followed by 4 aa (Ala-Arg-Val-Val) after signal cleavage synthetically with Nhe I site introduced at the 5’ end (fragment 1). A cDNA encoding most part of extracellular region of human EpoR with Bgl II site introduced at the 3’ end was amplified by the PCR (fragment 2). A DNA fragment coding for Histidine-tag (His)6 was generated by digestion of pQE60 (Qiagen, Hilden, Germany) with Bgl II and Hind III (fragment 3). These fragments were cloned in tandem into the Nhe I and Hind III site of pcDNA3.1(-) (Invitrogen, Carlsbad, California, U.S.A.). The resulting plasmid, sEpoR-(His)6/pcDNA3.1, produces a soluble (secreted) form of EpoR (aa 3 to 226) with five additional aa Ala-Arg-Val-Val-Ala at the N-terminal and Arg-Ser-(His)6 at the C-terminal ends.
Seven cell lines, SCH, HepG2, A549, SBC3, HeLa, P39 and PC-3, were maintained in the conditions described previously [2] and were transfected with the expression vector for sEpoR-(His)6 (typically 0.67 μg for 3.5 cm dish) using Lipofectamine Plus (Life Technologies, Rockville, Maryland, U.S.A.) according to the manufacturer’s recommendations. After selection with 500 μg/ml G418 (Life Technologies) for 10-14 days, the resistant clones were isolated and expanded. The positive cell line secreting sEpoR was screened by adding Nin-ta agarose (Qiagen) to the supernatant (1 ml) of each clone to immobilize the His–tagged sEpoR, incubated for 1 h at room temperature, and washed 3 times with phosphatebuffered saline. Proteins were then eluted in loading buffer by boiling and subjected to 15% SDS-PAGE. After transfer onto a polyvinylidene difluoride membrane (Millipore, Billerica, MA, U.S.A.), proteins were detected with an antiserum raised against the N-terminal region of sEpoR (gifts from Dr. Masaya Nagao). Anti-Epo monoclonal antibody (Genzyme, Cambridge, MA, U.S.A.) was used to detect Epo bound to the secreted sEpoR- (His)6.
2.2. Tumor Formation
All animal experiments were approved by the institution and performed under guidelines of the Kinki University Animal Facilities. A total of 70 male mice (BALB/cA Jcl-nu/nu, CLEA, Tokyo, Japan) were injected wild or transfected 2 × 10⁶ - 4 × 10⁶ cells/0.1 ml of each corresponding medium subcutaneously into interscapular region of each mouse at 6-8 weeks of age. We designated the transfected cell lines sSCH, sHepG2, sA549, sSBC3, sHeLa, sP39 and sPC-3. After 4 -12 weeks of the implantation, the mice were killed under deep anesthesia, withdrawn, if possible, about 0.8 ml of whole blood from the heart and extirpated the tumors. The blood specimens were used for determination of the hematocrit volumes and the serum Epo levels by the methods described previously [2]. All extirpated tumors were cut into 1 mm-thick slices and processed for biochemical and morphological examinations.
2.3. Immunohistochemistry
The methods used for immunostaining of the cryosections of xenografts were as described previously [1]. We used the following primary antibodies: anti-EpoR (1:50) [29], anti-FVIII (DAKO, 1:500) and anti-PCNA (Santa Cruz, California, U.S.A., 1:50) antibody. To detect apoptosis, we used an in situ apoptosis detection kit (Intergen, Norcross, GA, U.S.A.).
For immunoelectron microscopy, cell lines were fixed in 2% paraformaldehyde and 0.1% glutaraldehyde solution, dehydrated and embedded in LR white (Nisshin EM, Tokyo, Japan). The 70 nm sections were treated with a sEpoR antibody at 4˚C overnight, exposed to 10 nm goldlabelled anti-rabbit antibody (BB international, Cardiff, UK) at 37˚C for 1h, and then processed for examinations with a H-7100 electron microscope (Hitachi, Japan).
2.4. Quantitative RT-PCR Analysis
To confirm the expression levels of Epo, EpoR, a1A- ADR and m3-AchR mRNA in xenografts, the frozen slices were homogenized and processed for measurements by real-time quantitative RT-PCR with an ABI PRISM7700 sequence detection system (Applied Biosystems, Foster, CA, U.S.A.). All PCR reactions were performed with Quantitative PCR Supermix-UDG (Invitrogen) in a 25 µl final mixture. PCR primers of Epo and EpoR were described previously [2]; primers of a1A- ADR sequences were FW primer TCGGACTCGGAGCAAGTG and RV primer, CATCCCGCTGCCTCCTG, reporter prove, ACGCTCCGCATCCAT, and m3-AchR (CHRM3, Assay ID HS00265216_sl). 18S rRNA primers and probes were supplied by Applied Biosystems as TaqMan Gene Expression Assays and TaqMan Ribosomal RNA Control Reagents (VICTMprove).
2.5. ERK/MAPK Assay
Cell lines with or without transfection were starved in serum-free medium for 24 h and either left unstimulated or incubated with 4 µM noradrenaline (Sankyo, Tokyo, Japan) or 300 µM acetylcholine (Sigma Aldrich, St. Louis, MO, U.S.A.) for 10 min at 37˚C. Whole cell extracts were resolved by SDS-PAGE and subjected to immunoblotting using ERK1/2/MAPK, phospho-ERK1/ 2/MAPK and b-actin antibody (Cell Signaling Technology, Danvers, MA, U.S.A.).
2.6. Statistics
The Student’s t-test was used to determine a significant difference in vascular density and in transcriptional levels, and a c2 test, to compare the incidence of cell population. Differences with P values less than 0.05 were considered significant.
3. Results
3.1. Stable Transfection of the cDNA for sEpoR
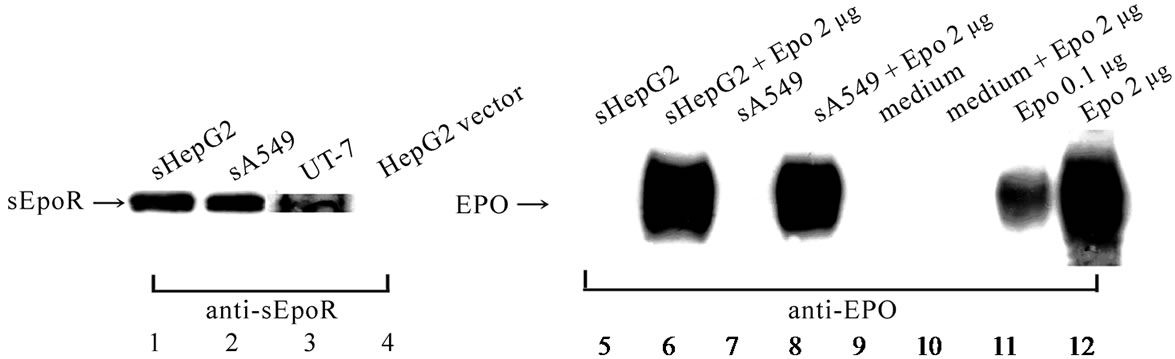
The supernatant of the sHepG2 and sA549 showed the band for sEpoR protein as seen in the control, UT-7, but not the band for Epo protein (Figure 1(A)). Addition of rhEpo to the supernatant and the medium showed positive and negative bands, respectively (Figure 1(A)). The band intensity of anti-Epo antibody was confirmed by dissolving 0.1 μg or 2 μg of rhEpo in loading buffer processed for blotting, which showed comparable intensity implying that the sEpoR entrapped almost 2 μg rhEpo (Figure 1(A)). Additionally the bands for sEpoR were detectable in the culture media of the transfected cell lines and in the lysates of the transfected xenografts (Figure 1(B)).
Immunoelectron microscopy revealed that sEpoR was detected more frequently in the vesicles in the cytoplasm and at the cell surface region of the sSBC3 (Figure 1(C), (a)) than those in the SBC3 cells (Figure 1(C), (b)). The specificity of the sEpoR antibody was confirmed with the use of antibody pretreated with antigen (Figure 1(C), (c), (d)).
3.2. Tumor Growth
The growth of sSCH, sHepG2, sSBC3, sHeLa, sPC-3, sA549 and sP39 xenografts just before extirpation was 82%, 55%, 51%, 67%, 17%, 60% and 146% of those of non-transfected specimen, respectively (Figure 2). The serum Epo level of the hosts generally corresponded to the secretion amount to the non-transfected cell line (Table 1, 2). The hematocrit values corresponded to the respective Epo level of the host and were comparable to those in the controls (Table 2).
3.3. Microscopy
The wild-type xenografts showed characteristic morphological features such as huge cells in SCH, compact cellular arrangement in HepG2, glandular structure in A549 (Figure 3(a)) and scattering many neutrophils and macrophages in SBC3 (Figure 3(b)), whereas these features were disarranged in the transfected xenografts (Figure 3(a’), (b’), (c’)). The majority of the wild-type xenografts showed central and/or focal necrosis containing sporadical apoptotic cells (Figure 3(g), (h), (i)), while in the transfected xenografts the small stromal cancer cells were frequently detected in the dispersed architecture
 (A)
(A) (B)
(B)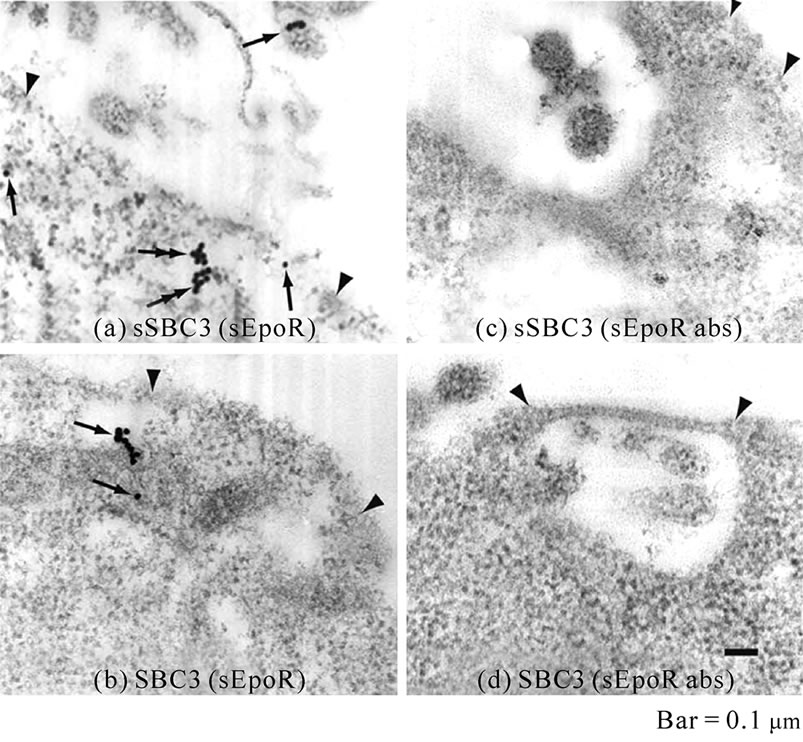 (C)
(C)
Figure 1. Expression of sEpoR in transfected cell lines and in their xenografts. (A) Western blot analysis of sEpoR and Epo in HepG2 and A549 cells stably transfected with plasmid encoding sEpoR and the binding to exogenous Epo. Lane 1, 2, supernatant of sHepG2 and sA549; lane 3, membrane fraction of UT-7; lane 4, HepG2 transfected with empty vector; lane 5, 7, supernatant of sHepG2 and sA549; lane 6, 8, supernatant of sHepG2 and sA549 plus 2 µg rhEpo; lane 9, medium; lane 10, medium plus 2 µg rhEpo; lane 11, 0.1 μg rhEpo; lane 12, 2 µg rhEpo; (B) Western blot analysis of sEpoR in the culture media of transfected cell lines and in the lysates of their xenografts, shows positive bands; (C) Localization of sEpoR in the sSBC3 cell. sEpoR appeared as aggregated gold particles in vesicles (double arrows) or one or three particles (single arrow) around cell surface regions (a). Non-transfected SBC3 has sEpoR (arrows) near the cell surface (b). No gold particles are seen in respective cells stained with preabsorbed antibody (c, d). Arrowheads point to cell surface (a-d). Bar, 0.1 µm.
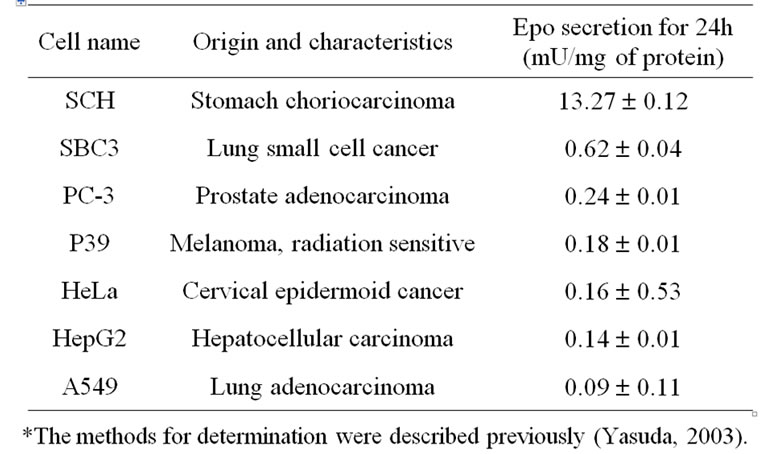
Table 1. Origin and Epo concentration.
containing fragmented cells and cells in apoptosis (Figure 3(g’), (h’), (i’)). In most control xenografts the immunoreactive EpoR appeared as homogeneously stainable cytoplasm of the cancer cells (Figure 3(j), (k), (l)), and in transfected xenografts, it was frequently seen as grains in strong positive cytoplasm (Figure 3(j’), (k’), (l’)).
3.4. Suppression of Viable and Proliferating Cells
The cell population with proliferating, chromatin-condensed, small or large vacuolated and normal nuclear features is arranged in Figure 4. The dying cells with

Table 2. Hematocrit values and serum Epo concentration in host mice.*
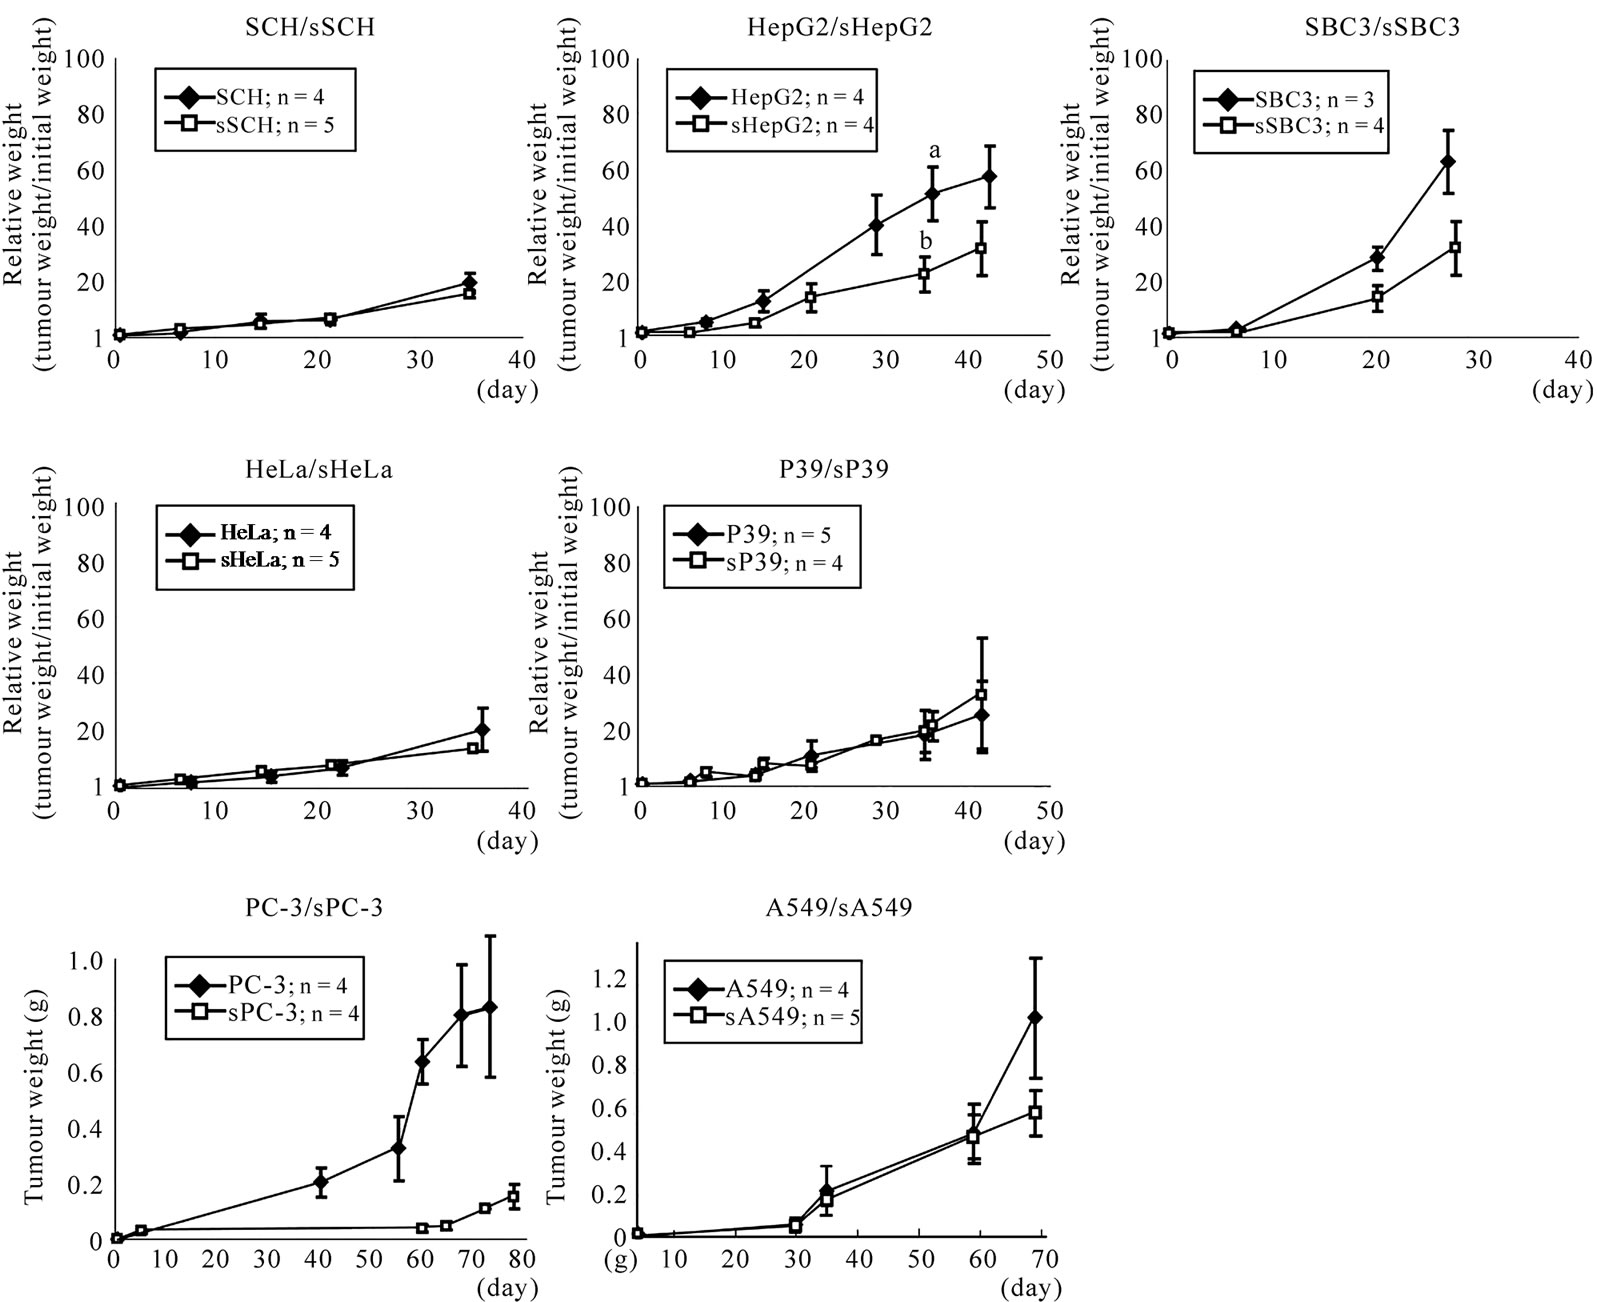
Figure 2. Growth curves of tumors of cell lines with or without transfection of sEpoR. Ordinate indicates relative weight to the initial weight except for PC-3/sPC-3 and A549/sA549, in which indicates tumor weight. Abscissa indicates the day after recognition of palpable tumor. a, b, Significant difference by Student’s t-test (P < 0.05).
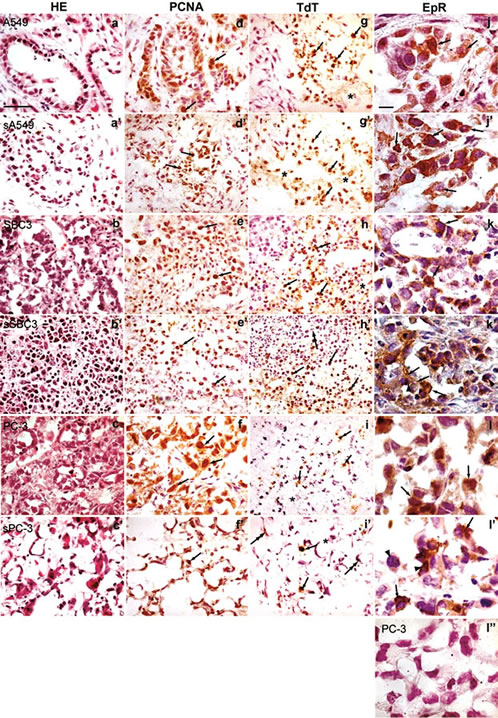
Figure 3. Immunohistopathological features of xenografts of representative cell lines transfected or not. Panels in the same horizontal row are from xenografts of the same cell line. Panels in 1st lane show the sections stained with H&E. Panels in 2nd lane show the sections stained with anti-PCNA antibody. Arrows indicate positive immunoreactive PCNA cells; in 3rd lane, the sections treated with TdT assay. Arrows point to the apoptotic nuclei of malignant cells, double arrows in h’ and i’ indicate those of capillary endothelial cells and asterisks in g, g’, h, i and i’ indicate vacuolated cells; in 4th lane, sections stained with anti-EpoR antibody showing immunoreactive EpoR cells (arrows), and arrowheads in k’ and l’ point to chromatin condensation. Negative EpoR expression of PC-3 stained with preabsorbed anti-EpoR antibody (l’’). All panels in 1 - 3rd and 4th lane are at the same magnification. Bar in a, 50 µm; in j, 10 µm.
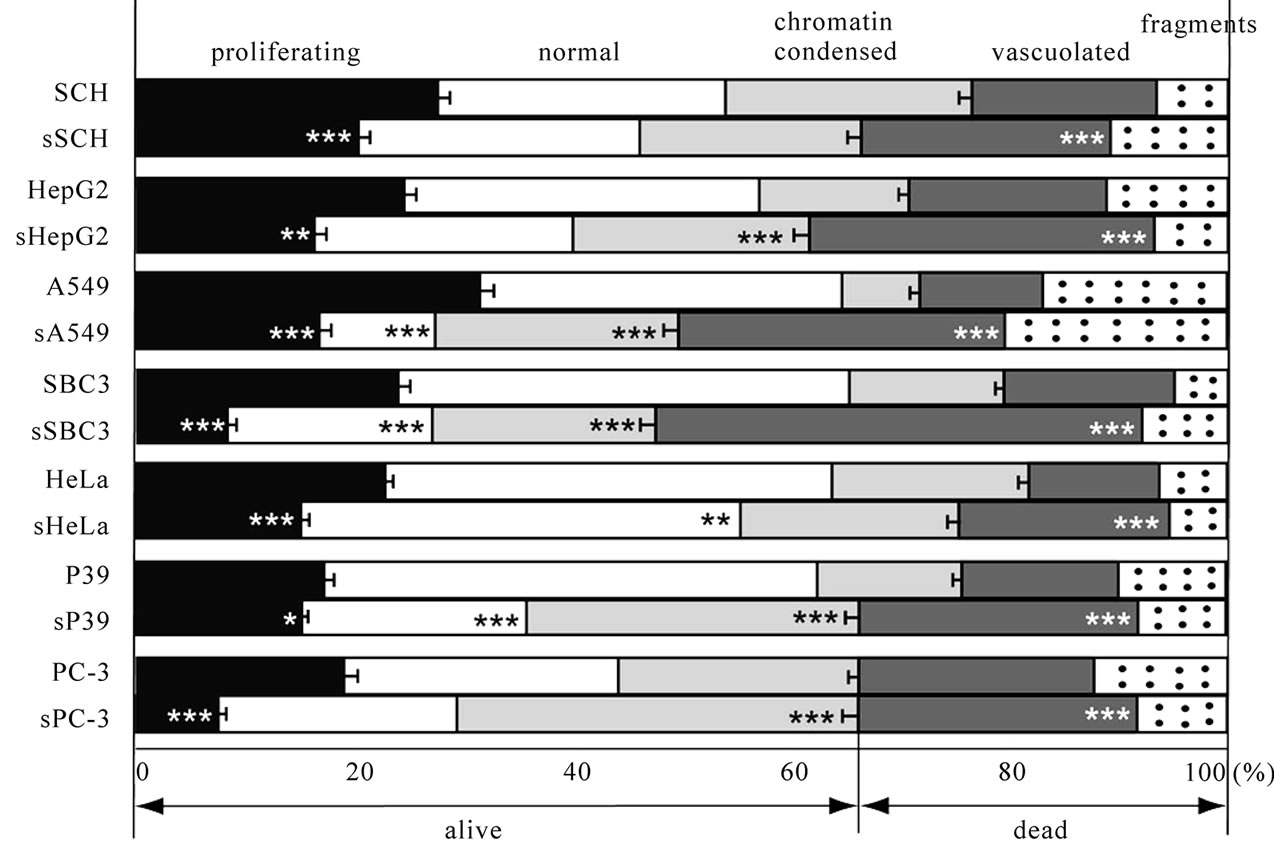
Figure 4. Cell population with various nuclear features and cytoplasmic fragments in xenografts with or without transfection. We counted the number of proliferating cells, dying cells with abnormal nuclear and cytoplasmic features and normal cells by judging the nuclear features of the cells in 100 definite areas of the sections stained with anti-PCNA antibody ranged from 2736 to 4981 per each wild-type specimen, and from 2721 to 4381 per each transfected specimen. *, **, ***, Significant difference in each population between transfected and non-transfected specimens by c2-test. *P < 0.05, **P < 0.01, ***P < 0.001.
vacuolated or without nucleus were significantly more numerous in all transfected than in all wild-type specimen (P < 0.001, Figure 4). The cells with chromatincondensed nuclei were significantly more numerous in sHepG2, sA549, sSBC3, sP39 and sPC-3 xenografts (P < 0.001, Figure 4) than respective controls. There were significantly fewer proliferating cells in the transfected xenografts than in the wild-type specimens (P < 0.001, P < 0.01, P < 0.05, Figure 4). The suppression of proliferating cells was in the decreasing order of sSBC3, sA549, sPC-3, sHeLa, sHepG2, sSCH and sP39 xenografts. The population of normal cells decreased significantly in xenografts of sA549, sSBC3, sHeLa and sP39 compared with the controls (P < 0.001, P < 0.01, Figure 4).
3.5. Suppression of Angiogenesis
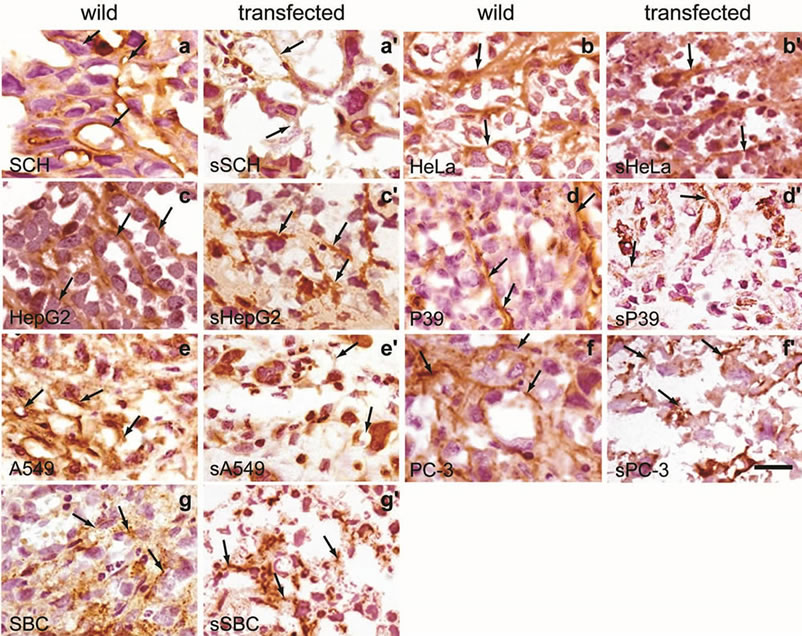
The capillaries with or without lumen showing positive immunoreactivity to anti-FVIII antibody (Figure 5(a)) were counted at the peripheral, intermediate and central regions separately and the data is summarized in Figure 5(b). The capillary endothelial cell extension of all xenografts with transfection was broken into short fragments, especially in the intermediate zones (Figure 5(a)), whereas those of controls they extended between the cells and between the intervening fibrous tissues without interruption (Figure 5(a)). There were significantly more vessels in the wild-type than in transfected xenografts (P < 0.001, P < 0.01, P < 0.05, Figure 5(b)). The reduction of vascular density was calculated by comparing the total number of capillaries in wild-type xenografts with those in transfected xenografts. The reduction of vascular density in xenografts of sPC-3, sP39, sHepG2, sHeLa, sSCH, sA549 and sSBC3 was 74.5%, 74.2%, 60.2%, 60.2%, 57.6%, 50.0% and 48.9%, respectively. The xenografts of PC-3 showed the highest vascularity and those of its transfected counterpart, sPC-3 the greatest reduction (Figure 5(b)), while those of SBC3 showed the lowest vascularity and sSBC3 the least reduction (Figure 5(b)). Thus, reduction in vascular density was in the decreasing order of PC-3, P39, HepG2, HeLa, SCH, A549 and SBC3.
3.6. Expression of Epo and EpoR mRNA in Xenografts
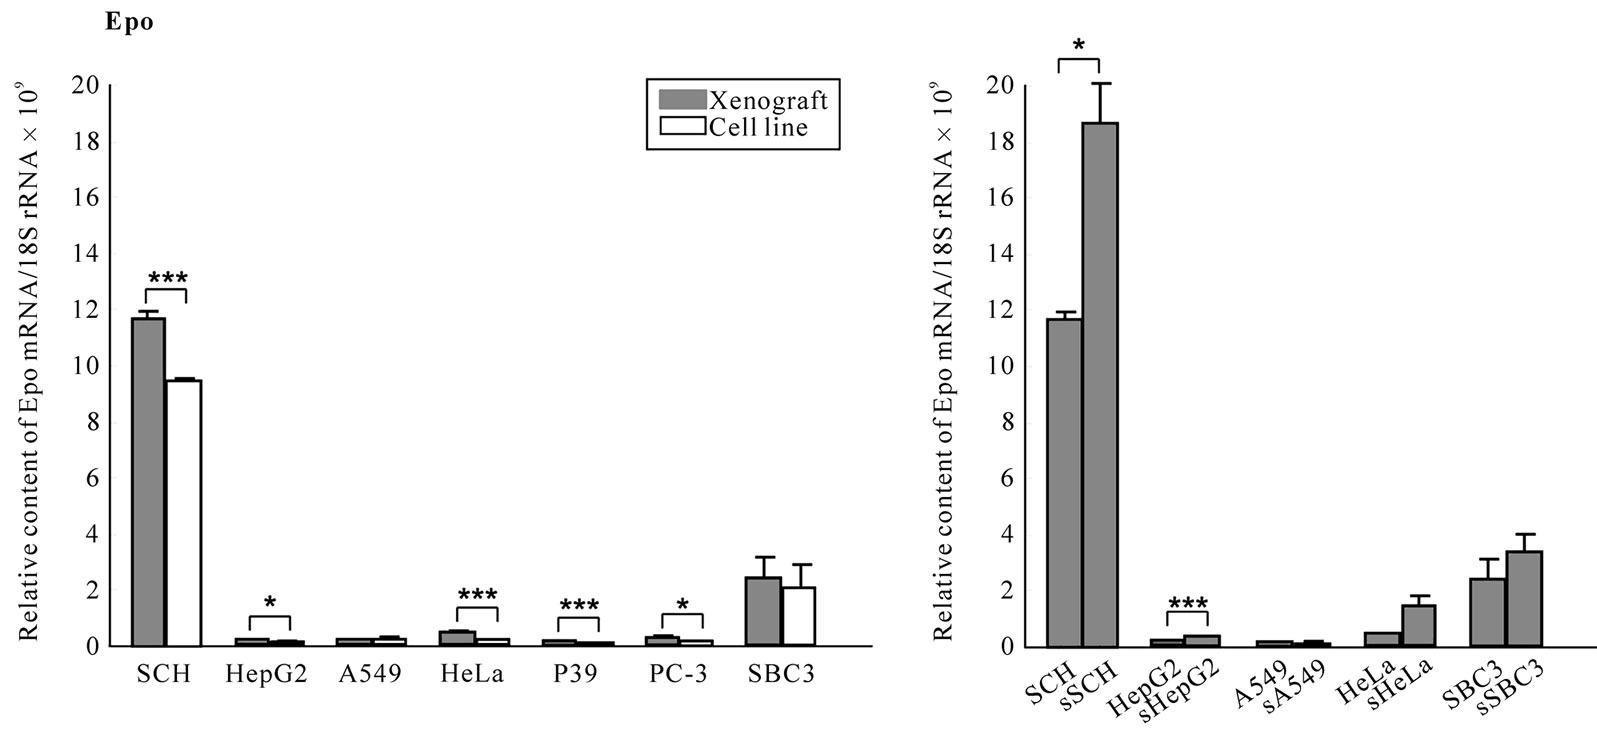
Excluding SCH and SBC3 that expressed markedly higher Epo mRNA in both cell lines and xenografts than others, Epo mRNA was expressed significantly higher (P < 0.001, P < 0.05, Figure 6(a)) in the xenografts than the respective cell line except for A549, and it was up-regulated in sSCH and sHepG2 xenografts (P < 0.05, P < 0.001, Figure 6(b)).
 (a)
(a)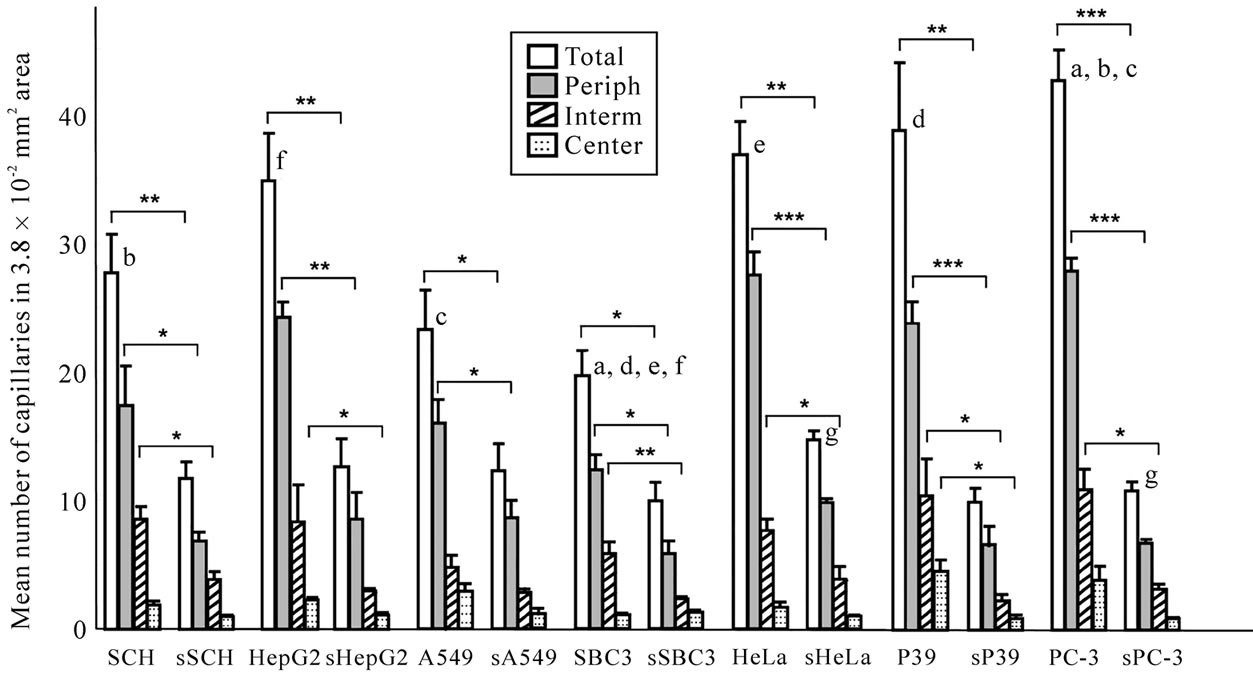 (b)
(b)
Figure 5. Vascular networks and densities in xenografts of cell lines with or without transfection. (a) Capillary networks visualized by staining with anti-FVIII antibody. Extending vascular nets are seen in xenografts without transfection. Arrows point to positively stained extension of endothelial cells (panels in 1st and 3rd lane). Note broken or dotted capillaries in xenografts with transfection. Arrows show negatively stained or broken endothelial cells (panels in 2nd and 4nd lane). All panels are at the same magnification. Bar, 20 mm; (b) The capillaries with or without lumen were counted at the peripheral, intermediate and central regions separately in 120 definite areas of sections stained with anti-FVIII antibody. Vascular densities of each region show significantly less numerous in transfected than in non-transfected xenografts (*P < 0.05, **P ≤ –0.01, ***P < 0.001). The same letter indicates a significant difference; a, P < 0.01; b, c, d, e, f, g, P < 0.05.
 (a)
(a)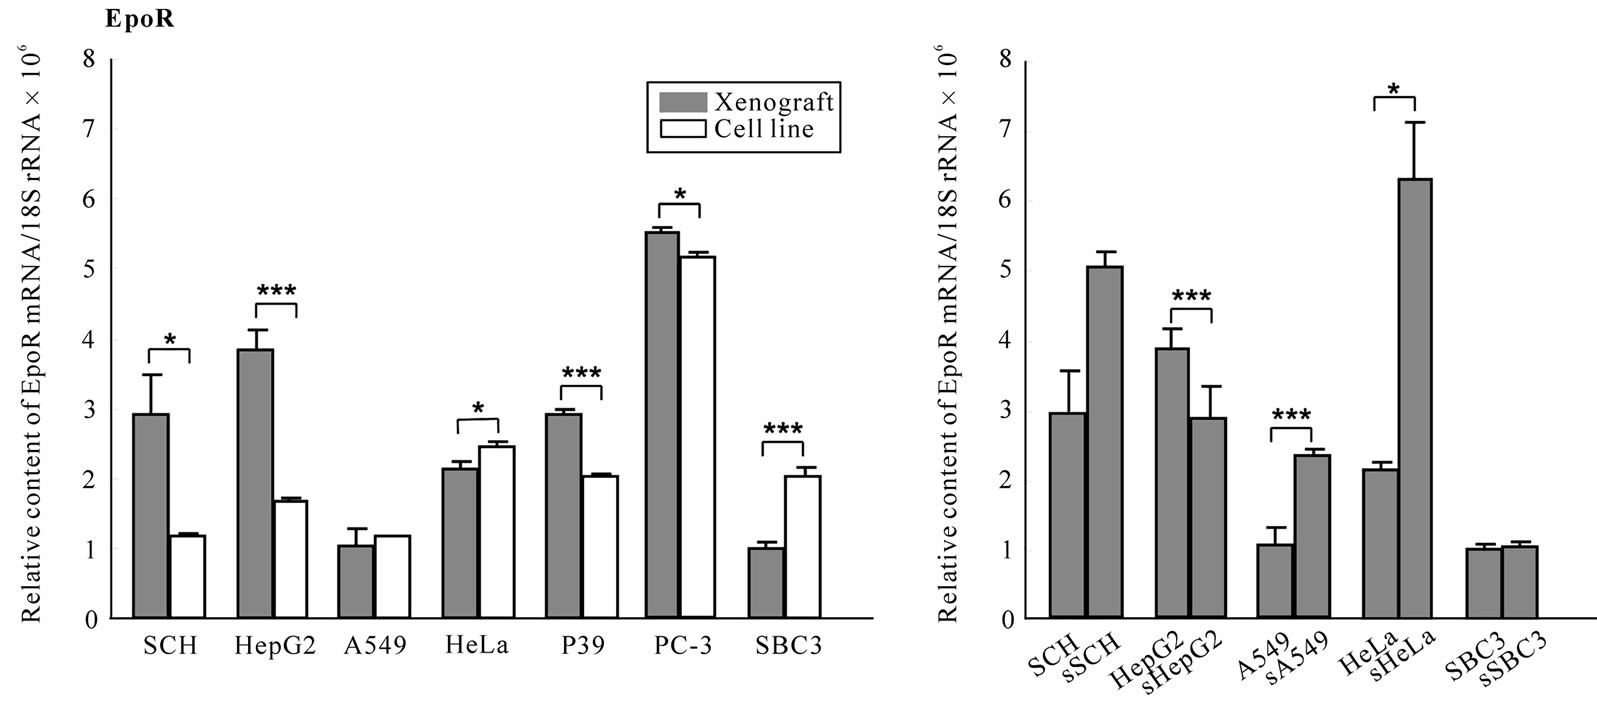 (b)
(b)
Figure 6. Expression levels of Epo and EpoR mRNA in xenografts. The Epo and EpoR mRNA levels in cell lines and in xenografts with or without transfection were quantified by real-time RT-PCR as described in “Materials and methods”. The levels were standardized to 18S rRNA mRNA. Note the vertical scale in EpoR mRNA (c, d) showing 10-3 times lower than that in Epo mRNA (a, b).
EpoR mRNA was expressed approximately 103 times more than Epo mRNA in all cell lines (Figure 6(c)). In the majority of wild-type xenografts, the EpoR mRNA levels were significantly higher than in the respective cell lines (P < 0.001, P < 0.05, Figure 6(c)), while in HeLa and SBC3, it was suppressed significantly compared with the cell line (P < 0.05, P < 0.001, Figure 6(c)). EpoR mRNA was downand up-regulated in xenografts of sHepG2, sA549 and sHeLa, respectively (P < 0.001, P < 0.05, Figure 5(d)). Up-regulation of Epo and EpoR mRNA may be due either to the hypoxic microenvironment in xenografts or the participation of capillary endothelial cells from the hosts in xenografts, respectively.
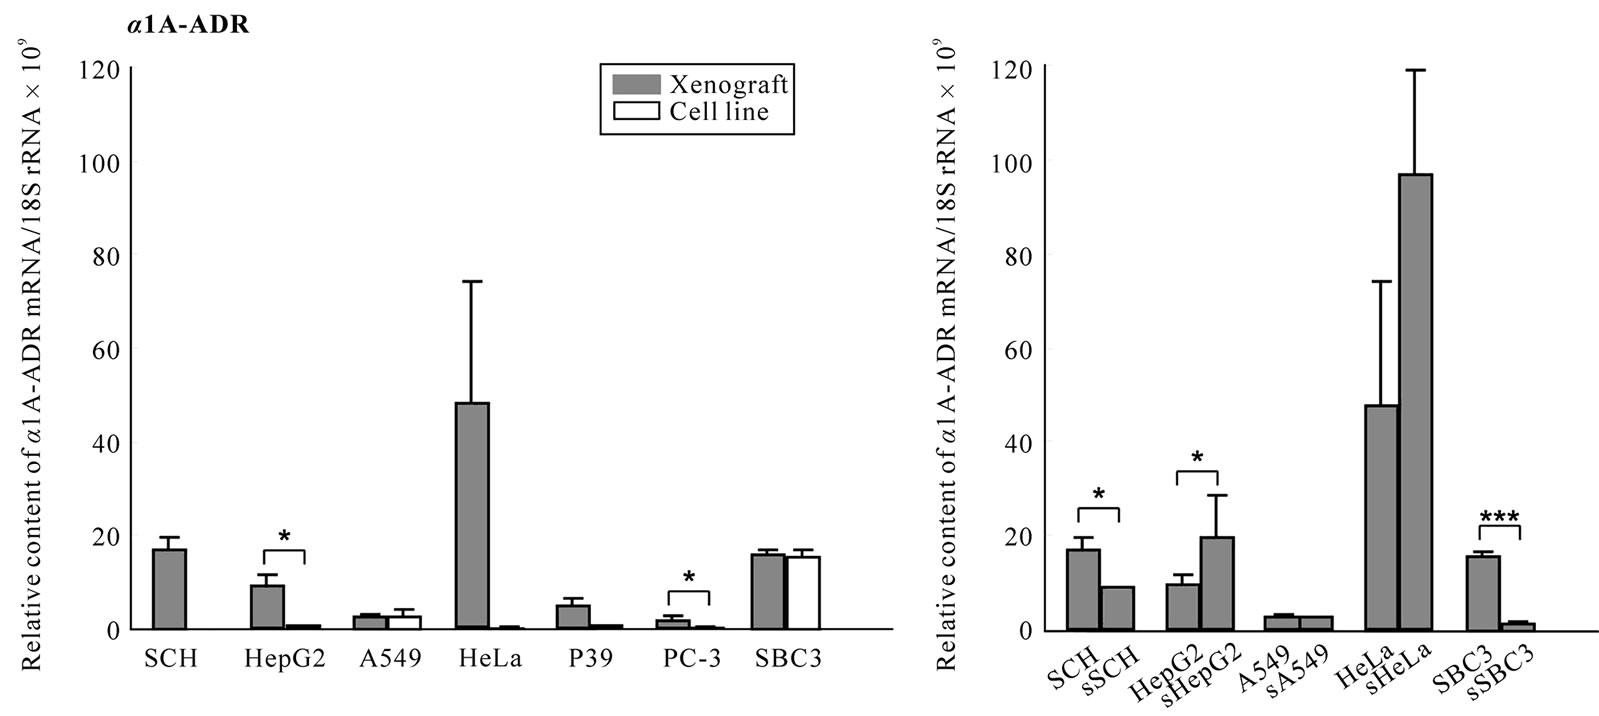
3.7. Expression of α1A-ADR and m3-AchR mRNA
All cell lines except for SCH expressed both mRNAs, and SBC3, A549, P39 and PC-3 cell lines expressed prominently both or either mRNA (Figure 7(a), (b)). In wild-type xenografts, both mRNAs were upregulated in PC-3 compared with the respective cell line. a1A-ADR mRNA was upregulated in HepG2 and comparable in A549 and SBC3 (Figure 7(a)) and m3-AchR mRNA was downregulated in A549 and P39 (P < 0.001, P < 0.05, Figure 7(b)) and upregulated in SBC3 (P < 0.01, Figure 7(b)) xenografts compared with the respective cell line. In transfected xenografts, downregulation of the a1A- ADR mRNA was detected in the sSCH and sSBC3 (P < 0.05, P < 0.001, Figure 7(c)), and downregulation of m3-AchR mRNA was seen in the sSCH and sA549 (P < 0.001, Figure 7(d)), whereas, in the sSBC3, it was raised significantly (P < 0.001, Figure 7(d)) compared with the wild-type xenograft.
 (a)
(a)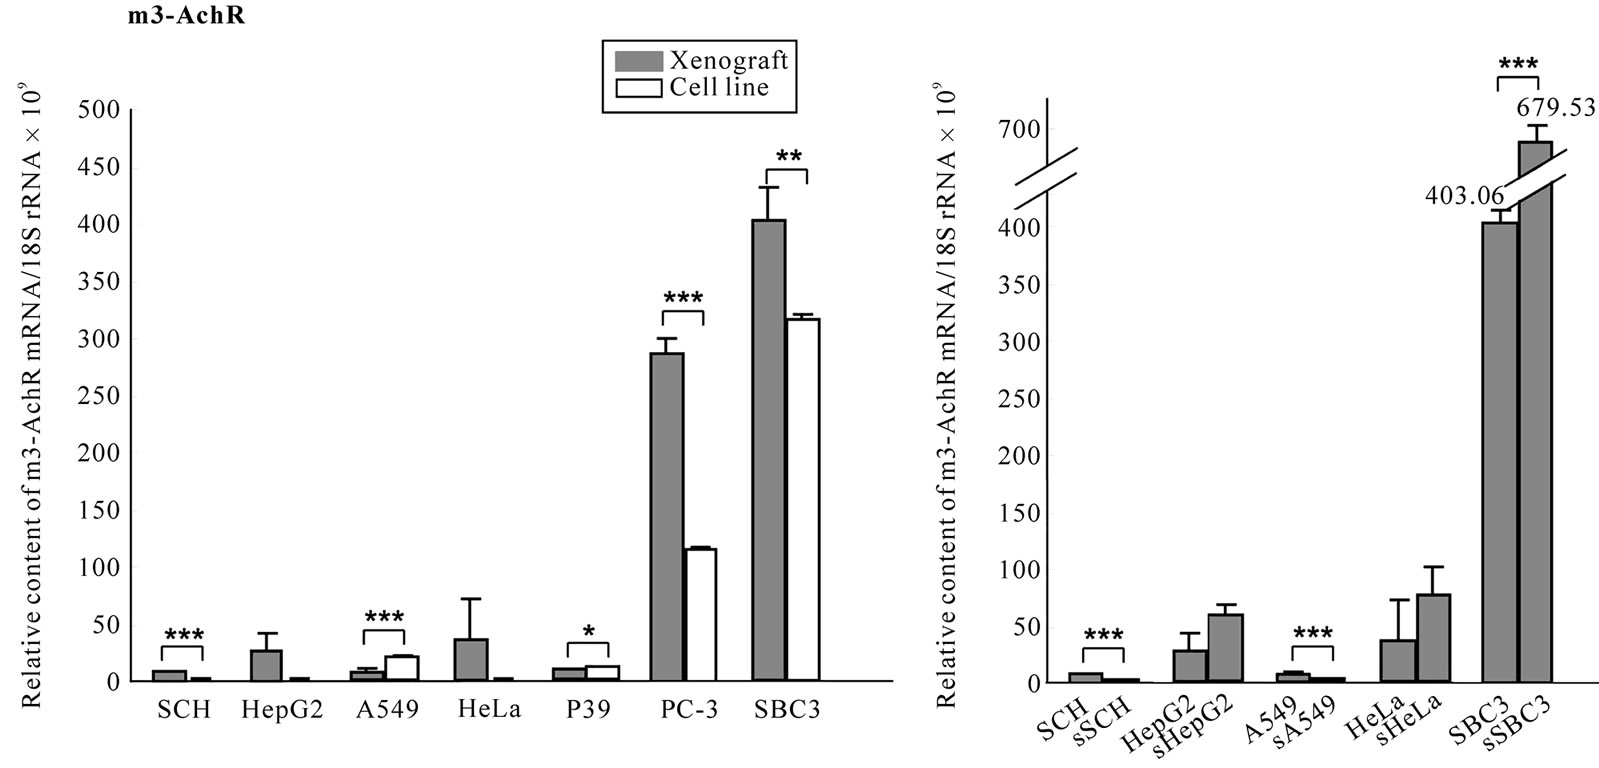 (c)
(c)
Figure 7. Expression of a1A-ADR and m3-AchR mRNA in cell lines and xenografts. To clarify whether host’s stress may participate in the tumorigenesis, we examined the transcripts for receptors for α1A-ADR and m3-AchR mRNA in seven cell lines and their xenografts with or without transfection. The mRNA levels were quantified by real-time RT-PCR as decreased in “Materials and methods”. The levels were standardized to 18S rRNA mRNA (a-d).
 (a)
(a)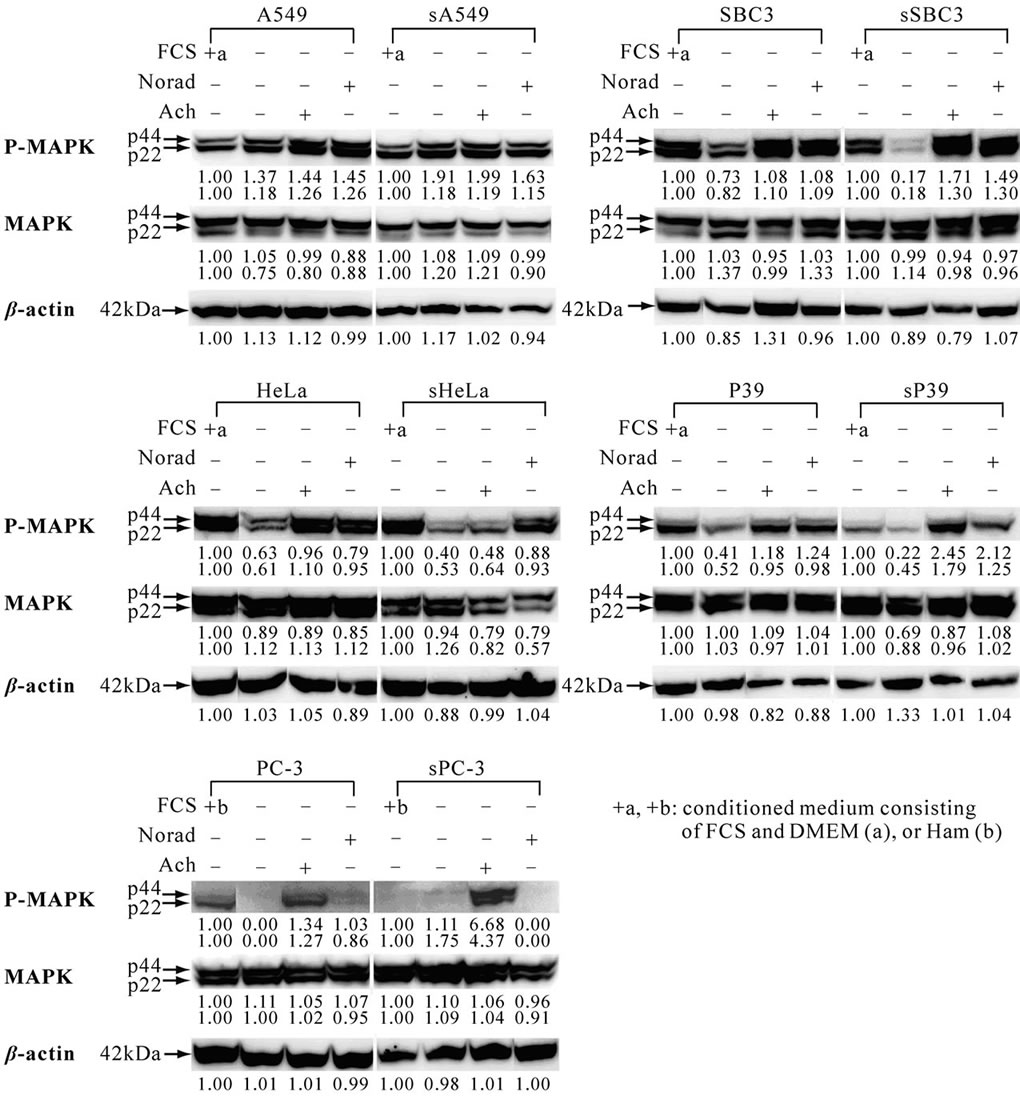 (b)
(b)
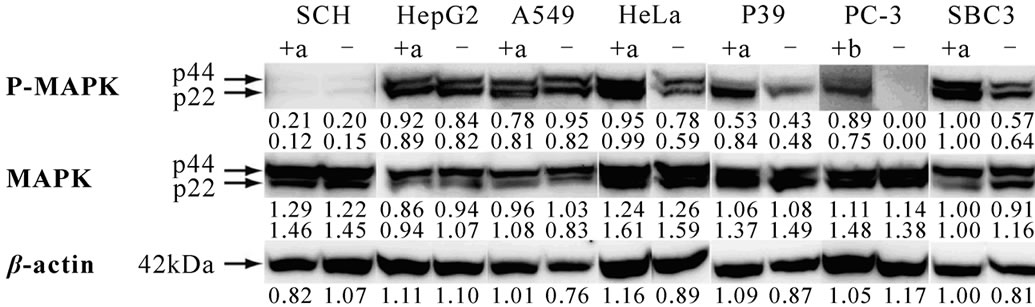
Figure 8. Activation of ERK/MAPK in cell lines with or without transfection and its alteration after exposure to noradrenaline or acetylcholine. Cell lines were treated as described in “Materials and methods”. The results were analyzed when three identical data were obtained in five independent experiments. The numbers under each band indicate the band intensity that was quantified with Image J, in the public domain NIH image program (http://rsb.info.nih.gov/ij/). (a) Constitutive activation of ERK/MAPK in seven cell lines without transfection, showing various intensity of the band as seen in the SBC3 which has P-MAPK and MAPK [28]; (b) Induction or reduction of constitutive activation of ERK/MAPK through noradrenaline or acetylcholine. Exposure to noradrenaline or acetylcholine activated or suppressed the phospho-ERK/MAPK in five cell lines with or without transfection.
3.8. Phosphorylation of ERK/MAPK
Participation of the ERK/MAPK pathway in proliferation [8,9] of the wild-type cell lines was examined. Most cell lines showed the band for constitutive phospho-MAPK in various intensities except for PC-3 (Figure 8(a)). In three of the five paired cell lines with or without transfection, the band intensity of constitutive phospho-MAPK was weak in the transfected cell line but was regained after exposure to noradrenaline and/or acetylcholine (Figure 8(b)), implicating the suppression of phosphorylation of ERK/MAPK through sEpoR may be modulated through either or both neurotransmitters in the transfected cell lines.
4. Discussion
Intercaption of the Epo signal in the blocks of malignant clinical specimens in vitro [6], in their xenografts [1] and in the xenografts of cancer cell lines in nude mice [2] by local or intraperitoneal injections of anti-Epo antibody, sEpoR or EpoR antagonist reduced the tumor masses from macroscopically detectable destruction to microscopical changes. Additionally, the present device induced the significant suppression of the survival and proliferation of the malignant cells and the angiogenesis in all transfected-xenografts compared with those shown in wild-type xenografts in spite of possible interference with autonomic neurotransmitters from the hosts.
The malignant cells expressing EpoR through blockade of Epo signaling appear to die by a mechanism similar to that seen in HCD 57 cell line, the survival of which depends entirely on the Epo signal [30], in which deprival of Epo induces the reduction of receptor internalization leaving EpoR in the cytoplasmic membrane. In this study, stronger reactivity to the EpoR antibody was seen in the intact and degenerating malignant cells of the transfected than in those of wild-type xenografts indicating the addition of the secreted sEpoR in the transfected cells to the original EpoR (Figure 3(j), (k), (l)). The population of dead cells was significantly higher than in each control xenograft (Figure 4, P < 0.001) and when the cells with chromatin-condensed nuclei that are suggestive of precursor of apoptotic death were added, the viability of the majority of transfected xenografts was less than 50 %, showing sSBC3, sA549, sPC-3, sP39, sHepG2, sSCH and sHeLa xenografts in high reduction order.
Since the level of EpoR mRNA implicates the vascular density of the tumor in the host, we supposed that tumor growth would be promoted by higher expression of EpoR in the malignant cells. We determined the expression levels of both Epo and EpoR mRNA in 24 malignant cell lines (Yasuda et al., submitted). The expression levels of the EpoR mRNA were in the decreasing order of PC-3, P39, HeLa, SBC3, A549, HepG2 and SCH. The number of proliferating cells in the xenografts (Figure 4) was not correlated with the EpoR expression of the cells (Figure 6C), but the vascular density was correlated with the EpoR levels in the wild-type xenografts except for SBC3 and A549 (Figure 5, 6(c)); The reduction in vascular density was in the decreasing order of PC-3, P39, HeLa, HepG2, SCH, A549 and SBC3 xenografts, and the reduction in angiogenesis was in the decreasing order of sPC-3, sP39, sHepG2, sHeLa, sSCH, sA549 and sSBC3 (Figure 5). The expression level of EpoR mRNA was significantly lower in SBC3 or comparable in A549 xenografts than in their respective cell lines (P < 0.001, Figure 6(c)).
Recently neurotransmitters and their ligands have been reported to regulate the proliferation, apoptosis and metastasis of many cancers and cancer-related angiogenesis [31,32]; small cell lung carcinoma [27] and squamous cell lung carcinoma [33] express AchRs with choline acetyltransferase and while in lung adenocarcinoma, β1- and β2-ADR [34]. This neurotransmitter-mediated proliferation is regulated via activation of ERK1/2 (phosphorylation of MAPK) [32,35]. In the present study, expression of a1A-ADR and m3-AchR mRNAs was significantly higher in most xenografts (Figure 7) and the constitutive activation of ERK/MAPK was suppressed in transfected cell lines except for A549 and PC-3 (Figure 7(b)). Exposure to noradrenaline and/or acetylcholine activated the ERK/MAPK in wild-type and transfected cell lines. Taken together, the neurotransmitters considered to be produced by stress in the host may interfere with the antitumor activity and modulate the proliferation of malignant cells in xenografts.
In conclusion, constitutively activated sEpoR of malignant cell lines appears to abolish the autocrine and paracrine Epo on malignant cells and reduce the capillary endothelial cells leading to decrease in proliferating and viable cells, thus causing severely damaged angiogenesis in the tumors, but this anti-tumor activity can be affected by neurotransmitters from the host.
5. Acknowledgements
Sadako Nagahisa helped prepare the manuscript. This work was partly supported by a grant to Y. Y. from The Promotion and Mutual Aid Co-operation for Private Schools of Japan.
REFERENCES
- Y. Yasuda, T. Musha, H. Tanaka, Y. Fujita, H. Utsumi, T. Matsuo, S. Masuda, M. Nagao, R. Sasaki and Y. Nakamura, “Inhibition of Erythropoietin Signalling Destroys Xenografts of Ovarian and Uterine Cancers in Nude Mice,” British Journal of Cancer, Vol. 84, No. 6, 2001, pp. 836-843. doi:10.1054/bjoc.2000.1666
- Y. Yasuda, Y. Fujita, T. Matsuo, S. Koinuma, S. Hara, A. Tazaki, M. Onozaki, M. Hashimoto, T. Musha, K. Ogawa, H. Fujita, Y. Nakamura, H. Shiozaki and H. Utsumi, “Erythropoietin Regulates Tumour Growth of Human Malignancies,” Carcinogenesis, Vol. 24, No. 6, 2003, pp. 1021-1029. doi:10.1093/carcin/bgg060
- G. Acs, P. Acs, S. M. Beckwith, R. L. Pitts, E. Clements, K. Wong and A. Verma, “Erythropoietin and Erythropoietin Receptor Expression in Human Cancer,” Cancer Research, Vol. 61, No. 9, 2001, pp. 3561-3565.
- M. O. Arcasoy, K. Amin, R. T. Vollmer, X. Jiang, W. Demark-Wahnefried and Z. A. Haroon, “Erythropoietin and Erythropoietin Receptor Expression in Human Prostate Cancer,” Modern Pathology, Vol. 18, No. 3, 2005, pp. 421-430. doi:10.1038/modpathol.3800288
- A. Anagnostou, Z. Liu, M. Steiner, K. Chin, E. S Lee, N. Kessimian and C. T. Noguchi, “Erythropoietin Receptor mRNA Expression in Human Endothelial Cells,” Proceedings of the National Academy of Sciences of the United States of America, Vol. 91, No. 9, 1994, pp. 3974- 3978. doi:10.1073/pnas.91.9.3974
- Y. Yasuda, Y. Fujita, S. Masuda, T. Musha, K. Ueda, H. Tanaka, H. Fujita, T. Matsuo, M. Nagao, R. Sasaki and Y. Nakamura, “Erythropoietin is Involved in Growth and Angiogenesis in Malignant Tumours of Female Reproductive Organs,” Carcinogenesis, Vol. 23, No. 11, 2002, pp. 1797-1805. doi:10.1093/carcin/23.11.1797
- M. O. Arcasoy, K. Amin, A. F. Karayal, S. C. Chou, J. A. Raleigh, M. A Varia and Z. A. Haroon, “Functional Significance of Erythropoietin Receptor Expression in Breast Cancer,” Laboratory Investigation, Vol. 82, No. 7, 2002, pp. 911-918.
- M. E. Hardee, Y. Cao, P. Fu, X. Jiang, Y. Zhans, Z. N. Rabbani, Z. Vujaskovic, M. W. Dewhirst and M. O. Arcasoy, “Erythropoietin Blockade Inhibits the Induction of Tumor Angiogenesis and Progression,” PLoS One, Vol. 2, No. 6, 2007, p. e549. doi:10.1371/journal.pone.0000549
- P. Fu, X. Jiang and M. O. Arcasoy, “Constitutively Active Erythropoietin Receptor Expression in Breast Cancer Cells Promotes Cellular Proliferation and Migration through a MAP-kinase Dependent Pathway,” Biochemical and Biophysical Research Communications, Vol. 379, No. 3, 2009, pp. 696-701. doi:10.1016/j.bbrc.2008.12.146
- M. Socolovsky, A. E. Fallon, S. Wang, C. Brugnara and H. F. Lodish, “Fetal Anemia and Apoptosis of Red Cell Progenitors in Stat5a-/-5b-/-mice: A Direct Role for Stat5 in Bcl-X(L) Induction,” Cell, Vol. 98, No. 2, 1999, pp. 181-191. doi:10.1016/S0092-8674(00)81013-2
- E. Parganas, D. Wang, D. Stravopodis, D. J. Topham, J. C. Marine, S. Teglund, E. F. Vanin, S. Bodner, O. R. Colamonici, J. M. VanDeursen, G. Grosveld and J. N. Ihle, “Jak2 is Essential for Signaling through a Variety of Cytokine Receptors,” Cell, Vol. 93, No. 3, 1998, pp. 385- 395. doi:10.1016/S0092-8674(00)81167-8
- H. Neubauer, A. Cumano, M. Müller, H. Wo, U. Huffstadt and K. Dfeffer, “Jak2 Deficiency Defines an Essential Developmental Checkpoint in Definitive Hematopoiesis,” Cell, Vol. 93, No. 3, 1998, pp. 397-409. doi:10.1016/S0092-8674(00)81168-X
- J. E. Damen, A. L. Mui, L. Puil, T. Pawson and G. Krystal, “Phosphatidylinositol 3-kinase Associates, via Its Src homology 2 Domains, with the Activated Erythropoietin Receptor,” Blood, Vol. 81, No. 12, 1993, pp. 3204-3210.
- S. Uddin, S. Kottegoda, D. Stigger, L. C. Platanias and A. Wickrema, “Activation of the Akt/FKHRL1 Pathway Mediates the Antiapoptotic Effects of Erythropoietin in Primary Human Eryrhroid Progenitors,” Biochemical and Biophysical Research Communications, Vol. 275, No. 1, 2000, pp. 16-19. doi:10.1006/bbrc.2000.3266
- J. H. Myklebust, H. K. Blomhoff, L. S. Rusten, T. Stokke and E. B. Smeland, “Activation of Phosphatidylinositol 3-kinase is Important for Erythropoietin-induced Erythropoiesis from CD34(+) Hematopoietic Progenitor Cells,” Experimental Hematology, Vol. 30, No. 9, 2002, pp. 990-1000. doi:10.1016/S0301-472X(02)00868-8
- S. R. Datta, H. Dudek, X. Tao, S. Masters, H. Fu, Y. Gotoh and M. E. Greenberg, “Akt phosphorylation of BAD Couples Survival Signals to the Cell-intrinsic Death Machinery,” Cell, Vol. 91, No. 2, 1997, pp. 231-241. doi:10.1016/S0092-8674(00)80405-5
- Y. Miura, O. Miura, J. N. Ihle and N. Aoki, “Activation of the Mitogen-activated Protein Kinase Pathway by the Erythropoietin Receptor,” Journal of Biological Chemistry, Vol. 269, No. 47, 1994, pp. 29962-29969.
- L. Feldman, Y. Wang, J. S. Rhim, N. Bhattacharya, M. Loda and A. J. Sytokowski, “Erythropoietin Stimulates Growth and STAT5 Phosphorylation in Human Prostate Epithelial and Prostate Cancer Cells,” Prostate, Vol. 66, No. 2, 2006, 135-145. doi:10.1002/pros.20310
- T. Forshew, R. G. Tatevossian, A. R. Lawson, J. Ma, G. Neale, B. W. Ogunkolade, T. A. Jones, J. Aarum, J. Dalton, S. Bailey, T. Chaplin, R. L. Carter, A. Gajjar, A. Broniscer, B. D. Young, D. W. Ellison and D. Sheer, “Activation of the ERK/MAPK Pathway: A Signature Genetic Defect in Posterior Fossa Pilocytic Astrocytomas,” Journal of Pathology, Vol. 218, No. 2, 2009, pp. 172-181.
- M. Um and H. F. Lodish, “Antiapoptotic Effects of Erythropoietin in Differentiated Neuroblastoma SH-SY5Y Cells Require Activation of both the STAT5 and AKT Signaling Pathways,” Journal of Biological Chemistry, Vol. 281, No. 9, 2006, pp. 5648-5656.
- P. H. Thaker, L. Y. Han, A. A. Kamat, J. M. Arevalo, R. Takahashi, C. Lu, NB. Jennings, G. Armaiz-Pene, J. A. Bankson, M. Ravoori, W. M. Merritt, Y. G. Lin, L. S. Mangala, T. J. Kim, R. L. Coleman, C. N. Landen, Y. Li, E. Felix, A. M. Sanguino, R. A. Neuman, M. Lloyd, D. M. Gershenson, V. Kundra, G. Lopez-Berestein, S. K. Lutgendorf, S. W. Cole and A. K. Sood, “Chronic Stress Promotes Tumour Growth and Angiogenesis in a Mouse Model of Ovarian Carcinoma,” Nature Medicine, Vol. 12, No. 8, 2006, pp. 939-944.
- C. N. Jr. Landen, Y. G. Lin, G. N. Armaiz Pena, P. D. Das, J. M. Arevalo, A. A. Kamat, L. Y. Han, N. B. Jennings, W. A. Spannuth, P. H. Thaker, S. K. Lutgendorf, C. A. Savary, A. M. Sangiono, G. Lopez-Berestein, S. W. Cole and A. K. Sood, “Neuroendocrine Modulation of Signal Transducer and Activator of Transcription-3 in Ovarian Cancer,” Cancer Research, Vol. 67, No. 21, 2007, pp. 10389-10396.
- W. Rayford, M. J. Noble, M. A. Austenfeld, J. Weigel, W. K. Mebust and G. V. Shah, “Muscarinic Cholinergic Receptors Promote Growth of Human Prostate Cancer Cells,” Prostate, Vo. 30, No. 3, 1997, pp. 160-166. doi:10.1002/(SICI)1097-0045(19970215)30:3<160::AID-PROS3>3.0.CO;2-Q
- H. Frucht, R. T. Jensen, D. Dexter, W. L. Yang and Y. Xiao, “Human Colon Cancer Cell Proliferation Mediated by the M3 Muscarinic Cholinergic Receptor,” Clinical Cancer Research,” Vol. 5, No. 9, 1999, pp. 2532-2539.
- L. E. Rimmaudo, E. de la Torre, E. Sacerdote de Lustig and M. E. Sales, “Muscarinic Receptors are Involved in LMM3 Tumor Cells Proliferation and Angiogenesis,” Biochemical and Biophysical Research Communications, Vol.334, No.4,2005, pp.1359-1364. doi:10.1016/j.bbrc.2005.07.031
- G. L. Fiszman, M. C. Middonno, E. de la Torre, M. Farima, A. J. Español and M. E. Sales, “Activation of Muscarinic Cholinergic Receptors Induces MCF-7 Cells Proliferation and Angiogenesis by Stimulating Nitric Oxide Synthase Activity,” Cancer Biology & Therapy, Vol. 6, No. 7, 2007, pp. 1106-1113. doi:10.4161/cbt.6.7.4330
- P. Song, H. S. Sekhon, Y. Jia, J. A. Keller, J. K. Blusztajn, G. P. Mark and E. R. Spindel, “Acetylcholine is Synthesized by and Acts as an Autocrine Growth Factor for Small Cell Lung Carcinoma,” Cancer Research, Vol. 63, No. 1, 2003, pp. 214-221.
- P. Song, H. S. Sekhon, A. Lu, J. Arredondo, D. Sauer, C. Gravett, G. P. Mark, S. A. Grando and E. R. Spindel, “M3 Muscarinic Receptor Antagonists Inhibit Small Cell Lung Carcinoma Growth and Mitogen-activated Protein Kinase Phosphorylation Induced by Acetylcholine Secretion” Cancer Research, Vol. 67, No. 8, 2007, pp. 3936- 3944.
- Y. Yasuda, M. Nagao, M. Okano, S. Masuda, R. Sasaki, H. Konishi and T. Tanimura, “Localization of Erythropoietin and Erythropoietin-receptor in Postimplantation Mouse Embryos,” Development, Growth & Differentiation, Vol. 35, No. 6, 1993, pp. 711-722.
- S. T. Sawyer and W. D. Hankins, “The Functional Form of the Erythropoietin Receptor is a 78-kDa Protein: Correlation with Cell Surface Expression, Endocytosis, and Phosphorylation,” Proceedings of the National Academy of Sciences of the United States of America, Vol. 90, No. 14, 1993, pp. 6849-6853.
- H. M. Sculler, “Neurotransmitter Receptor-mediated Signaling Pathways as Modulators of Carcinogenesis,” Progress in Experimental Tumor Research, Vol. 39, Review, 2007, pp. 45-63.
- N. Shah, S. Khurana, K. Cheng and J. P. Raufman, “Muscarinic Receptors and Ligands in Cancer,” American Journal of Physiology. Cell Physiology, Vol. 296, No. 2, 2009, pp. C221-232.
- P. Song, H. S. Sekhon, X. W. Fu, M. Maier, Y. Jia, J. Duan, B. J. Proskosil, C. Gravett, J. Lindstrom, G. P. Mark, S. Saha and E. R. Spindel, “Activated Cholinergic signaling Provides a Target in Squamous Cell lung Carcinoma,” Cancer Research, Vol. 68, No. 12, 2008, pp. 4693-4700.
- H. M. Sculler and M. Cekanova, “NNK-induced Hamster Lung Adenocarcinomas over Express Beta2-Adrenergic and EGFR Signaling Pathways,” Lung Cancer, Vol. 49, No. 1, 2005, pp. 35-45.
- H. M. Sculler, “Mechanisms of Smoking-related Lung and Pancreatic Adenocarcinoma Development,” Nature Reviews Cancer, Vol. 2, No. 6, 2002, pp. 455-463.
Abbreviations
Ach, acetylcholine;
α1A-ADR, α1Aadrenaline receptor;
α1A-AR, α1Aadrenaline;
Epo, erythropoietin;
rhEpo, recombinant human erythropoietin;
EpoR, erythropoietin receptor;
sEpoR, soluble form of erythropoietin receptor;
ERK1/2, extracellular signal-regulated kinase 1/2;
MAPK, mitogen-activated protein kinase;
m3-AchR, muscalinic acetylcholine receptor subunit 3