Intelligent Information Management
Vol.6 No.3(2014), Article ID:46063,11 pages DOI:10.4236/iim.2014.63013
Methodology for Developing a Nursing Administration Analysis System
Misao Miyagawa1, Tetsuya Tanioka2, Yuko Yasuhara2, Kazuyuki Matsumoto3, Hirokazu Ito2, Motoyuki Suzuki4, Ren Fuji3, Rozzano Locsin5
1Department of Nursing, Faculty of Health and Welfare, Tokushima Bunri University, Tokushima, Japan
2Institute of Health Biosciences, The University of Tokushima Graduate School, Tokushima, Japan
3Faculty of Engineering, The University of Tokushima, Tokushima, Japan
4Faculty of Information Science and Technology, Osaka Institute of Technology, Osaka, Japan
5Christine E. Lynn College of Nursing, Florida Atlantic University, Boca Raton, USA
Email: miyagawa@tks.bunri-u.ac.jp
Copyright © 2014 by authors and Scientific Research Publishing Inc.
This work is licensed under the Creative Commons Attribution International License (CC BY).
http://creativecommons.org/licenses/by/4.0/


Received 5 March 2014; revised 4 April 2014; accepted 30 April 2014
ABSTRACT
Nursing administration requires a large volume of wide-ranging information, and nurse administrators are limited in their ability to compile and analyze information for nursing administration. The purpose of this study is to create methodology for developing a nursing administration analysis system to aid nurse administrators in performing outcome analysis. In this methodology, information required for nursing administration in the PSYCHOMS® (Psychiatric Outcome Management System, registered trademark) database is analyzed according to the individual needs of nurse administrators. It features a combination of a classification method and an extraction method for obtaining quantitative and qualitative data as information required for nursing administration, and enables nurse administrators to easily obtain analysis results that they directly need. This methodology converts the time required nurse administrators to collect and organize information into time for making considerations in order to devise strategies for improving the quality of nursing care services, and can improve the quality and efficiency of nursing administration. This may lead to an increase of the quality of nursing care services at psychiatric hospitals. This methodology is highly versatile as it can be applied in information management, not only for nursing, but for the entire psychiatric hospital.
Keywords:Nursing Administration, Clinical Pathways, Variance, Analysis System, PSYCHOMS®

1. Introduction
Nurse administrators must oversee the sound management of hospitals and ensure high quality in medical treatment and nursing services [1] [2] . In psychiatric hospitals, the length of hospital stays and treatment fees play a role, and nurse administrators must determine how to provide high quality nursing care and integrated rehabilitation most effectively and efficiently with limited human resources [3] -[5] . Accordingly, analyzing the current situation in psychiatric hospitals, forming strategies and using them in actual practice are the key to achieving and maintaining high quality human health care [6] [7] .
The scope of nursing administration has expanded in recent years, and the information required for nursing administration has increased dramatically in both volume and diversity [8] . There is commercially available statistical software for calculating basic statistics and performing multivariate analysis on a computer, and such information for nursing administration is wide-ranging, including both quantitative and qualitative data, using this software to analyze data and interpret the results of analysis requires expertise in statistics.
Data mining has come into use for automatically detecting information hidden in large volumes of data [9] . Likewise, systems for use in clinical practice were reported, such as a patient data management system [10] , networked computerized quality management database to provide more timely data reporting and consistency of analysis [11] and a comprehensive evaluation system model for nursing outcomes [12] . These systems solve complex mathematical equations in a short time that would normally be very time-consuming by hand. However, no single system can analyze all the various types of data required for nursing administration, including combinations of qualitative and quantitative data.
As nurse administrators are limited in their ability to compile and analyze information for nursing administration, support must be provided to help them perform outcome analysis [13] . A system that could perform data analysis that varies with the function of the hospital ward and patient characteristics in line with the requirements of the nursing administrator such as extracting the outcomes they need could raise the quality and efficiency of nursing administration and help to improve the quality of nursing care services in psychiatric wards [14] . The PSYCHOMS® (Psychiatric Outcome Management System, registered trademark, Tanioka et al.) is an electronic nursing management system designed for the purpose of interdisciplinary communication, and to improve patient outcomes in psychiatric hospitals [15] .
The purpose of this study is to create a specific methodology for developing a nursing administration analysis system that could be used to analyze information which is stored in the PSYCHOMS® and is required for nursing administration, to be communicated as desired information according to the individual needs of nurse administrators.
2. Method
2.1. Information Needed to Carry out Nursing Administration
Nursing administration is the work process carried out by nursing care staff to assist and increase the quality of nursing care and medical treatment for patients and their families [16] [17] . Nurse administrators must create an optimal nursing care environment for patients by making the necessary instruments available, and ensuring that there are enough nursing care staff with all the necessary skills for the volume of nursing care work. Data needed for nursing administration [8] [18] [19] includes information on bed occupancy rate, length of hospital stay, severity of patient symptoms/illness, patient outcomes, the degree of pressure of work of hospital ward, working conditions and work schedule of nurses in the such a ward, skills of nurses and more.
Nurse administrators use this data to analyze the status of patients, patient dynamics, ward characteristics and staff information, and use the results to continuously manage the work of nurses, personnel distribution and the quality of nursing care services. Specifically, the data is used to confirm whether or not hospital criteria for treatment fees are being filled and working conditions comply with the Labor Standards Law. In addition, ward characteristics are determined from nursing care implementation and patient information, and efforts are made to ensure correct personnel distribution based on the appropriateness of nursing staff for the ward.
In clinical practice that changes from day to day, nurse administrators that are required to make decisions to suit each situation must correctly comprehend and evaluate large volumes of information [20] . Nurse administrators in psychiatric wards would be greatly benefit from the development of a nursing administration analysis system that could perform personnel arrangement simulations, manage information on nursing staff and mange ward operations [21] . This methodology focuses on collecting and analyzing the data which nurse administrators need for decision-making in nursing administration.
2.2. Methodology for Developing a Nursing Administration Analysis System
Nurse administrators can view outcomes for information to be analyzed by simply having an operator input categories and conditions, from registered information to electronic health records, nursing care logs, nursing care plans, staff information management, work schedule management and clinical pathways system databases in PSYCHOMS® that was developed from a nursing perspective (Figure 1).
This analysis system uses two different display methods: 1) one is data classified into types of information as desired by the nursing administrator; 2) the other is extracted data required by the nursing administrator. This system can classify information registered in the database based upon categories (S_category) and conditions (S_condition) established by the user, and extract the information that corresponded to the condition. To view classified data, when there are multiple categories and/or conditions, records matching each category and condition must all be extracted from the data tables of the database.
Categories as used here refer to those used to classify information, as shown in Figure 2. Conditions refer to the key words used in searches.
3. Conceptual Formula
3.1. Formula and an Example of Displayed Classified Data
Normally a search formula such as an SQL search formula for the SQL server is created to classify data, but SQL specifications and mathematical functions vary somewhat with the type of software being used. Following are conceptual formula of this methodology.
In Equation (1) below, inf (x) shows the information that user wants to know and S_category, S_condition shows the categories and conditions that have been selected.
 shows that record i is only extracted if it matches the category selected S_category. Similarly,
  shows that record j is only extracted if it matched the condition selected S_category.
The value m shows the overall number of data. The operator ■ represents the extraction of overlapping parts of records extracted in the former and latter parts on the right side of the equation.
[Formula 1]
 (1)
(1)
For example, when a “character trait” of nursing staff information, such as the category (S_category) was selected, and a “hospital ward” of nursing staff information, such as the condition (S_condition) was selected, those were referenced in the nursing staff administration database and classified based upon the character trait (gregariousness, warmth, excitement seeking, activity, assertiveness, and positive emotions) of nursing staff and the result was obtained as shown in the Figure 3.
Classifications such as this can be realized by using the following SQL search formula:
SELECT hospital ward, character trait, COUNT (*)
FROM nursing staff administration database GROUP BY hospital ward, character trait In the above search formula, the conditions and categories are specified after SELECT and the conditions based on which the classification is made are specified after GROUP BY. COUNT (*) is a function to count the number of data that fits the category and condition.
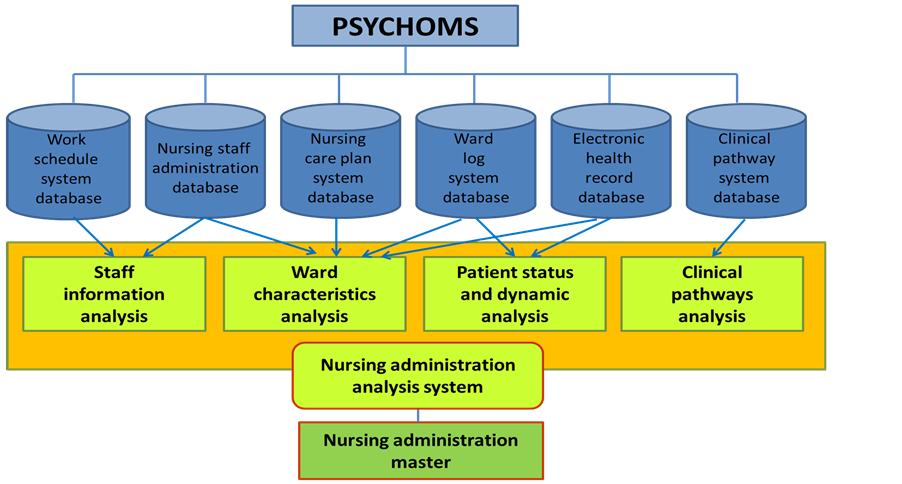
Figure 1. Framework of the databases for the nursing administration analysis system.

Figure 2. Classification of information for nursing administration analysis.
Figure 3 shows an example of the SQL search formula for obtaining the number of nurses in each ward for each type of character trait and the results retrieved.
This methodology is constructed so that it memorizes the previous analytical result and makes an analysis based on the new condition (S_condition) in addition to the previous analytical result EF (1).
In other words, as shown in Formula (2) mentioned below, if the first analytical result is EF (1), it is possible to make an analysis with a new condition (S_condition) in addition to the previous analytical result EF (1).
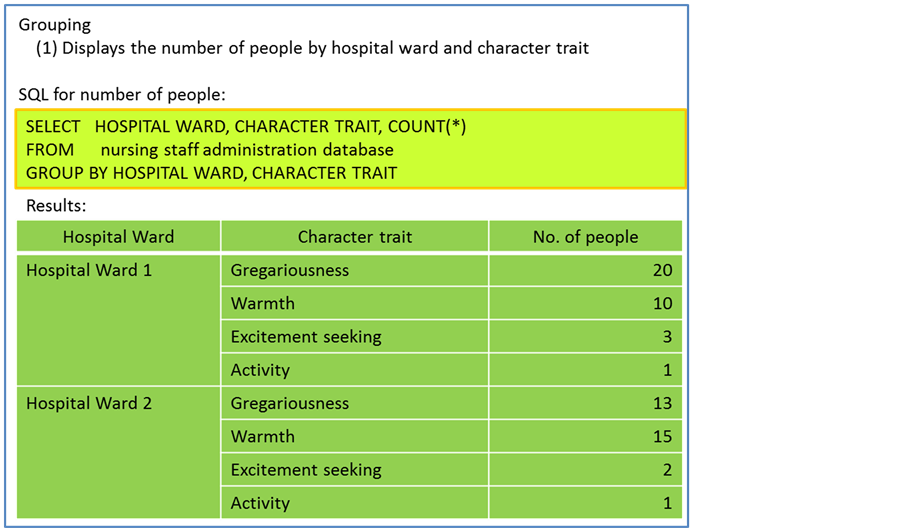
Figure 3. Classification results: Number of nursing staff by hospital ward and by character trait.
[Formula 2]
 (2)
(2)
Where EF (1) is the first analytical result, x is the selected condition, i = the factor meeting the condition, j is the factor meeting condition x, m = the total number, and S_condition is the selected condition.
For example, in order for a new condition (character trait) to be added to the first analytical result EF (1), a new analytical result classified by “gender” can be expressed as shown in Figure 4. In this case, the SQL search formula is as follows:
SELECT hospital ward, character trait, gender, COUNT (*)
FROM datatable_1 GROUP BY hospital ward, character trait, gender The datatable_1 in SQL search formula is memorized information from the previous analytical result EF (1). Similarly, at the n-th analysis, it is possible to make a new analysis by adding a new condition (S_condition) to EF (n − 1), the datatable converted from the previous analytical data.
3.2. Formula and an Example of Displayed Extracted Data
The following is an explanation on how to extract data by limiting the conditions: In this case, it is possible to further reduce conditions by adding a new condition (S_condition) to the previous analytical result EF (n − 1).
For example, in the SQL search formula, specify the items to be shown after SELECT and specify the condition to obtain staff information after WHERE. If there is more than one condition, connect them with “AND”. Formula (3), mentioned below, shows a new restriction by adding a new condition to the previous analytical data EF (2).
[Formula 3]
 (3)
(3)
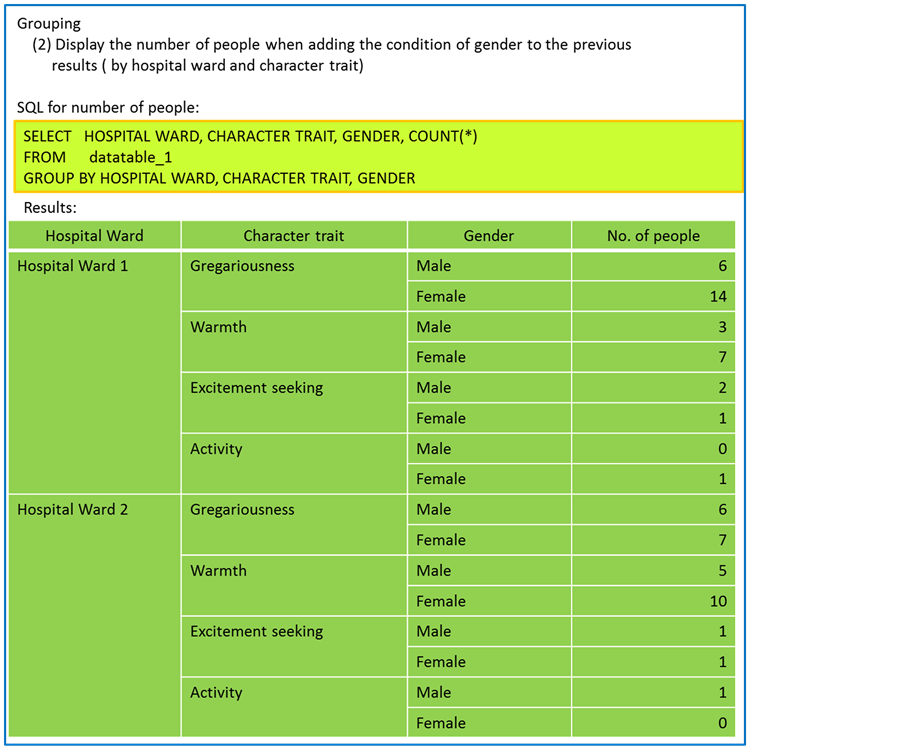
Figure 4. Classification results: Number of nursing staff by hospital ward, by character trait and by gender.
EF (2) is a table converted from the second analytical results. For example, when a restriction was made by adding the gender “male” to the previous analytical result EF (2), the SQL search formula was as follows:
SELECT hospital ward, character trait, gender, COUNT (*)
FROM datatable_2 WHERE gender = male The datatable_2 in SQL search formula memorizes information from the previous analytical result EF (2). As shown above, it is possible to limit the results by adding a new condition (S_condition) to the data table converted from the previous analytical result EF (n − 1).
[Formula 4]
 (4)
(4)
EF (n − 1) is the n − 1 analytical results.
The following figures are shown as an example of analysis result. To extract data after further narrowing down the conditions, the name of the item is specified after SELECT. Conditions for retrieving staff information are specified after WHERE. AND is used to specify more than one condition. The results are displayed as shown in Figure 5.
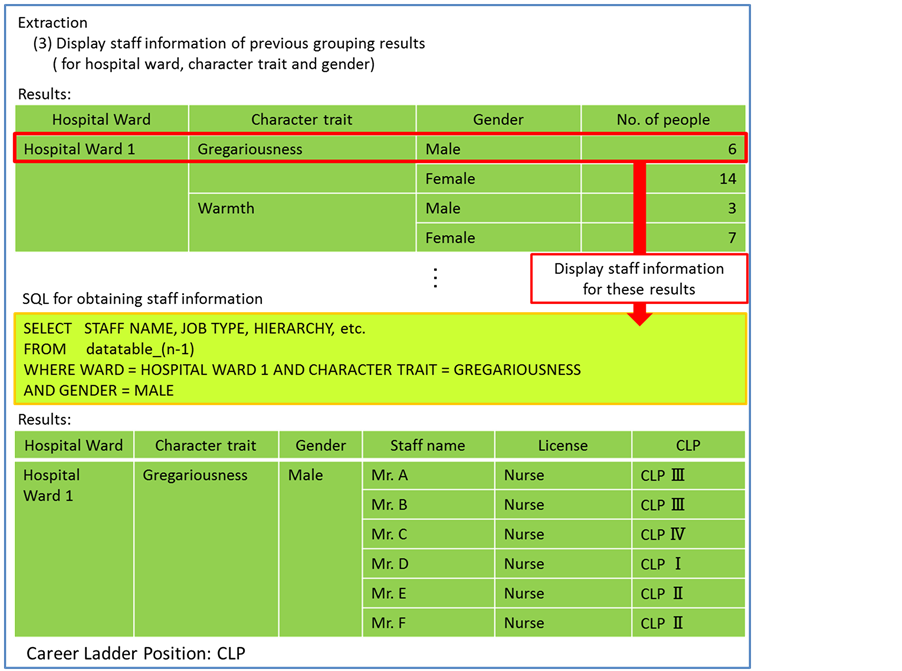
Figure 5. Extraction results: information on male staff with a gregariousness character trait in the hospital ward 1.
As the result of information analysis, these images which the nurse administrator will perform are shown below. When “bed occupancy rate, all hospital wards” is selected as the conditions, the bed occupancy rate for each hospital ward is displayed in a list. The graphical display can be selected to show the results of the graph, as in Figure 6(a). When “all hospital wards, number of direct care patients per level of care need” is selected as the conditions, the results will look like those shown in Figure 6(b).
For example, when selecting the conditions, “overtime hours per month, staff name, number of years’ experience” gives the search results shown in Figure 7.
The following figures show the results of analysis of the variants of clinical pathways. For example, selecting, “variance in examination on admission, computed tomography (CT) and magnetic resonance imaging (MRI) findings, clinical pathway for schizophrenia, used in acute treatment wards” as search conditions gives the result shown in Figure 8(a). Adding “reasons for variance” as a further condition gives the results shown in Figure 8(b).
 (a) (b)
Figure 6. Example of the classified results. (a) Bed occupancy rate; (b) Number of direct care patients by level of care need.
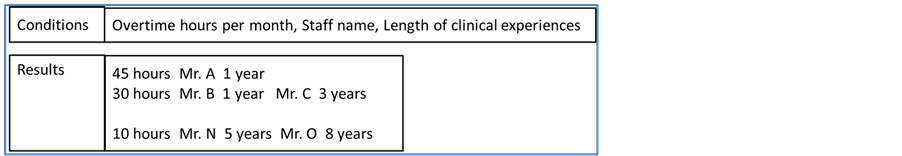
Figure 7. Example of the extracted results.
 (a)
(a)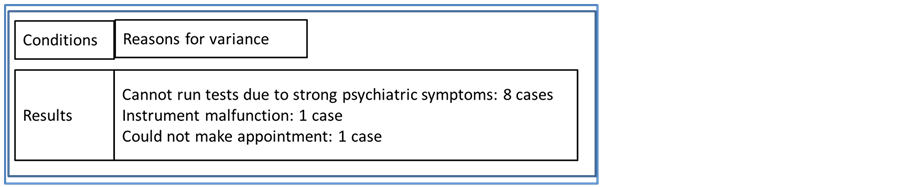 (b)
(b)
Figure 8. Example of results of variance analysis for the clinical pathway. (a) Total count of variance; (b) Reasons for variance.
4. Discussion
This methodology features the use of two methods, classification and extraction, to analyze quantitative and qualitative data. Operators can simply select desired conditions to automatically display the information they want, such as ward characteristics, or characteristics of nurses that should be placed in a certain ward and variance characteristics of clinical pathways, without requiring expertise in statistics. As shown in Figures from 4 to 8, the methodology significantly decreases the amount of time required for nurse administrators to collect and organize information and makes it easy to carry out various types of simulations. Such information can be valuable for use in nursing administration aimed at improving healthcare services. It is also highly adaptable in information management, as it can be applied for nursing and hospital management.
The methodology can freely combine quantitative and qualitative data to create output of information needed by nurse administrators. As an example of information obtained by classifying data, we showed the bed occupancy rate and number of nursing care patients per ward. These are important values that determine nursing per sonnel arrangement and revenue of the hospital, among other variables, and are important for carrying out nursing care administration [21] . In particular, a measure of how busy nursing staff is in a hospital ward is information that is highly valued by nurse administrators, and analysis and assessment of the degree of pressure of work of hospital ward can help prevent healthcare accidents [22] . It can also help to prevent a decline in services or job turnover by nurses due to chronic fatigue resulting from a nursing shortage [23] -[26] .
Consider the quality of physical nursing care provided by nurses. In the case of bed baths, for example, the procedure, skills needed and time required will vary with the patient’s level of care need. Accordingly, the number of direct care patients per level of care need (Figure 6(b)), enables prediction of the volume of care in a ward, which is useful knowledge for assessing the degree of pressure of work of hospital ward.
Visualization of the bed occupancy rate per ward or for the entire hospital or busyness of a ward cannot only help to estimate revenue for the respective ward or hospital overall, but can also aid nurse administrators in making decisions about the number of nurses needed to obtain earnings or to what ward nurses should be allocated. Variables that are represented graphically in this methodology can be set freely by nurse administrators. In other words, they can easily visualize factors such as the degree of pressure of work of hospital ward.
Alternatively, as a method for extracting data, examples were given of specifying conditions and examining certain employees or performing variance analysis. Creating conditions of, “male staff with a gregariousness temperament and career ladder position IV in the hierarchy” for allocation to hospital ward 1 extracts and displays only employees that meet all the conditions (Figure 5), such conditions can be changed to display the suitable employees for each type of ward.
Hospital nursing administration is currently carried out by making decisions from the labor-intensive method of notes jotted down in a notebook or nurse director are collecting information from the head nurse. If the nursing administrator is skilled in information processing, they can use Microsoft Excel or other software programs to organize the data—a method that is very time-consuming. Using the methodology to select the desired extraction conditions, the nursing administrator can quickly display any information desired from a large volume of data, and easily perform various types of simulations.
Displaying the years of experience and name of staff by number of overtime hours of nursing staff (Figure 7) can aid in performing analysis of trends among nursing staff who work many overtime hours. Also, categorizing allocated nurses by skill level and combining this with the results of overtime hours for a cross-border comparison can enable assessment of the appropriateness of combinations of allocated nurses.
In addition, clinical pathways are important for improving outcomes in healthcare services in psychiatric wards [27] , and analysis of variance is essential for ongoing improvement of clinical pathways [28] [29] . Despite this, such analysis is often lacking. One reason for this may be that variance accumulation and factor analysis takes time. The methodology developed can be used to freely select conditions from variance information stored in PSYCHOMS®, such as types of pathways that the administrator wishes to analyze, time period, factors of pathways, causal factors and other factors to obtain analysis results.
In this study, the specific methodology for developing nursing administration analysis and the graphic screen to exhibit the development of this system were illustrated. It is necessary to develop this system and do the clinical test of this system in the future.
5. Conclusion
The methodology for developing a nursing administration analysis system was designed and developed for the purpose of illustrating the utility of the PSYCHOMS®. This system captures and analyzes information required for nursing administration and stored in PSYCHOMS® as needed. This information can be displayed as desired information in line with the individual needs of nurse administrators. This methodology reduces the amount of time required for nurse administrators to collect and organize information and convert it into time for making informed considerations in order to devise decisive strategies for improving the quality of nursing care services. It can therefore increase the quality and efficiency of nursing administration.
Acknowledgements
This study was supported by a grant for Strategic Information and Communications R&D Promotion Program (SCOPE) of Japan (No. 122309008).
References
- Sinkkonen, S., Koponen, H. and Nuutinen, K. (1992) Current and Future Work Roles of Hospital Nursing Directors. Hoitotied, 4, 60-71.
- Omoike, O., Stratton, K.M., Brooks, B.A., Ohlson, S. and Storfjell, J.L. (2011) Advancing Nursing Leadership. Nursing Administration Quarterly, 35, 323-332. http://dx.doi.org/10.1097/NAQ.0b013e31822f1529
- Tanioka, T., Kataoka, M., Yasuhara, Y., Miyagawa, M. and Ueta I. (2011) The Role of Nurse Administrators and Managers in Quality Psychiatric Care. The Journal of Medical Investigation, 58, 1-10. http://dx.doi.org/10.2152/jmi.58.1
- Tanioka, T., Chiba S., Onishi, Y., Kataoka, M., Kawamura, A., Tomotake, M., et al. (2013) Factors Associated with Discharge of Long-Term Inpatients with Schizophrenia in Japan: A Retrospective Study. Issues in Mental Health Nursing, 34, 256-264. http://dx.doi.org/10.3109/01612840.2012.742602
- Pitkänen, A., Hätönen, H., Kuosmanen, L. and Välimäki, M. (2008) Patients’ Descriptions of Nursing Interventions Supporting Quality of Life in Acute Psychiatric Wards: A Qualitative Study. International Journal of Nursing Studies, 45, 1598-1606.
- Callaly, T. and Arya, D. (2005) Organizational Change Management in Mental Health. Australas Psychiatry, 3, 120-123. http://dx.doi.org/10.1080/j.1440-1665.2005.02173.x
- Shur, R. and Simons, N. (2008) Quality Issues in Health Care Research and Practice. Nursing Economics, 26, 258-262.
- Taguchi, M. and Tsuruta, K. (2009) Study of Data Items Used by Nurse Administrators in Operating Facilities. Japanese Red Cross College of Nursing Bulletin, 23, 27-35, in Japanese.
- NTT DATA Mathematical Systems Inc. https://www.msi.co.jp/english/
- Roger, K., Collet, C., Fumai, N. and Petroni, M. (1992) Nursing Workload Management for a Patient Data Management System. Proceedings of Fifth Annual IEEE Symposium on Computer-Based Medical Systems, Durham, 14-17 June 1992, 216-223. http://dx.doi.org/10.1109/CBMS.1992.244945
- Welton, J.M. (1997) Development of a Computerized Database for a Nursing Quality Management Program. Studies in Health Technology and Informatics, 46, 82-87.
- Zhang, H., Zhang, H. and Sun, J. (2012) The Information Platform Structure about the Comprehensive Evaluation System Model for Nursing Outcomes. Proceedings of 2nd International Conference on Consumer Electronics, Communications and Networks (CECNet), Yichang, 21-23 April 2012, 671-673.
- Kontio, E., Lundgren-Laine, H., Kontio, J., Korvenranta, H. and Salanterä, S. (2013) Information Utilization in Tactical Decision Making of Middle Management Health Managers. Computers, Informatics, Nursing, 31, 9-16. http://dx.doi.org/10.1097/NXN.0b013e318261f192
- Wang, X.S., Nayda, L. and Dettinger, R. (2007) Infrastructure for a Clinical-Decision-Intelligence System. IBM Systems Journal, 46, 151-169. http://dx.doi.org/10.1147/sj.461.0151
- Tanioka, T., Osaka, K., Chiba, S., Parker, C., Yasuhara, Y., Locsin, R., et al. (2011) PSYCHOMS®, An Electronic Nursing Management System to Facilitate Interdisciplinary Communication and Improve Patient Outcomes in Psychiatric Hospitals. Proceedings of 7th International Conference on Natural Language Processing and Knowledge Engineering (NLP-KE), Tokushima, 27-29 November 2011, 447-453. http://dx.doi.org/10.1109/NLPKE.2011.6138241
- Gillies, D.A. and Yano, M. (1986) Nursing Management: A Systems Approach. W.B. Saunders Company/Herusu Shuppan, Orlando. (In Japanese)
- Japanese Nursing Association Nurse Function Committee (1995) Nurse Operating Indicator. Japanese Nursing Association Publishing Company, Tokyo. (In Japanese)
- Iseda, A., Kotani, S., Kamitsuru, S., Kashiwagi, K., Kashiwagi, M. and Okaya, K. (2005) Developing Nursing Database to Examine Nurse Staffing Ratios—Philological Consideration of the Relationship between Nursing Services and the Patient Outcomes. The Journal of the Japan Academy of Nursing Administration and Policies, 9, 45-59.
- Miyagawa, M., Doi, J., Yasuhara, Y. and Tanioka, T. (2013) Clarification of a Staff Assignment Process Based upon the Thought Process of Nursing Administrators in Psychiatric Hospitals. Shikoku Acta Medica, 69, 73-78. (In Japanese)
- Mitchell, N., Randell, R., Foster, R., Dowding, D., Lattimer, V., Thompson, C., Cullum, N. and Summers, R. (2009) A National Survey of Computerized Decision Support Systems Available to Nurses in England. Journal of Nursing Management, 17, 772-780. http://dx.doi.org/10.1111/j.1365-2834.2009.00986.x.
- Miyagawa, M., Yasuhara, Y., Tanioka, T. and Locsin, R. (2013) Clarification of a Demand Function Required for A Staff Assignments Support Program for Nursing Administrator Use in Psychiatric Hospitals. Information, 17, 361-366.
- Akiyama, M., Koshio, A. and Kaihotsu, N. (2010) Analysis of Data Captured by Barcode Medication Administration System Using a PDA; Aiming at Reducing Medication Errors at Point of Care in Japanese Red Cross Kochi Hospital. Studies in Health Technology and Informatics, 160, 774-778.
- Leong, C.S. (2011) Factors Contributing to Contemporary Nursing Shortage in Macao. Journal of Nursing Management, 20, 491-501. http://dx.doi.org/10.1111/j.1365-2834.2011.01272.x
- Jenko, M., Gillette, B. and Gonzalez, L. (1990) The Development of an Evaluation Tool for Unit-Based Quality Assurance. Journal of Nursing Quality Assurance, 4, 63-70.
- Seki, Y. (2008) Working Condition Factors Associated with Time Pressure of Nurses in Japanese Hospitals. Journal of Occupational Health, 50, 181-190. http://dx.doi.org/10.1539/joh.L7031
- Kerfoot, K. (2006) Beyond Busyness: Creating Slack in the Organization. Nursing Economics, 24, 168-170.
- Cheah, J. (2000) Clinical Pathways—An Evaluation of Its Impact on the Quality of Care in an Acute Care General Hospital in Singapore. Singapore Medical Journal, 41, 335-346.
- Matsumoto, K., Tanioka, T., Osaka, K., Kawamura, A., Ueno, S., Ren, F., Takasaka, Y., Barnard, A., Locsin, R. and Omori, M. (2009) Developing the Method of Server Controlled Outcomes Management and Variance Analysis. Electronic Notes in Theoretical Computer Science, 225, 221-237. http://dx.doi.org/10.1016/j.entcs.2008.12.076
- Iwata, H., Tsumoto, S. and Hirano, S. (2012) Data-Oriented Construction and Maintenance of Clinical Pathway Using Similarity-Based Data Mining Methods. IEEE 12th International Conference on Data Mining Workshops (ICDMW), Brussels, 10 December 2012, 293-300.