Intelligent Information Management
Vol.3 No.5(2011), Article ID:7190,6 pages DOI:10.4236/iim.2011.35024
A New Model for Strategy Formulation Using Mahalanobis-Taguchi System and Clustering Algorithm
Department of Industrial Engineering, Mazandaran University of Science and Technology, Babol, Iran
E-mail: *irajarash@rediffmail.com
Received May 27, 2011; revised June 11, 2011; accepted June 20, 2011
Keywords: Strategy formulation, Clustering, Mahalanobis-Taguchi System
Abstract
The devastating complexity of decision making in severe dynamic competitive environment of the universe, has forced the wise managers to have relevant strategic plans for their firms. In this paper, a new approach by utilizing Mahalanobis-Taguchi System (MTS) and clustering algorithm in formulating the strategy has been proposed. In this approach, first by performing environmental analysis all internal and external factors affecting organization will be listed. Then the long range goals will be identified by top managers. By applying MTS the main set of factors affecting goals will come out. By identifying main factors, the goal-factor matrix will be formed. At this stage, by using clustering algorithm the proper clusters containing goals and factors influencing them will be constructed. Finally, from the created clusters the appropriate strategies would be generated. The advantage of applying this method is its accuracy and ease of applications in the environment with plenty of goals and numerous factors with interactions among them.
1. Introduction
The process of strategic management is generally consists of three stages, strategy formulation, strategy implementation, and strategy evaluation that will enable an organization to achieve its long-term goals, as shown in Figure 1. Strategy formulation is sometimes referred to as determining where you are now, where you want to go, and finally how to get there. It is consist of performing a situation analysis, self-evaluation and competitor analysis in both internal and external environment, set the objectives concurrent with this assessment.
Among the tools, Strengths, Weaknesses, Opportunity, and Threats (SWOT) analysis, which evaluates the opportunities, threats, strengths and weaknesses of an organization, is the most common [1]. SWOT analysis summarizes the most important internal and external factors that may affect the organization’s future, which are referred to as strategic factors [2]. The external and internal environments consist of variables which are outside and inside of the organization, respectively. The organization management has no short-term effect on either type of variable [3]. Comprehensive environmental analysis is important in recognition of the variety of internal and external obligations with which an organization is encountered. These forces may comprise potential motivators, and also may involve potential limitations regarding the performance of the organization or the objectives that the organization wishes to achieve [3].
Different combinations of the four factors from the matrix can assist in determination of strategies for longterm progress. If used properly, SWOT can provide a good basis for strategy formulation [2]. However, SWOT analysis is not without weaknesses in the measurement and evaluation steps [1,4]. In conventional SWOT analysis, the magnitude of the factors is not quantified to determine the effect of each factor on the proposed plan or strategy [5]. While it does pinpoint the factors in the analysis, individual factors are usually described briefly and very generally [1]. More specifically, SWOT allows analysts to categorize factors as being internal (strengths and weaknesses) or external (opportunities and threats) in relation to a given decision, and thus enables them to compare opportunities and threats with strengths and weaknesses [6]. It does not consider the interactions among factors and goals effectively.
The Traditional, qualitative SWOT analysis method is an environmental analysis method that integrates the internal strengths/weaknesses and external opportunities/ threats. Analysis of internal strengths and weaknesses is

Figure 1. The process of strategic management.
based primarily on evaluation of how an enterprise carries out its internal work, such as management, work efficiency, and research and development. The external factor evaluation matrix (EFE) and internal factor evaluation matrix (IFE) methods quantitatively evaluate a facility’s competitiveness in accordance with its successful factors of internal and external environment. The competitive profile matrix (CPM) method identifies business advantages and disadvantages using EFE and IFE. The analytical results are based on quantitative methodology, different from the qualitative estimation of the traditional SWOT analysis method [7]. The SWOT analytical method is commonly used in strategy formulation [8,9].
However, these environmental analysis methods are unable to carry out a complete examination of the enterprise’s internal and external factors, and also cannot easily compare the competitive relationships among several enterprises simultaneously. Resource based view (RBV) was first introduced by Penrose in the late 1950s, largely reintroduced by Wernerfelt [10] in the 1980s, and became a dominant framework in the 1990s [11].
In this paper it has been tried to create developing strategies on a more accurate and objective bases. The environmental analysis including opportunities and threats, in the light of organization strengths and weaknesses will be done. All factors affecting organization will be listed regardless of how important they are. Here, by applying MTS, the prime set of factors affecting the organization will be extracted. At this stage, it has been proposed that the extracted internal and external factors be clustered with predetermined goals of the organization by weighting the relationship and impact of each factor to each individual goal. By this means, the goals which have higher similarity (based on impact of factors on goals) would embed in the same cluster. By utilizing extracted clusters, the developing strategies could be created and the action plans around each individual strategy be defined.
2. Basic Concepts
2.1. Strategy Formulation
Strategy formulation can take place at three levels in organization. First, functional-level strategy which is the approach undertaken by any functional area, such as marketing or research and development, to achieve business unit objective and corporate strategies by maximizing resource productivity. Second, business-level strategy normally occurs at the business unit or product level, and it stresses on improvement of the competitive position of a corporation’s products or services in the specific industry or market sector and are consist of competitive and cooperative strategies. Third, corporate-level strategy defines a company’s overall direction in terms of its general attitude and insight toward growth and the management of its various businesses and product lines. Corporate strategy comprises directional strategy, portfolio analysis, parenting strategy, and international strategy. Strategy formulation consists of two basic components one is situation analysis which is the process of finding a strategic fit between external opportunities and internal strengths while working around external threats and internal weaknesses. And the other component is presenting strategies based on predetermined goals. In the next stage, by applying Mahabolonis-Taguchi system (MTS) a purification process is performed and for presenting organization strategies the systematic development of clustering concept has been utilized. This has been done not only for considering the current situations, but also for considering the impact of each factor on the goals which have been set by authorities.
2.2. Mahalabonis Taguchi System
Mahalabonis is the founder of Indian Statistical Institute, and he introduced a statistical tool called the Mahalabonis distance (MD), used to distinguish the pattern of a certain group from other groups. The Mahabolonis-Taguchi system (MTS) is Taguchi’s design of a systematic method for using the MD [12]. The objective of MTS is to develop and optimize a diagnostic system with a measurement of abnormality. In MTS [13], the signal-to-noise (SN) ratio is used to assess the effectiveness of a system. Moreover, Taguchi used the system not only for diagnosis but also for anticipating/predicting systems. Thus, MTS is used to develop and optimize a system of multivariable diagnosis, pattern recognition, and prediction of particular events [12].
The steps to design and optimize the MTS are as follows:
Phase 1: Generation of normal space Step 1. Define the normal group.
Step 2. Define k variables.
Step 3. Gather data from the normal group on k variables with sample size n.
Step 4. Calculate the MD for each sample from the normal group as follows:
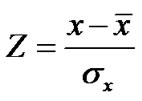
1) Compute the mean and standard deviation for each variable and normalize the data.
2) Compute the correlation matrix.
3) Compute the inverse matrix of the correlation matrix.
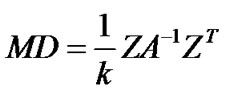
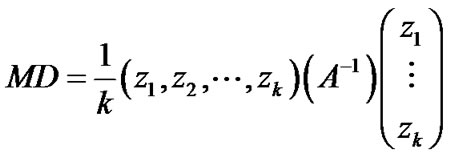
4) Compute MD for each sample from the normal group. Each sample in a normal group is a vector of (z1,···, zk). For each sample, MD is given by the following equation:
The average of MD is 1.00. Note that it is very rare to have MD value greater than 5.0; MD for an abnormal sample should become much larger than 5.0; MD provides a measurement scale for abnormality.
At this point it is important to recognize the following:
• The objective of MTS is to develop a measurement scale that measures abnormality. Another word to define the zero point and one unit.
• MTS measures abnormality. Only the normal group has a population.
Phase 2: Confirmation of discrimination power Step 5. Gather data on k variables for samples from outside the normal group.
Step 6. Calculate the MD for each sample from outside the normal group.
Step 7. Evaluate the discrimination power. In some studies it may be sufficient to have a MTS that can discriminate x percent of bad samples. For example, there is a situation called “no trouble found” for those samples that come back for warranty claims. In that situation, discriminating only 25% can be extremely beneficial. After confirming a good discrimination, we are prepared to enter the optimization phase.
Phase 3: Identification of critical variables and optimization Step 8. Optimize the MTS. Evaluate critical variables. Optimize the number of variables. Define the optimum system as follows:
1) Assign variables to a two-level orthogonal array. Define level 1, to use the variable, and level 2, not to use variable.
2) Redo MTS for each run of the orthogonal array. First, calculate the MD for the abnormal sample as data and then use SN ratio as an assessment criteria for discrimination power. The SN ratio for a larger-the-better response is used to assess the discrimination power. Ideally, a dynamic SN ratio where M is the true abnormality level and y is the computed MD value would be the ideal assessment.
3) Make a response graph for the SN ratio. Evaluate how each variable contributes to discrimination power. By considering that the higher the SN ratio, the better the discrimination power is.
4) Confirming the optimum design.
2.3. Clustering
In this section the systematic generation of strategies is of a significant issue. At first, it has been tried by applying clustering technique, organization goals associated with different factors which have been founded from MTS, be relevantly clustered. From yielding clusters the developing strategies in more accurate and reliable form will be extracted. The important point at this stage is that the predetermined long-term goals which have been set by organization experts associated with factors that affect more on goals will be positioned in the same clusters. The clustering is based on the rate of impact of each factors founded from environmental phase on the goal. To develop a clustering algorithm some issues have been noticed in the literature such as the suitable level in the hierarchy, number of the clusters and cluster validity. Moreover, correlations among factors and goals which construct the clusters are of significant parameters in generating strategies. For overcoming these obstructions, we have proposed a new clustering algorithm which handles the issues above. Hence, we have introduced average distance value of factor in each cluster as the level of the hierarchy and used hierarchical agglomerative method to determine the number of the clusters. In addition, to validate the constructed clusters, the strategy-factor and strategy-goal clusters are built. Finally, for considering the correlation among all factors and goals, the impact of factors on each goal are considered as input data of the clustering algorithm. And also, the logic of the clustering construction is based on the distance of the factor’s impacts on each goal.
3. Proposed Clustering Algorithm
Here, we apply a new clustering algorithm which is categorized as hierarchical agglomerative method. In fact, first each factor is considered as a cluster, and then the clusters are merged until the degree of internal similarity among factors in clusters is maximized and the intra-similarity among clusters is minimized. Crucial aspect in clustering is the similarity measure. The formulation of clustering problem leads to a sophisticated optimization problem, with the objective functions depending on the choice of the similarity measure. It is very important to notice that a good choice of similarity measure can yield an improvement in clustering performance. The similarity between two components is computed with one of several similarity measures based on two corresponding feature vectors; e.g., cosine measure, Jaccard measure and Euclidean distance measure [14]. The distance matrix is applied to measure the factors and goals similarity. The distance matrix computes the distance of the two vectors and is used to separate nonhomogeneous factors and goals. The following notations are used to cluster goals and factors.
Notations:
Eij: Value of ith factor in jth goal.
Wj: Weight of jth goal.
Pij: Weight of ith factor in jth goal.
Mi: Mean value of ith factor.
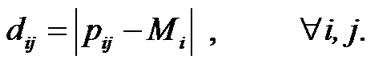
dij: Distance of mean value of ith factor from Pij.
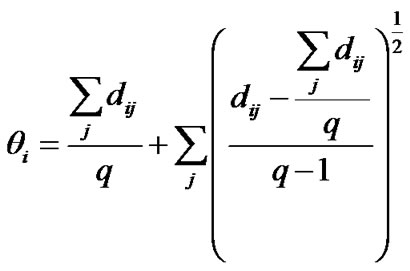
θi: Threshold of ith factor.
FGM: Factor-goal matrix.
WFGM: Weight factor-goal matrix.
ψi: A set of goals being impacted by ith factor.
C: Cluster index.
n: number of sets.
 : Average distance value of factors in class C.
G: Total number of goals.
We can now state the steps of factor-goal clustering algorithm.
Algorithm: Factor-goal clustering algorithm.
Step 1: Generate factor-goal matrix (FGM) by considering the factor’s impact (Eij) on goals based on information acquired from experts.
Step 2: Generate weighted factor-goal matrix (WFGM) by setting:
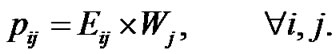 (1)
(1)
Step 3: Calculate factor-goal distance matrix by:
 (2)
(2)
 (3)
(3)
Step 4: Generate binary factor-goal matrix by:
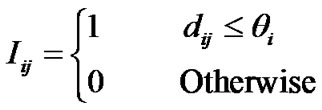 (4)
(4)
where  is:
is:
 (5)
(5)
Step 5: Constitute primary clusters. At this stage, the clusters would be formed as many as the number of factors. Then, by considering factor-goal (binary) matrix, the objectives in each row with a value of one would be assigned to one cluster.
Step 6: Let C = 1 and j = 1. If the distance dij compared to average distance value of factors in class C (that is, 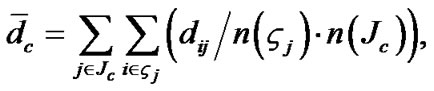 where
where  is a set of goals belong to cluster c and
  is a set of influential factor belong to the goal j), is greater than the confidence level α (as is determined by experts), and the jth goal belongs to another cluster then eliminate goal j from cluster C.
Step 7: Let j = j + 1. If  then go to Step 6.
Step 8: Let C = C + 1. If  then go to Step 6, else stop.
4. Strategy Generation
In traditional strategic planning, the organization’s strategy experts create strategies for implementation by utilizing different techniques. The points which would not be considered precisely in these methods are the diverse conditions of the organization based on factors, goals and the interactions among them. Here, after determining the goal-factor clusters, we pursue developing a strategy, relevant to the goals at that cluster according to the present condition of the clusters. This allows us to survey the present condition of the organization in more detail by considering various conditions. On the other hand, since the convergent factors and long term goals fall in a cluster, it is more facile to generate strategies, while in the ordinary SWOT method the decision maker decides according to a general condition and then generates strategies. In fact, our emphasis is to state strategies for individual clusters instead of organization strategy as a whole. This way, the generation of strategies could be more specific and accurate, considering various aspects of clusters. The main advantages of our proposed approach can be stated as follows:
1) Facilitating strategy generation for giant organizations with a large number of factors and goals.
2) Considering interactions among all goals and factors in an integrated form.
3) Generating strategy according to the cluster’s different position in the SWOT space.
4) Aligning homogenous goals by clustering and generating strategies for each cluster.
5) Preventing unnecessary costs because of generating relevant strategies for the clusters.
6) Prompting organization development by concentrating on clusters of goals instead of individual goals.
Of course, the limitation of this model is where the organization is small and has a few goals and strategies and making different clusters are not possible.
5. Validation
To investigate the interrelationship among proposed strategies, goals and factors, goal-strategy and factorstrategy matrix will be formed. Hence, we ask from the decision makers of the organization to specify the impact of each strategy on factors and goals individually, for forming factor-strategy and goal-strategy matrix. Using these matrices, we cluster the goals and factors in accordance with the impact of strategies on them. If the elements of the new clusters are according to the factor-goal cluster, which is the basis of the proposed methodology, then the proposed strategies are valid; otherwise, the strategic team should propose other strategies. This shows that if the influential factors and strategies of each initial cluster do not fall in the same cluster, then the proposed strategies are not appropriate.
6. Conclusions
In this paper, it has been proposed first to apply Mahabolonis-Taguchi system (MTS) as a one-step filtering for isolating factors which have least effects on the organization. Considering the prime set of important factors on organization, a clustering approach was applied to develop a new strategy formulation by clustering factors and long term goals based on impact of factors on individual goals. To find the influence of factors on goals, a comprehensive environmental analysis was performed. Then, the strategies were presented for each cluster individually, instead of the whole organization. Our main contributions are:
1) Considering all factors affecting organization and purifying them considering the interactions among them.
2) Development of a new strategy formulation process by considering all elements and aspects of organization and the interactions among them.
3) Partitioning organization into different clusters based on the impact of each factor on individual goals.
4) Considering the effect of strategies on the development paths based on clustering approach.
5) Investigating the differences of dated state of organization with the expected expansion of the organization.
6) Facilitating the strategy making process by utilizing an effective clustering approach.
7. References
[1] T. Hill and R. Westbrook, “SWOT analysis: it’s time for a product recall,” Long Range Planning, Vol. 30, No. 1, 1997, pp. 46-52. doi:10.1016/S0024-6301(96)00095-7
[2] M. Kajanus, J. Kangas and M. Kurttila, “The use of value focused thinking and the A’WOT hybrid method in tourism management,” Tourism Management, Vol. 25, No. 4, 2004. pp. 499-506. doi:10.1016/S0261-5177(03)00120-1
[3] G. Houben, K. Lenie and K. Vanhoof, “A knowledge- based SWOT-analysis system as an instrument for strategic planning in small and medium sized enterprises,” Decision Support Systems, Vol. 26, No. 2, 1999, pp. 125-135. doi:10.1016/S0167-9236(99)00024-X
[4] M. H. B. McDonald, “The Marketing Planner,” Butter-Worth-Heinemann, Oxford, 1993.
[5] M. K. Masozera, J. R. R. Alavalapati, S. K. Jacobson and R. K. Shresta, “Assessing the suitability of community-based management for the Nyungwe Forest Reserve, Rwanda,” Forest Policy and Economics, Vol. 8, No. 2, 2006, pp. 206-216. doi:10.1016/j.forpol.2004.08.001
[6] R. K. Shrestha, J. R. R. Alavalapati and R. S. Kalmbacher, “Exploring the Potential for Silvopasture Adoption in South-Central Florida: An Application of SWOT-AHP Method,” Agricultural Systems, Vol. 81, No. 3, 2004, pp. 185-199. doi:10.1016/j.agsy.2003.09.004
[7] K.-L. Lee and S.-C. Lin, “A fuzzy quantified SWOT procedure for environmental evaluation of an international distribution center,” Information Science, Vol. 178, No. 2, 2008, pp. 531-549. doi:10.1016/j.ins.2007.09.002
[8] S. J. Chen, C. L. Huang and F. P. Huang, “Fuzzy Multiple Attribute Decision Making Methods and Applications,” Springer, Berlin, 1992.
[9] F. R. David, “Strategic Management,” 7th Edition, Prentice-Hall, Upper Saddle River, 1998.
[10] B. Wernerfelt, “A resource-based view of the firm,” Strategic Management Journal, Vol. 5, No. 2, 1984, pp. 171-180. doi:10.1002/smj.4250050207
[11] R. E. Hoskisson, M. A. Hitt, W. P. Wan and D. Yu, “Theory and research in strategic management, swings of a pendulum,” Journal of Management, Vol. 25, No. 3, 1999, pp. 417-456. doi:10.1177/014920639902500307
[12] G. Taguchi, S. Chowdhury, Y. Wu, S. Taguchi and H. Yano, “Taguchi’s Quality Engineering Handbook,” John Wiley & Sons, Hoboken, 2005, pp. 397-421.
[13] P. Mahalakshmi and K. Ganesan, “Mahalanobis Taguchi System based criteria selection for shrimp aquaculture development,” Computers and Electronics in Agriculture, Vol. 65, No. 2, 2008, pp. 192-197.
[14] R. Baeza-Yates and R. Ribeiro-Neto, “Modern Information Retrieval,” Addison Wesley, Boston, 1999.