iBusiness
Vol.4 No.1(2012), Article ID:18368,9 pages DOI:10.4236/ib.2012.41005
Smart System Resource Monitoring in Cloud
![]()
Computer Science, National Taipei University of Technology, Taipei, Taiwan, China.
Email: richchihlee@gmail.com
Received January 3rd, 2012; revised February 7th, 2012; accepted February 18th, 2012
Keywords: System Management; Cloud Computing; System Performance Analysis
ABSTRACT
Monitoring the system resources against numerous virtual machines in a cloud computing environment is a challenging task to system administrators. They rely on the system management tools to collect and reveal the utilization of various performance counters of each virtual machine. Such isolated views cannot disclose the real performance behavior of virtual machines. This paper demonstrates how to interpret the resource utilization of these performance counters correctly and how to automate the performance analysis processes to ease the workload of system administrators.
1. Introduction
Many people have mentioned about the benefits of adopting the cloud computing for their business. But before these benefits can be realized, the performance unpredictability driven by software application behavior and its architectture must be seriously resolved especially in a large scale of cloud computing environment [1]. It is a challenging task for system administrators to monitor the performance over numerous virtual machines concurrently in cloud computing environment to mitigate the unpredictability.
The administrator relies on the system management tools to collect the utilization of various performance counters from each virtual machine. The most concerned performance counters are about the utilization of CPU, Memory, and I/O [2]. Currently the administrator needs to decipher the meaning of these performance counters respectively. But these performance counters are correlated. CPU utilization is consumed by workloads, and also by managing the memory and I/O to respond these workloads at the same time. These compound effects make the decipherment against performance counters more difficult.
The administrator requires a novel scheme automatically deciphers the performance counters correctly and making recommendations for further actions against those potential overloaded virtual machines in cloud computing environment. This paper demonstrates a feasible approach to decipher the meaning behind performance counters, and a framework to mitigate the administrator’s workloads in monitoring these virtual machines, thus improves the cloud service quality.
2. Performance Counters Dataset
Modern operating systems provide application programming interfaces (API) to report the utilization about the computing resources from kernel. Operating systems also offer a number of computing resource utilization utilities a subset of the system management tools by calling these APIs to help administrators understand the current states about the system [3]. To support business continuity, the service systems are measured by Quality Attributes [4], such as availability, performance, security, interoperability, and modifiability that are derived from mission or business goals. The Performance quality attribute may be expressed in several different ways, including response time, throughput, or constraints on resource usage [5]. Table 1 shows the most concerned performance counters periodically collected by resource utilization utilities from virtual machines.
The performance counter data are stored on a remote central management server over the network in a structured format such as Comma Separated Values (CSV) file or to a light-weight database.
3. Performance Analysis Framework
Since there are numerous servers running service applications in the cloud computing environment, it is not efficient to have administrators manually monitor performance counters of all servers at the same time. Therefor an intelligent automatic performance counter analysis framework is needed to ensure the service quality is served at agreeable level. The framework is an analytical process that is based on the inference of statistical procedures rather than relying on respective administrators’ personal
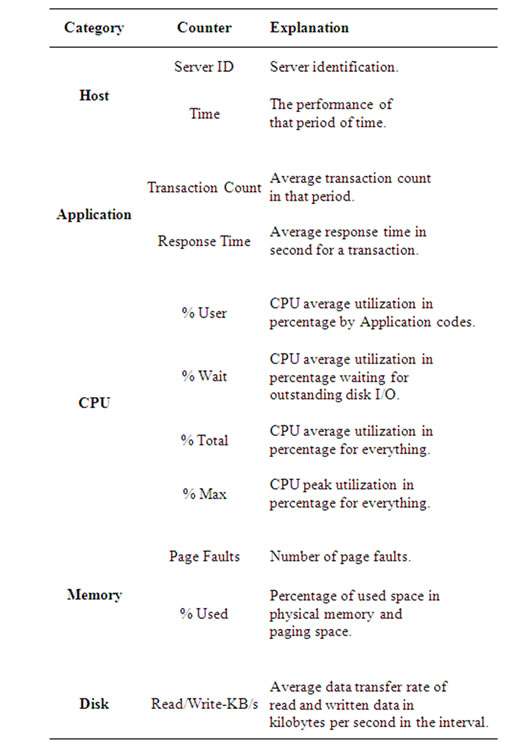
Table 1. Performance counters.
experience. These statistical procedures are about regression analysis. The regression formula shows the coefficients and the significance coefficient of determination i.e. R2 of regression under acceptable confidence level (i.e. 90%, 95%, 99%, and 99.9%).
The Equation (1) shows the general form of regression, y is the dependent performance counter, xn is the independent performance counter, and the β0 ··· βn are the coefficients:
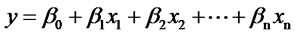 (1)
(1)
Service quality is above all. The framework checks whether the application’s average Response-Time is in proportion to Transaction-Count. When this regression is significant, the framework will 1) project the maximal Transaction-Count at the least-accepted Response-Time; 2) report the moving-average the trend about the growth of both Transaction-Count and Response-Time versus Time; and 3) report the regression of CPU-Utilization versus Transaction-Count which will also project the maximal Transaction-Count at the most-accepted CPUUtilization. The system administrator will take the less Transaction-Count as the allowable margin of reliability.
The framework uses GNU-R as the statistical engine. R is a highly extensible language and environment for providing a variety of statistical and graphical features [6]. It can read data from structure formatted file or database and export statistical results and charts as well. Since system-administrators depend on the daily reports from the framework, it must be built in a robust way using Enterprise Service Bus (ESB) [7] to analyze the performance dataset and make recommendation for each virtual machine.
The Figure 1 illustrates the system architecture of the framework.
The Statistical Job Portal server provides a number of predefined statistical procedures and ad-hoc analysis to users. The ESB server receives messages, the statistical job requests, from the Statistical Job Portal server and dispatches them accordingly. GNU-R Engine is a set of Blade servers executing GNU-R scripts designated by the messages. The script may retrieve data from the Database servers or the File Repository server. The Application servers are user process engines populating source data on the Database servers or the File Repository server. The File Repository server also stores the statistical results expecting users to retrieve later.
4. Empirical Case
Fast changing demands and responsiveness to customers challenges the reliability of a Manufacturing Execution System (MES). A world-class modern semiconductor foundry migrated its MES into a cloud computing environment for better management with less cost. The foundry takes advantage of the proposed system architecture to periodically collect the performance counters for each virtual machine by system management tools. Besides the proposed framework recommendation on the reliable Transaction-Count; the MES administrators developed standard operation procedures (SOP) for their daily checks of performance counters for each virtual machine.
The Figure 2 illustrates the process flow of SOP in
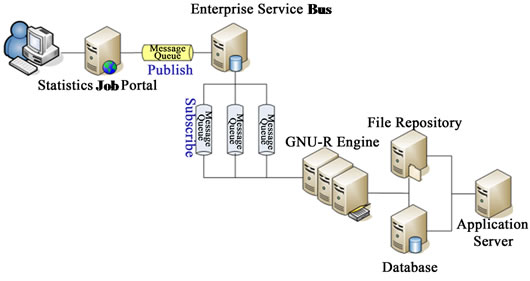
Figure 1. System architecture.
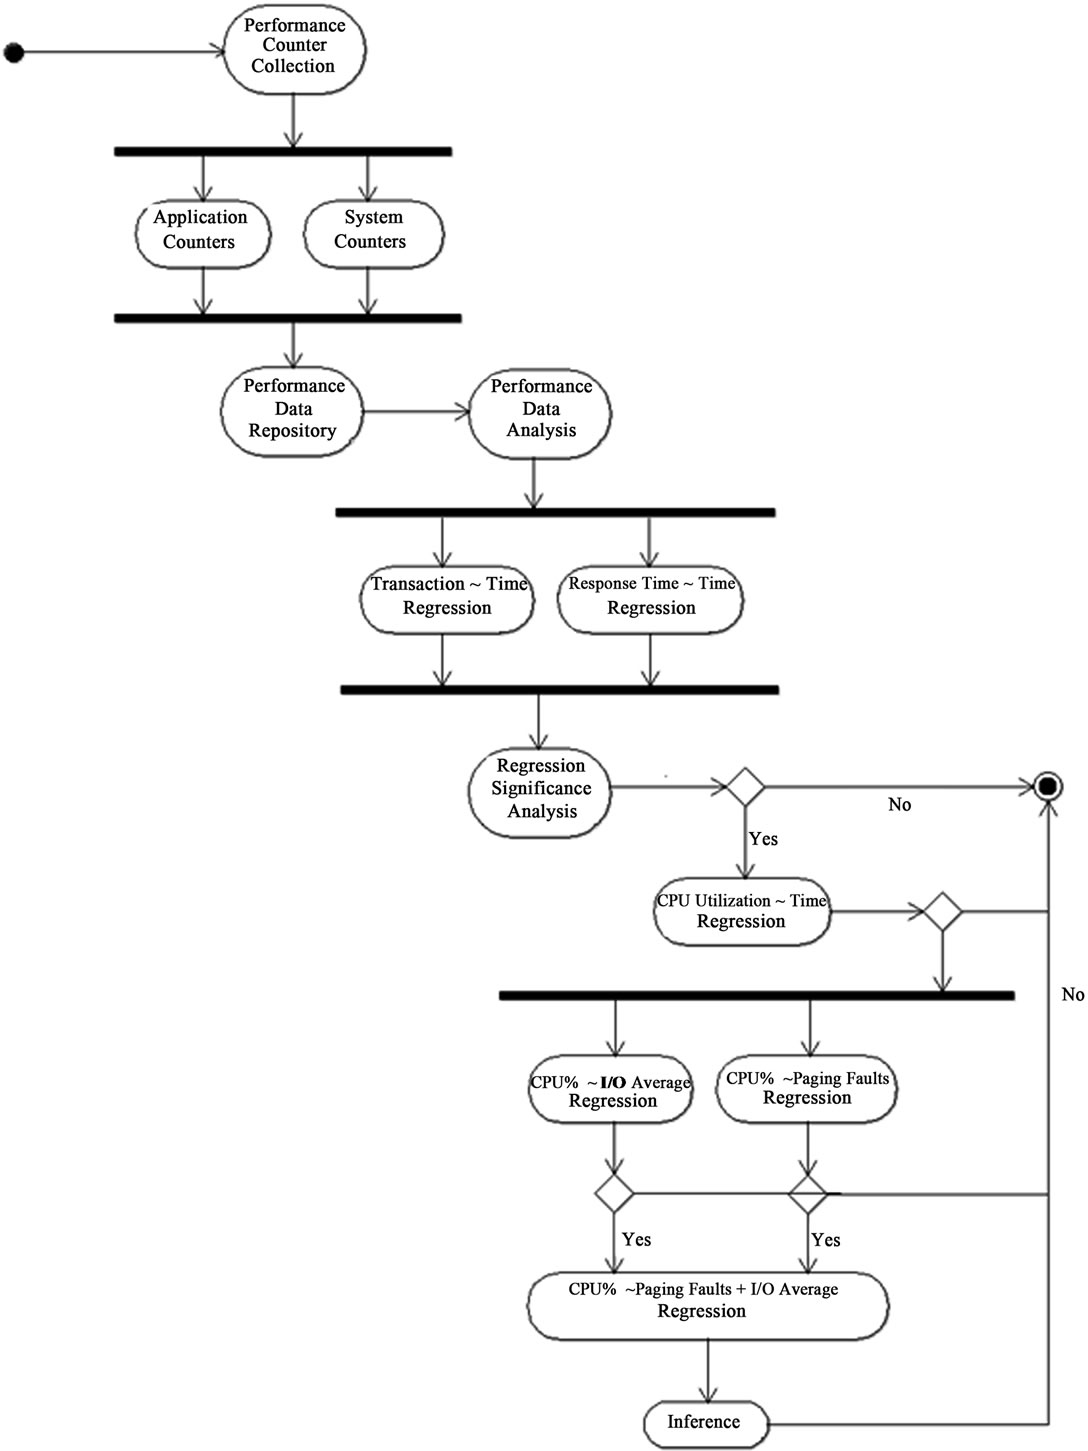
Figure 2. SOP of performance analysis.
Activity Diagram in UML, it starts from Performance Counter Collection, and Performance Data Analysis conducts the following regression statistical tests:
1) Transaction-Count vs. Time is to examine the transaction behavior. If the trend is positive, more computing resources may consider to be assigned into the virtual machine.
2) Response-Time vs. Time is to examine the service behavior of the virtual machine. A narrower variance of Response-Time implies the system’s throughput was steady.
3) If the above regression tests are both significant; this means the Transaction-Count was increasing and the Response-Time became slower also. It is imperative to check whether CPU resource could hold this increasing trend or not.
The regression test of CPU-Utilization vs. Time shall confirm the trend in CPU utilization perspective. If this regression test is also significant, what caused CPU utilization high will determine the latter administrative actions. Two possible reasons may cause CPU utilization high: 1) Paging-Faults (memory moving); 2) I/O-Average. Both CPU-Utilization vs. Paging-Faults and CPU-Utilization vs. I/O-Average regression tests will explain the degree of significance of these tests. If both tests are significant separately, CPU-Utilization vs. Paging-Faults and I/OAverage regression test will show which performance counter or both are significant more. Finally, the Inference of performance analysis will confidently suggest the MES administrators to take proper actions accordingly.
The following performance analysis was a snapshot of a period of time. The proposed framework alerted the MES administrators that a critical virtual machine running database behaved abnormal, further investigation was taken to see if more computing resources should be assigned into the virtual machine. The snapshot transaction was about 7 million while it was expected to hold 13 million transactions a day in average. The MES administrators concerned about the high CPU utilization and wanted to make CPU utilization forecast against the in creasing transactions.
4.1. Transaction-Count Analysis
A time series analysis against Transaction-Count was to understand how database server was impacted by transactions. The Table 2 shows the R script producing the Figure 3 graphics. The graphics showed there were several significant drops about the transactions; however the Transaction-Count trend was increasing with time. The MES administrator reported the production was ramp up on 10/24/2011 which coincided with the analysis.
4.2. Response-Time Analysis
A time series analysis against Response-Time was to un
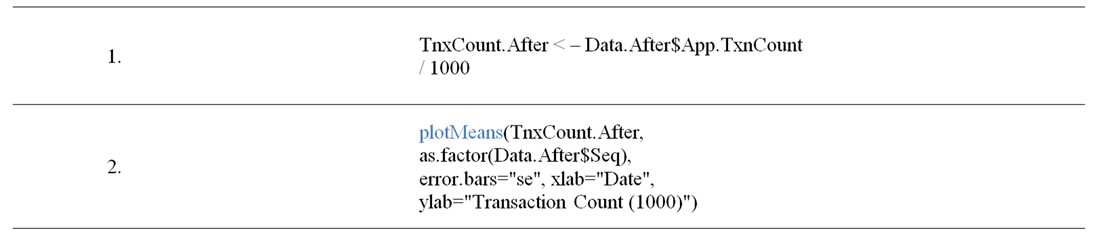
Table 2. R for Transaction-Count ~ Time.
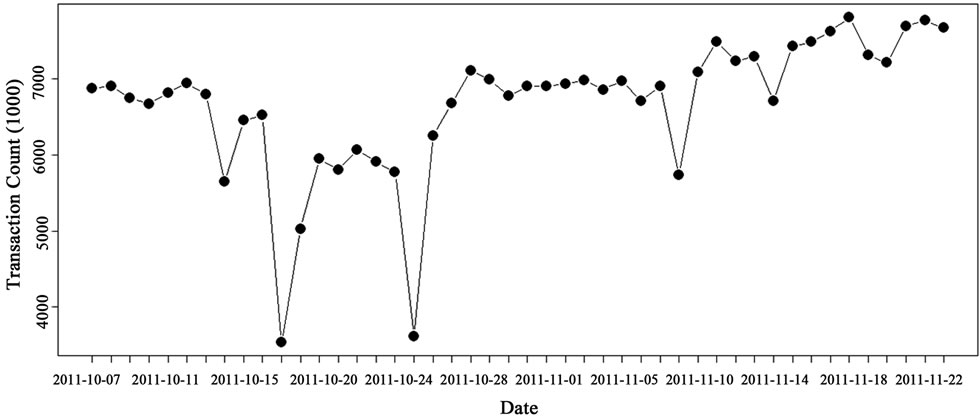
Figure 3. Snapshot: Transaction-Count vs. Time.
derstand how database server responded to the transactions. The Table 3 shows R script producing the Figure 4 graphics. The graphics showed those Response-Times were within the range of 0.35 and 0.40 sec; it was very satisfied and implied the high CPU utilization was attributed to the operating system to maintain a steady service level. The graphics also showed there was a peak of Response-Time on 10/24/2011, reported by MES administrators, several equipment were under maintenance caused the unpleasant Response-Time result.
4.3. CPU-Utilization Analysis
A time series analysis against average CPU utilization was to understand how database server’s CPU resource was consumed by the transactions. The Table 4 shows how R script producing the Figure 5 graphics. The graphics showed the CPU-Utilization had the same behavior as Transaction-Count did; it implied the high CPU utilization was caused by increasing transactions.
4.4. CPU-Utilization vs. Transaction-Count Analysis
The above analyses posited the CPU utilization was caused by the increasing transactions. The Table 5 shows how R script producing the Figure 6 graphics and the statistical information about the regression. The graphics showed the quadratic regression analysis of against CPU utilization and transactions. It also showed how significant the regression was in blue color. The regression showed the intercept was 49.32 and the slope was 0.00002229 under confidence level of 99.9%. The finding confirmed the behavior of the above analyses. Based on the regression formula, the Figure 7 showed the forecast of CPU utilization for various volumes of transactions respectively. The reason why quadric regression was chosen instead of linear one was because MES administrators were conservative about the forecasted transactions; they wanted to reserved additional CPU resource to cover some required CPU intensive MES processes [8]. The CPU utilization quality attribute was set no more than 80%; according to the forecast, the virtual machine can support the transactions up to 12 million around.
4.5. CPU vs. Paging-Faults and I/O-Average Analysis
Since the observed system behavior implied CPU utilization was consumed by increasing transactions; in fact, CPU was also consumed by memory paging and I/O in operating system perspective. Further investigation identified how Paging-Faults and I/O-Average contributed to the consumption of CPU-Utilization. This finding will suggest MES administrators to change related configurations or add more computing resources into the system. Thus a multi-variables regression of CPU-Utilization against Paging-Faults and I/O-Average was needed. The Table 6 shows how R script producing the Figure 8 graphics and the statistical information about the regression. The graphics showed the linear regression analysis of CPU-Utilization
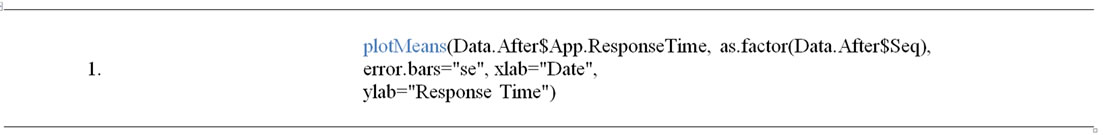
Table 3. R for Response-Time ~ Time.
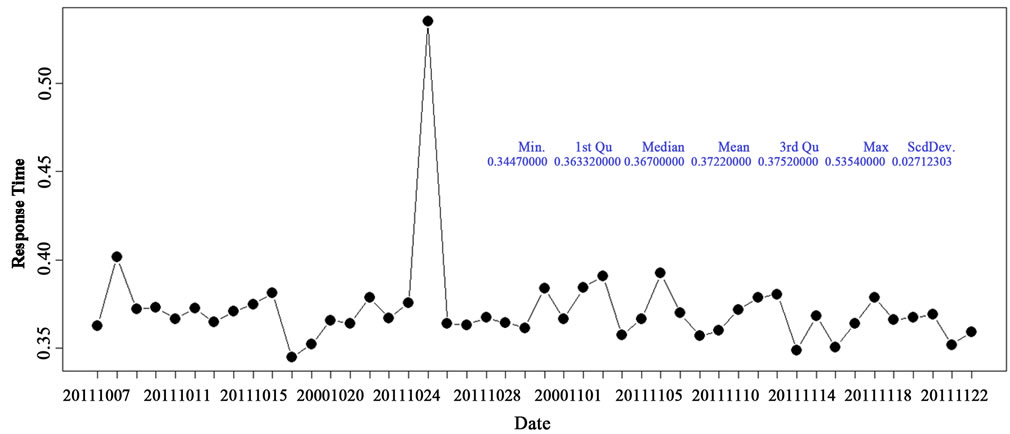
Figure 4. Snapshot: Response Time ~ Time.
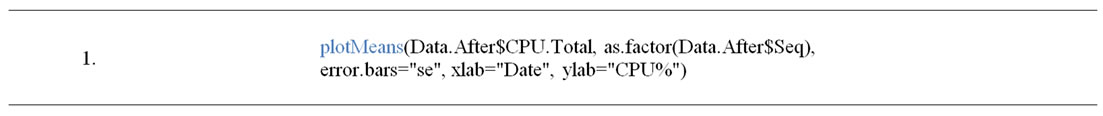
Table 4. R for CPU-Utilization ~ Time.
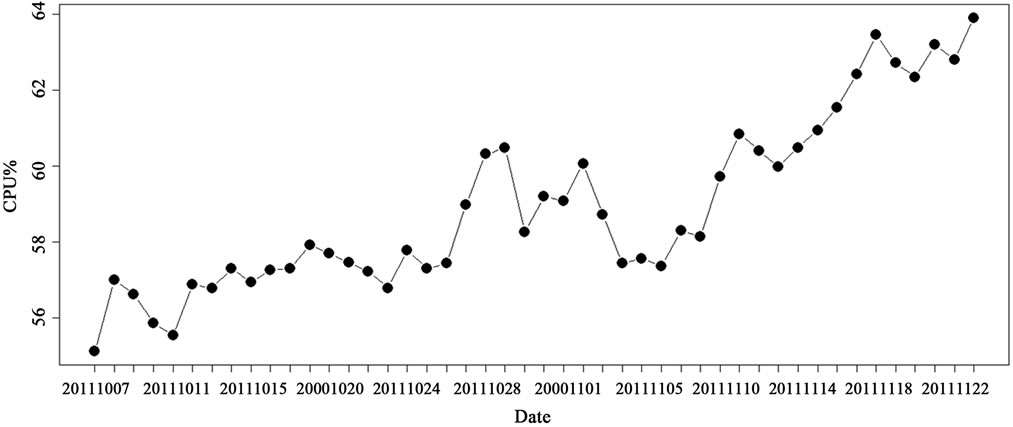
Figure 5. Snapshot: CPU-Utilization ~ Time.
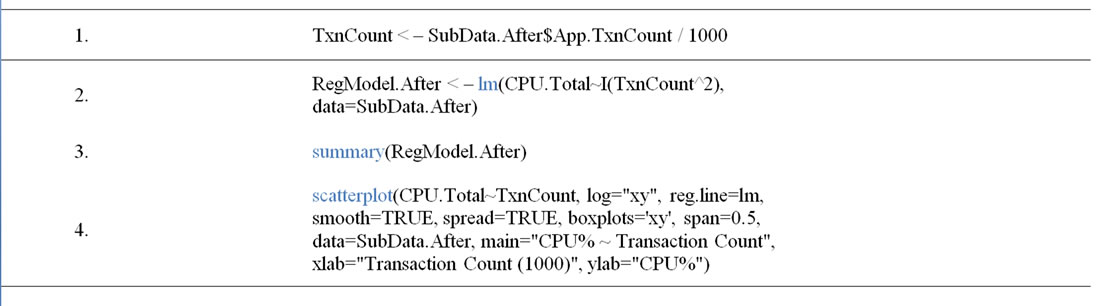
Table 5. R for CPU-Utilization ~ Transactions.
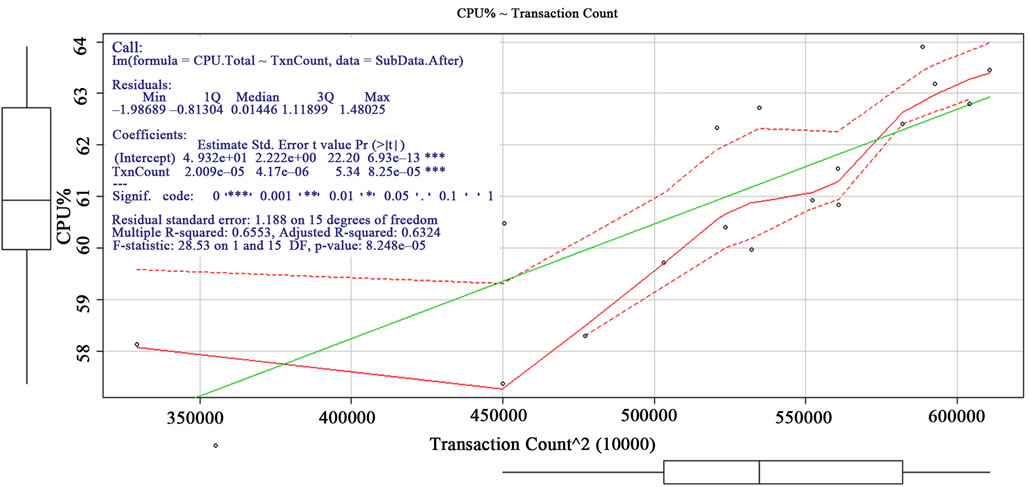
Figure 6. Snapshot: CPU-Utilization ~ Transaction-Count.
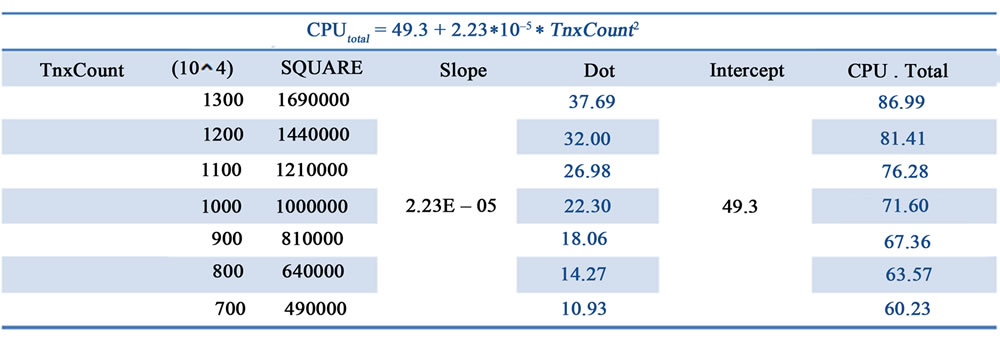
Figure 7. Snapshot: Forecast of CPU-Utilization.
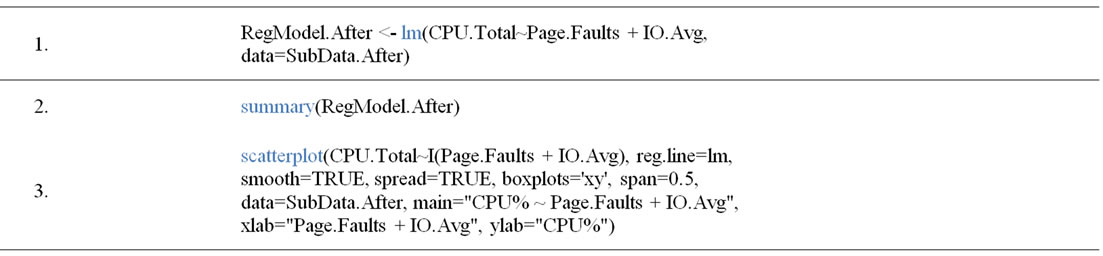
Table 6. R for CPU-Utilization ~ Page-Faults + I/O-Average.
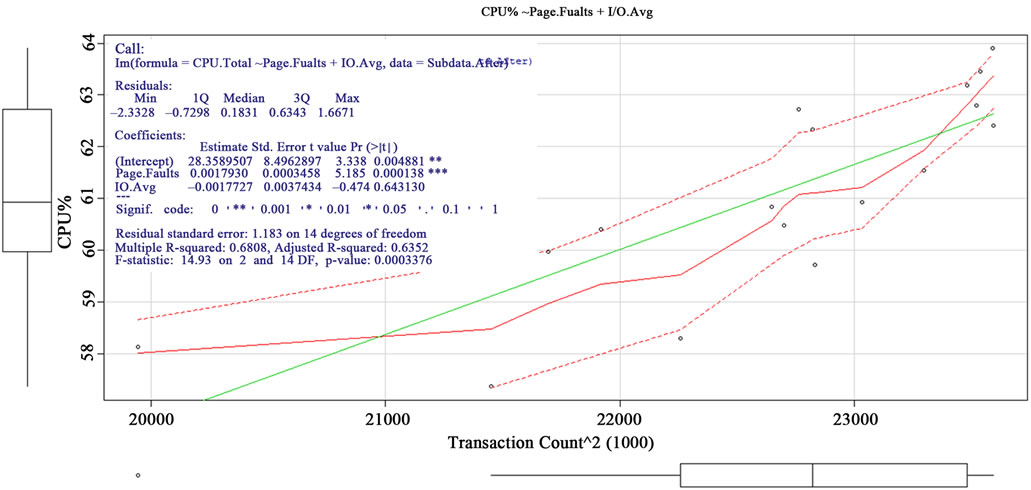
Figure 8. Snapshot: CPU ~ Page Faults + I/O-Average.
against Paging-Faults and I/O-Average. The statistical information showed Paging-Faults was more significant than I/O-Average under 99.9% confidence level to CPUUtilization.
4.6. Paging-Faults vs. Transaction-Count Analysis
Based on the previous analysis, the CPU utilization was consumed by Memory Management Unit (MMU) handling the paging faults [9]. The Table 7 shows how R script producing the Figure 9 graphics and the statistical information about the regression. The graphics showed the quadratic regression analysis of Paging-Faults against transactions. The regression showed the intercept was 14250 and the slope was 0.0117 under confidence level of 99.9%. Based on the regression formula, the Figure 10 showed the forecast of Paging-Faults for various volumes of transactions. This finding suggested MES ad

Table 7. R for Page-Faults ~ Transaction-Count.
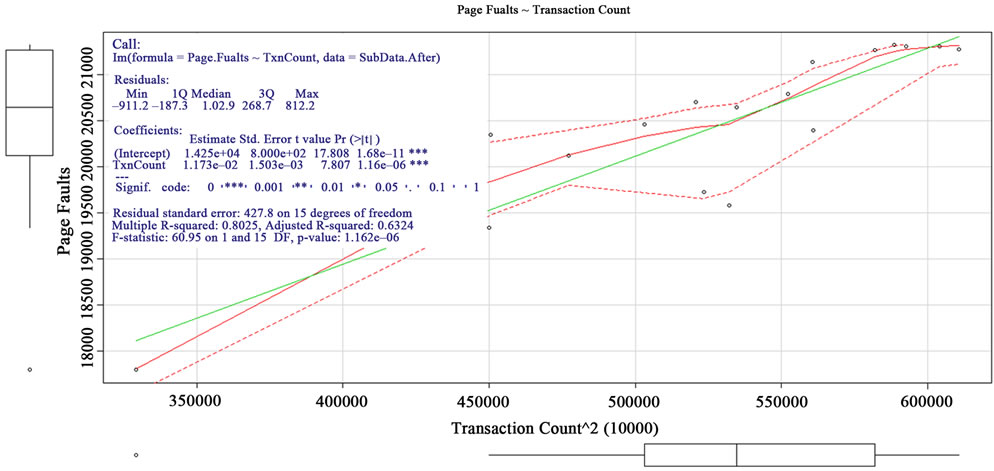
Figure 9. Snapshot: Paging-Faults ~ Transaction-Count.
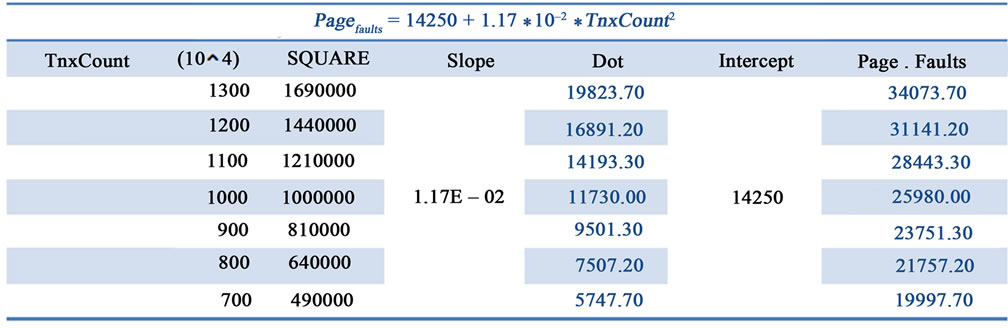
Figure 10. Snapshot: Forecast of Page-Faults.
ministrators may consider assigning more CPU resource into the system to improve Paging-Faults [10]. However, the Paging-Faults were still within the acceptable range.
5. Conclusion and Future Work
Managing critical systems in a cloud computing environment is a challenging task to system administrators for various application behaviors running on numerous Virtual machines. The performance analysis is a complicated process. System administrators cannot posit the performance behavior by intuition or personal experience respectively. The performance analysis must be conducted on a solid grounding with theory. Statistics offers that solid grounding to the performance analysis. It infers the behavior by observing past history and to determine the possible counters that affect the performance more.
This paper demonstrated an analytical processes for performance analysis: 1) using time series analysis to understand the chronicle behavior, 2) using descriptive statistical information to understand how performance counter was distributed, 3) using regression to develop a formula for forecasting, 4) using significance analysis of regression to show how strong the formula agree to the behavior. To conduct such as performance analysis task, the analyst must have adequate domain knowledge about the system and those performance counters as well.
This paper also answered the long-needed framework built with a reliable robust mechanism on top of ESB. It was an SOA implementation using GNU-R as the statistical engine to access vivid performance data from centralized database. R scripts produce statistical information and export statistical graphics into image files. System administrators can conveniently view these performance analyses through a web portal.
The proposed framework was still very primitive but workable. System administrators can develop more useful statistical models for different scenarios. The framework gives much room in reusing and disseminating these performance analysis results into daily decision making.
REFERENCES
- M. Armbrust, A. Fox, R. Griffith, A. D. Joseph, R. Katz, A. Konwinski, G. Lee, D. Patterson, A. Rabkin and I. Stoica, “A view of cloud computing,” Communications of the ACM, vol. 53, No. 4, 2010, pp. 50-58. doi:10.1145/1721654.1721672
- T. Wood, L. Cherkasova, K. Ozonat and P. Shenoy, “Profiling and Modeling Resource Usage of Virtualized Applications,” Lecture Notes in Computer Science, Vol. 5346, 2008, pp. 366-387. doi:10.1007/978-3-540-89856-6_19
- L. Uhsadel, A. Georges and I. Verbauwhede, “Exploiting hardware performance counters,” Proceedings of the 2008 5th Workshop on Fault Diagnosis and Tolerance in Cryptography, 10 August 2008, pp. 59-67. doi:10.1109/FDTC.2008.19
- L. O’Brien, P. Merson and L. Bass, “Quality attributes for Service-Oriented Architectures,” International Workshop on Systems Development in SOA Environments, 20-26 May 2007, p. 3. doi:10.1109/SDSOA.2007.10
- L. G. Williams and C. U. Smith, “PASA SM: a method for the Performance Assessment of Software Architectures,” Proceedings of the 3rd International Workshop on Software and performance, Rome, July 24-26, 2002, pp. 179- 189.
- T. Dreibholz and E. P. Rathgeb, “Overview and evaluation of the Server Redundancy and Session Failover Mechanisms in the Reliable Server Pooling Framework,” International Journal on Advances in Internet Technology, vol. 2, No. 1, 2009, pp. 1-14.
- T. Erl, M. Little, A. Simon and T. Rischbeck, “Modern ESB Infrastructure,” Prentice Hall, Upper Saddle River, 2010.
- L. P. Carloni, A. B. Kahng, S. V. Muddu, A. Pinto, K. Samadi and P. Sharma, “Accurate Predictive Interconnect Modeling for System-Level Design,” IEEE Transactions on Very Large Scale Integration (VLSI) Systems, vol. 18, No. 4, 2010, pp. 679-684. doi:10.1109/TVLSI.2009.2014772
- M. Ben-Yehuda, J. Xenidis, M. Ostrowski, K. Rister, A. Bruemmer and L. Van Doorn, “The price of safety: Evaluating IOMMU performance,” Proceedings of the Linux Symposium, Ottawa, 02 July 2007, pp. 9-20.
- C. M. Collazo, “Aggregate System Resource Analysis Including Correlation Matrix and Metric-Based Analysis,” US Patent No. 20020152304, 2008.